
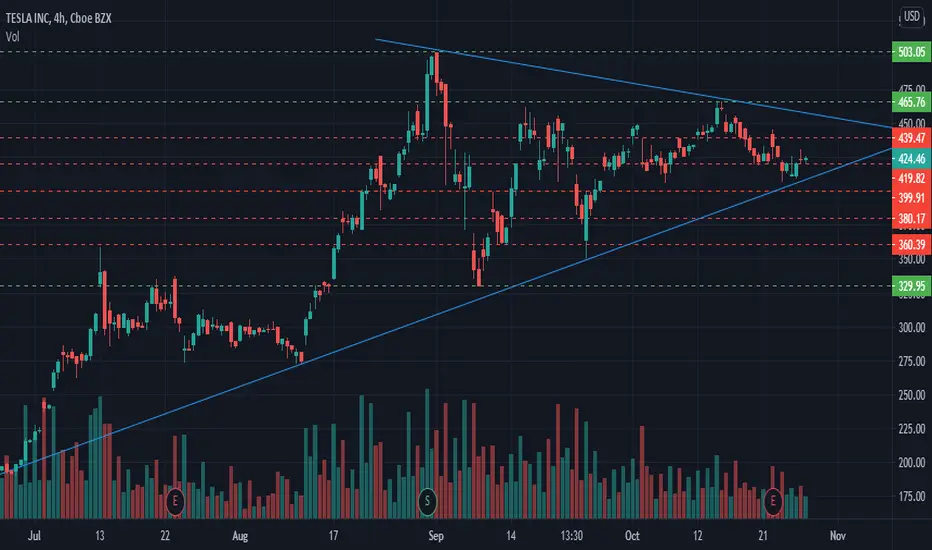
Nice Symetrical Triangle forming on the 4H/Daily charts! Could be either bullish or bearish. Looking forward to enter a small swing position when price action starts moving outside the triangle with volume!
If Bullish, the break of the 465 level could make this run all the way to ATH.
(Don't mind red levels.. I use these for intra-day trading.)
If Bullish, the break of the 465 level could make this run all the way to ATH.
(Don't mind red levels.. I use these for intra-day trading.)

Penafian
Maklumat dan penerbitan adalah tidak bertujuan, dan tidak membentuk, nasihat atau cadangan kewangan, pelaburan, dagangan atau jenis lain yang diberikan atau disahkan oleh TradingView. Baca lebih dalam Terma Penggunaan.
Penafian
Maklumat dan penerbitan adalah tidak bertujuan, dan tidak membentuk, nasihat atau cadangan kewangan, pelaburan, dagangan atau jenis lain yang diberikan atau disahkan oleh TradingView. Baca lebih dalam Terma Penggunaan.