
Hi!
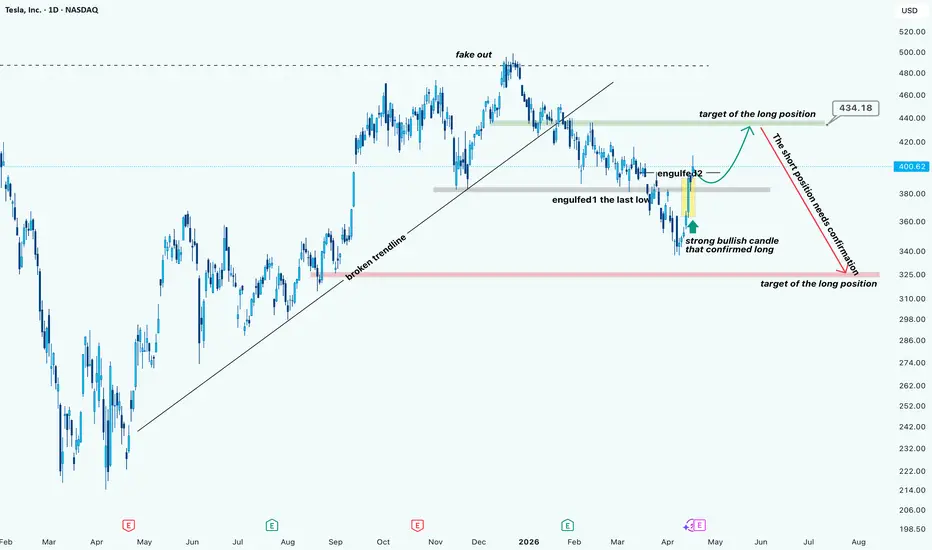
After the breakdown of the ascending trendline, the structure clearly shifted from bullish continuation into a corrective phase. The move above the previous highs turned into a fake breakout, which was followed by consistent lower highs.
Recently, price swept the previous low and formed a strong bullish reaction. The key detail here is the engulfing structure:
This is not random; it’s a liquidity grab + demand reaction, which often leads to a short-term bullish push.
Current Scenario
As long as price holds above the recent demand zone, the bias remains bullish in the short term.
The expected move is a push toward the green supply area around $434.
What happens at $434?
That’s the important part.
This move up is not a confirmed trend reversal, yet it’s more likely a corrective rally inside a broader bearish structure.
At the $430–$435 zone, we should expect:
👉 From there, a potential drop can happen, but:
Short positions require confirmation (rejection, lower high, bearish engulfing, etc.)
Alternative Scenario
If price breaks and holds above $434, then the structure shifts again, and the bearish idea becomes invalid, opening room for continuation higher.
After the breakdown of the ascending trendline, the structure clearly shifted from bullish continuation into a corrective phase. The move above the previous highs turned into a fake breakout, which was followed by consistent lower highs.
Recently, price swept the previous low and formed a strong bullish reaction. The key detail here is the engulfing structure:
- First, the market took liquidity below the last low
- Then printed a strong bullish engulfing candle, confirming buyer presence
This is not random; it’s a liquidity grab + demand reaction, which often leads to a short-term bullish push.
Current Scenario
As long as price holds above the recent demand zone, the bias remains bullish in the short term.
The expected move is a push toward the green supply area around $434.
What happens at $434?
That’s the important part.
This move up is not a confirmed trend reversal, yet it’s more likely a corrective rally inside a broader bearish structure.
At the $430–$435 zone, we should expect:
- Weakening bullish momentum
- Possible rejection
- Or distribution
👉 From there, a potential drop can happen, but:
Short positions require confirmation (rejection, lower high, bearish engulfing, etc.)
Alternative Scenario
If price breaks and holds above $434, then the structure shifts again, and the bearish idea becomes invalid, opening room for continuation higher.
Dagangan aktif
Dagangan ditutup: sasaran tercapai
The long position hit the target!For short position wait, please!

🟢 Telegram channel: t.me/melikatrader94
🔴 Forex channel: t.me/melikatrader94GoldForex
🟢 ADX & DFM channel: t.me/ADXandDFM
🔴 Tiktok: tiktok.com/@melikatrader94?is_from_webapp=1&sender_device=pc
🔴 Forex channel: t.me/melikatrader94GoldForex
🟢 ADX & DFM channel: t.me/ADXandDFM
🔴 Tiktok: tiktok.com/@melikatrader94?is_from_webapp=1&sender_device=pc
Penerbitan berkaitan
Penafian
Maklumat dan penerbitan adalah tidak bertujuan, dan tidak membentuk, nasihat atau cadangan kewangan, pelaburan, dagangan atau jenis lain yang diberikan atau disahkan oleh TradingView. Baca lebih dalam Terma Penggunaan.
🟢 Telegram channel: t.me/melikatrader94
🔴 Forex channel: t.me/melikatrader94GoldForex
🟢 ADX & DFM channel: t.me/ADXandDFM
🔴 Tiktok: tiktok.com/@melikatrader94?is_from_webapp=1&sender_device=pc
🔴 Forex channel: t.me/melikatrader94GoldForex
🟢 ADX & DFM channel: t.me/ADXandDFM
🔴 Tiktok: tiktok.com/@melikatrader94?is_from_webapp=1&sender_device=pc
Penerbitan berkaitan
Penafian
Maklumat dan penerbitan adalah tidak bertujuan, dan tidak membentuk, nasihat atau cadangan kewangan, pelaburan, dagangan atau jenis lain yang diberikan atau disahkan oleh TradingView. Baca lebih dalam Terma Penggunaan.