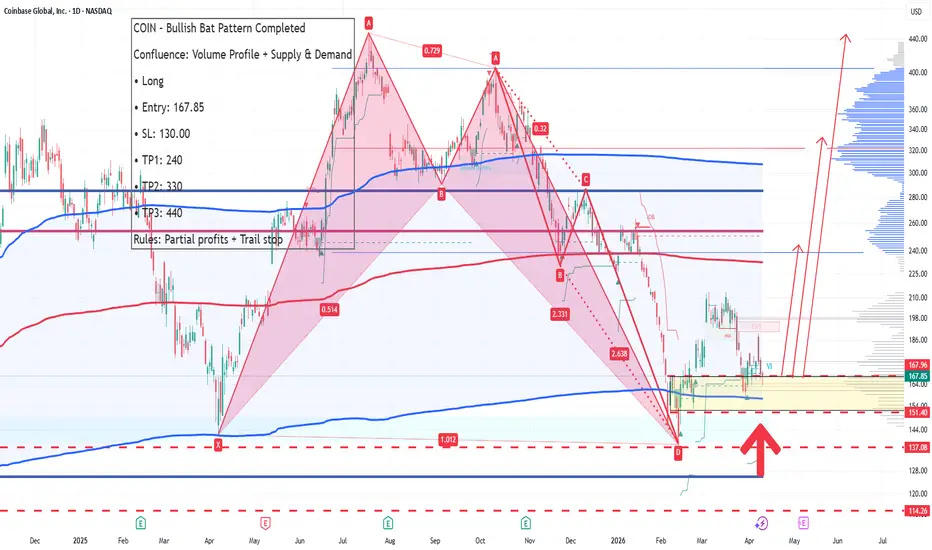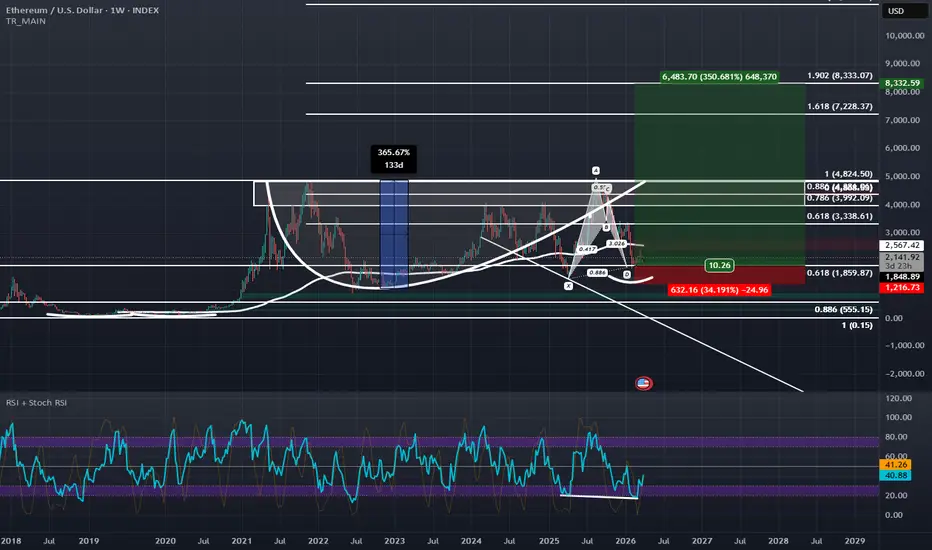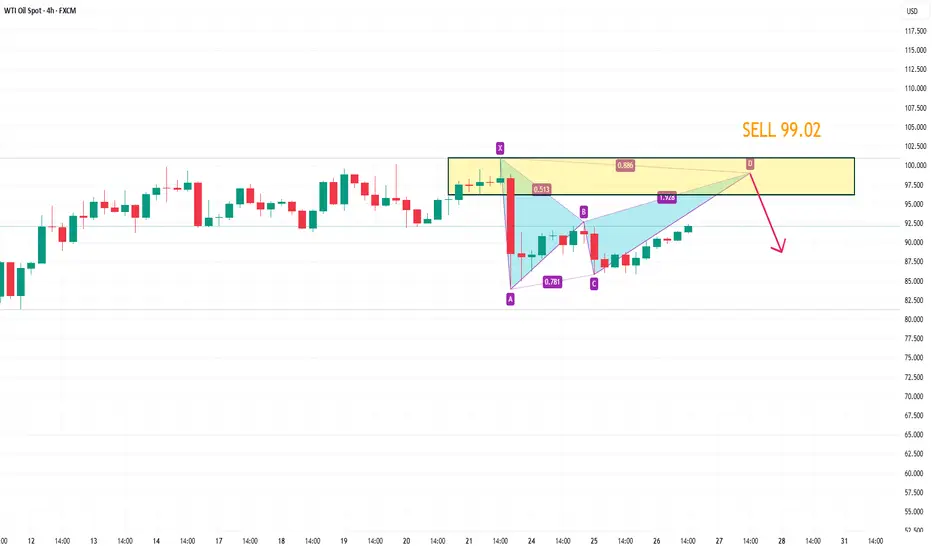
Peter Thiel Sells Entire Stake in Eth Treasury Firm ETHZillaBillionaire investor Peter Thiel and affiliated Founders Fund entities have fully exited their position in Ethereum treasury firm ETHZilla, according to a 13G filing with the US Securities and Exchange Commission.
The filing shows zero ownership in the company as of Dec. 31, 2025, down from a 7.5% stake disclosed in August 2025. The move marks a full reversal of what was once seen as a major institutional endorsement of corporate Ethereum treasury strategies.
Thiel’s investment was initially revealed when ETHZilla rebranded from biotech company 180 Life Sciences and shifted to a digital asset treasury model. The disclosure pushed the stock up more than 90% in a single trading session at the time.
Following news of the full exit, ETHZilla shares fell nearly 7% in premarket trading to around $3.20. The stock now trades roughly 97% below its peak of over $107 reached last August.
ETHZilla Cuts Ether Holdings and Changes Strategy
ETHZilla launched its Ethereum treasury strategy on Aug. 18, 2025, after raising $565 million from more than 60 investors, including Electric Capital, Polychain Capital, and GSR.
The company aimed to become an Ethereum-focused accumulation vehicle that would hold ETH and generate yield through staking. At its peak, the company held more than 100,000 Ether.
However, the firm began reducing its holdings as market conditions weakened and debt obligations increased. In October, ETHZilla sold about $40 million worth of Ether to fund a $250 million stock repurchase program.
In December, the company sold an additional 24,291 ETH valued at $74.5 million to redeem senior secured convertible notes.
The company currently holds 69,802 ETH, valued at roughly $139 million to $140 million at current market prices. The position ranks ETHZilla as the sixth-largest corporate holder of Ethereum.
The firm said its future value will be driven by revenue and cash flow from real-world asset tokenization rather than direct crypto accumulation.
Pivot Toward Tokenization and New Revenue Streams
ETHZilla has shifted its focus toward tokenization initiatives. On Feb. 5, the company acquired a portfolio of 95 manufactured and modular home loans for about $4.7 million, which it plans to tokenize on an Ethereum Layer 2 network with an expected annualized yield of 10.36%.
The firm also purchased two CFM56-7B24 aircraft engines for tokenization through the Liquidity.io platform, an SEC-regulated alternative trading system. It recently launched a tokenized aviation product offering equity exposure to leased jet engines.
Bat
4240 Technical Analysis: Bat Pattern at Key Support4240 (Fawaz Abdulaziz AlHokair Co. / AFG International Company)
Price is trading at a strong weekly support, supported by bullish divergence on RSI. A bullish harmonic Bat pattern has formed at this zone, adding confluence to the setup.
Structure remains constructive as long as price holds above the rising trendline. The stop loss is defined on a closing basis below this structure to clearly manage risk. Buy 2 is positioned lower to allow for a better average in case of a pullback into support.
Recommended Levels:
Buy 1: 17.70 (CMP)
Buy 2: 16.85
Stop Loss: Closing below 15.50
Take Profit 1: 20.00
Take Profit 2: 24.00
Take Profit 3: 30.00 / Ride the trend with a trailing stop
Potential remains intact as long as price sustains above the weekly support and rising trendline.
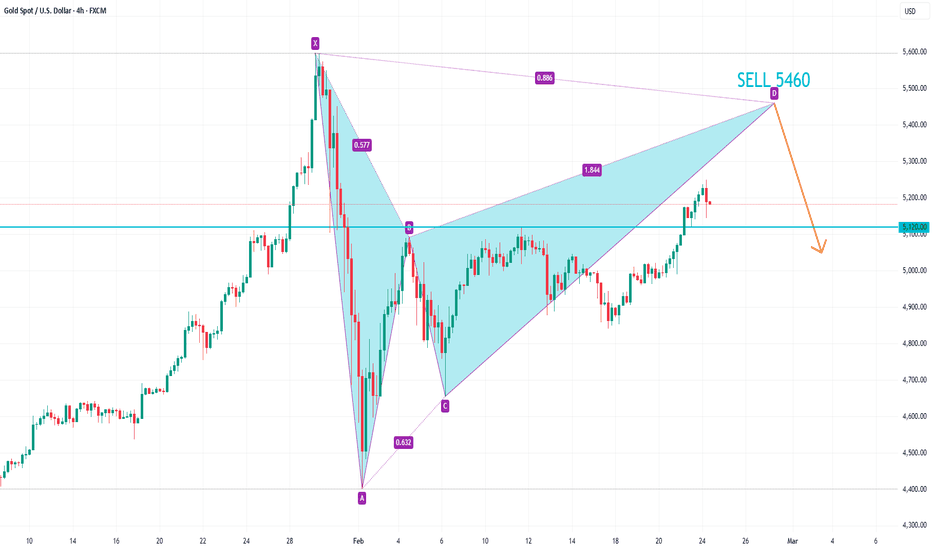
An At Market & Future Trading Opportunity on GOLDWhat’s Really Going On With Gold?
Gold took a sharp hit to close out last week—but let’s keep things in perspective. This market has been on a massive bullish run, and after a move like that, consolidation isn’t a surprise… it’s normal.
Barring any unexpected geopolitical headlines, the most logical next phase for gold is a pause. And pauses are where some of the best advanced pattern opportunities tend to show up.
A Potential Setup Forming
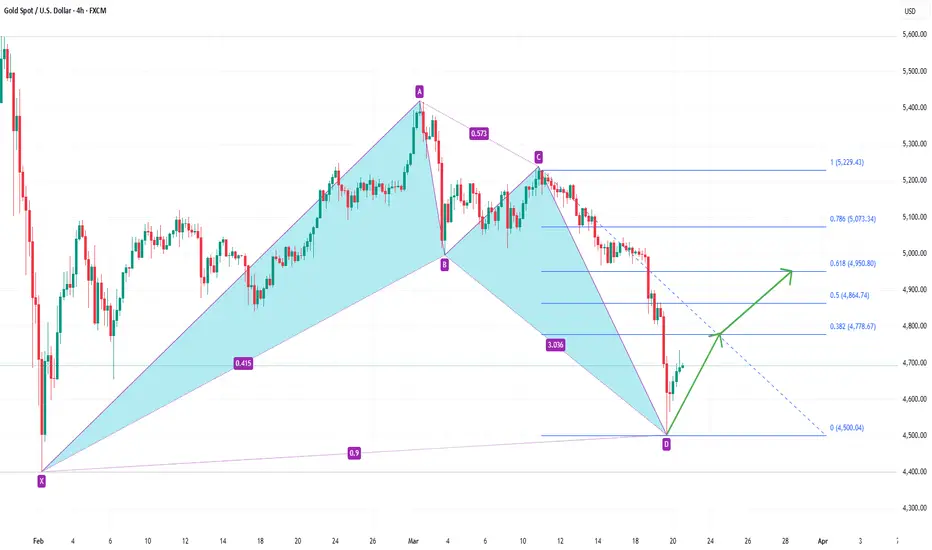
Dropping down to the 4-hour chart makes things clearer & immediately puts a bat pattern on the radar.
Something Already in Play
If you’re looking for a setup right now, gold has already completed a bearish cypher pattern near the end of last week. Price is currently trading inside the cypher completion zone, which helps explain the recent hesitation and chop.
If you have any questions, comments or want to share your ideas, please do so below!
I wish you guys a great trading week ahead!
Akil
Basic Attention Token is about to confirm its new uptrend...Very special. Here we are seeing two things, the end of a 2,254 days long downtrend, followed by a bullish continuation, something that will soon become the technical confirmation of a new uptrend...
Good morning my fellow Cryptocurrency trader, I hope you are having a wonderful day.
Recently we looked at XTZBTC and ADABTC; see how these BTC trading pairs reveal something hidden. Possibly the fact that some projects will do great while others won't. Something incredible, a rising trend within a declining market? Let's go a bit deeper on this chart.
The downtrend is no more but this isn't a new development, it ended June 2025, a long time ago. As the downtrend ends, a new all-time low, the first move is always a strong reaction, here the initial bullish breakout.
For a new uptrend to be confirmed two things need to happen: The initial bullish breakout retrace must end in a higher low and, we get a higher high next. This seems to be exactly the case.
BATBTC is now turning green after two months of bearish action, a classic correction. Since we are seeing a strong higher low — last week (late January 2026) the low was 0.00000153 while last year (mid June 2025) the low was 0.00000109.
With a bullish resumption and higher high, which is implied in the current chart structure, BATBTC will confirm its first uptrend ever. This is happening in a bear market year. "Many projects will be growing strong while the rest of the market goes down. The Cryptocurrency market is young but will continue to grow and evolve."
The BTC trading pairs are looking great right now. I will continue to share with you those that look pretty interesting.
Thank you for reading. Buy and hold.
Namaste.
BLong
LAES Bullish Bat with Three Rising Valleys ReversalPattern Identified: Bullish Bat with strong confluence at Potential Reversal Zone (PRZ).
Key Confluence:
Harmonic PRZ: D aligns with 0.886 XA extension
Price Action: Three rising valleys forming at PRZ - showing accumulation and higher low structure
Momentum: Bullish divergence present on MACD
Elloit wave DXY 1/31/2026In my view, the DXY is likely to experience one final impulsive move toward the 127 level before entering a broader bearish phase. This outlook is supported by three main reasons.
1. Macro Elliott Wave Structure
From a long-term perspective, DXY completed wave Ⓐ at the end of 1992 and is currently in wave Ⓑ.
Zooming into wave Ⓑ, we can see that wave (b) retraced approximately 101%–123.6% of wave (a). As a result, this suggests that wave (c) should extend to around 101%–161.8% of wave (a) in order to complete wave Ⓑ.
2. Harmonic Confirmation (Alternate Bat Pattern)
The alternate Bat harmonic pattern further supports this view, indicating that wave (c) could reach approximately 113% of wave Ⓐ, which corresponds to a DXY level near 127, before the larger macro wave Ⓒ begins.
3. Triangle Formation in Wave (c)
In my view, wave (c) of wave Ⓑ is forming a triangle pattern. As shown on the chart, the market appears to be nearing the end of wave (D). This structure implies that a final wave (E) is still required to complete the triangle before the next major move.
Micro Perspective
On a lower time frame, when zooming into wave (D), DXY appears to be in wave c of wave (D). A bearish Gartley harmonic pattern suggests a potential 1.5% pullback.
Additionally, the micro wave count implies that one more minor wave 5 is needed to complete this structure
NASDAQ: Spotting a Bullish Continuation OpportunityDespite a mixed week in the stock market, the NASDAQ continues to show signs of strength. One of the key things I’m watching is the series of higher lows that has formed over the past three months. When a market consistently puts in higher lows, it’s often building pressure for an eventual breakout to the upside.
Dropping down to the 4-hour timeframe reveals a potential advanced harmonic setup. Using Fibonacci retracement from the most recent swing low to swing high, price pulls back to the 50% level—putting us on alert for a possible BAT pattern. If the structure completes, the ideal entry zone would be near the 88.6% retracement, which also aligns with a prior level of market structure.
That confluence is important. It’s where trend, structure, and pattern all come together.
Of course, discipline is key. If price doesn’t reach the completion level, there’s no trade. You don’t force setups—you wait for the market to meet your rules.
For traders already bullish on the NASDAQ, this setup offers a structured and logical reason to look for continuation rather than chasing price higher.
Please leave any questions of comments below & remember to hit that "Like" button before you go?
Akil
GBPJPY Bullish Setup: Combining a Classic & Advanced PatternToday we’re looking at GBPJPY, and what stands out is a high-quality bullish opportunity that blends both a classic pattern formation and an advanced pattern formation into one trade idea.
On the higher timeframes, price recently broke out of a bullish pennant pattern and has recently pulled back to retest the prior structure level that was violated during the breakout.
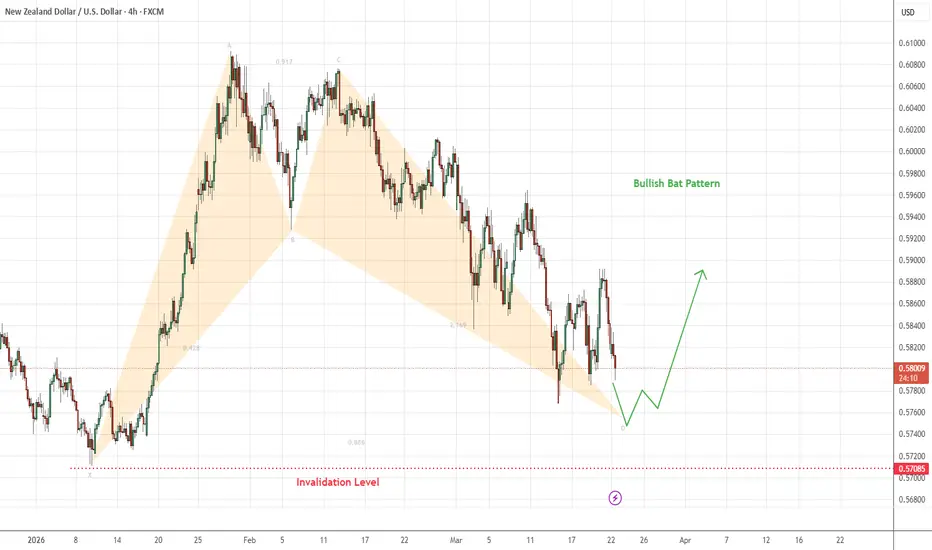
During the pullback, price action has begun forming a potential bullish Bat pattern.
Three Ways to Trade This Opportunity
1. Trade the Bat Pattern Only
The Bat pattern is a stand-alone trading opportunity. You can execute the trade purely based on the harmonic completion zone, managing risk and taking profits at traditional Bat pattern targets.
2. Use the Bat as Confirmation for the Bigger Breakout Trade
In this approach, the Bat pattern becomes your reason for entry into the larger bullish continuation move that originated from the pennant breakout. Here, the focus is less on harmonic targets and more on holding for trend continuation.
3. Combine Both Approaches (Hybrid Strategy)
This is often the most flexible option. You can:
Take partial profits at traditional Bat pattern levels, but keep a portion of the position open to participate in the larger breakout-driven move
This allows you to reduce risk, pay yourself early, and still maintain exposure to a potentially strong continuation.
Please let me know if you have any questions and feel free to share you views on this pair below.
Akil
BTCUSD SELL 104400On the daily chart, BTCUSD has stabilized and is trending upwards, with the short-term bullish trend in control. Currently, the resistance level to watch is around 104400, which is a potential shorting entry point for a bearish bat pattern and is also within a previous supply zone.
BAT Analysis (4H)From the point we marked as the start, BAT appears to have entered a bullish diametric pattern.
It now seems to be in wave F, which is a bearish wave.
We have identified two entry points for BAT, where positions can be opened using a DCA approach.
The targets have been marked on the chart.
A daily candle close below the invalidation level will invalidate this analysis.
For risk management, please don't forget stop loss and capital management
When we reach the first target, save some profit and then change the stop to entry
Comment if you have any questions
Thank You
Longterm Elloit wave SBUX 12/18/2025In my view, Starbucks has completed its first major wave, which began in 1992. We can observe that wave (b) retraced more than 80% of wave (a), indicating a high probability that wave (c) could form an expanded flat correction.
Moreover, SBUX has tested its long-term trendline multiple times without breaking above its all-time high, which suggests a bearish outlook. A Bat harmonic pattern further supports this view, projecting a target range around 17–20, which also aligns with a major historical support/resistance zone for SBUX.
BAT Analysis (1D)The structure of BAT is bullish, but we should not forget that it is approaching a key level.
BAT is getting close to a strong liquidity pool.
If price reaches the LP zone, we will look for sell / short positions toward the marked targets.
A daily candle close above the invalidation level will invalidate this analysis.
Do not enter the position without capital management and stop setting
Comment if you have any questions
thank you
$BAT 1WThe BITMEX:BAT in the weekly timeframe is in a downtrend and is trading within a descending channel.
The price is forming lower highs and lower lows.
The channel's midline is a critical and important level, which could create a bullish bounce.
However, if it breaks below this level, a price drop to the channel's bottom is anticipated.
XAUUSD is watching the support level at 4257On the 4-hour chart, XAUUSD has retreated from its highs. Currently, watch for support around 4257. If it doesn't break below 4257, it may resume its bullish trend. However, if the price breaks below 4257, it will continue to fall, with further support around 4191, a potential buy point for a bullish bat pattern.
GBPUSD has formed a bearish bat patternOn the daily chart, GBPUSD encountered resistance after testing the previous supply zone, forming a bearish bat pattern in the short term. Currently, shorting opportunities may arise, with a downside target around 1.3285, and a further downside target of 1.3191 if this level is broken.