Bearish Patterns
AR/USDT: Descending Channel Breakdown & Retest | Short Setup Market Overview ARUSDT:
Arweave (AR/USDT) on Binance 4-Hour Timeframe has recently experienced a breakdown below its major multi-week descending channel pattern that guided price action across September and October.
After pushing up to tests around the $4.80 level, AR has printed a series of lower highs and lower lows. Price has now broken below key horizontal support around $3.20 and is retesting the lower boundary of the channel.
Key Technical Breakdown:
Market Pair: AR / USDT Perpetual (B
Bitcoin Cash Price Prediction: BCH/USDT Headed Toward SupportOverview: BCHUSDT Perpetual Contract (4h Chart)
Bitcoin Cash (BCH) on the 4-hour timeframe is showing clear signs of weakness after breaking below local trendline support. Following a prolonged consolidation inside a descending channel and a minor breakdown through the $275 zone, price action is signaling a potential corrective leg downward.
Will buyers step in at the blue demand blocks, or will BCH sweep lower liquidity zones before recovery? Let's analyze the critical levels and probable pric
EUR/NZD BEARISH BIAS RIGHT NOW| SHORT
Hello, Friends!
EUR-NZD uptrend evident from the last 1W green candle makes short trades more risky, but the current set-up targeting 1.976 area still presents a good opportunity for us to sell the pair because the resistance line is nearby and the BB upper band is close which indicates the overbought state of the EUR/NZD pair.
Disclosure: I am part of Trade Nation's Influencer program and receive a monthly fee for using their TradingView charts in my analysis.
✅LIKE AND COMMENT MY IDEAS
GOLD BEST PLACE TO SELL FROM|SHORT
GOLD SIGNAL
Trade Direction: long
Entry Level: 3,912.53
Target Level: 3,856.47
Stop Loss: 3,949.89
RISK PROFILE
Risk level: medium
Suggested risk: 1%
Timeframe: 1h
Disclosure: I am part of Trade Nation's Influencer program and receive a monthly fee for using their TradingView charts in my analysis.
✅LIKE AND COMMENT MY IDEAS✅
Gold is Nearing a Strong Resistance Area!Hey Traders, in today's Trading session we are monitoring XAUUSD for a selling opportunity around 4000 zone, Gold is trading in a downtrend and currently is in a correction phase in which it is approaching the trend at 4000 support and resistance area.
Trade safe, Joe.
EURJPY - Strong Intersection for Sellers?EURJPY has been overall bearish, trading within the falling wedge pattern marked in red, with sellers maintaining control of the broader market structure.
However, price is currently experiencing a bullish correction toward an important technical area.
📊 Technical Outlook
EURJPY is approaching a strong intersection of two technical factors:
🔴 Upper bound of the falling wedge, which has been acting as dynamic resistance throughout the recent bearish movement.
🔴 Major supply zone around 177.5
EUR/USD BEARS ARE STRONG HERE|SHORT
Hello, Friends!
EUR/USD pair is in the downtrend because previous week’s candle is red, while the price is obviously rising on the 4H timeframe. And after the retest of the resistance line above I believe we will see a move down towards the target below at 1.114 because the pair is overbought due to its proximity to the upper BB band and a bearish correction is likely.
Disclosure: I am part of Trade Nation's Influencer program and receive a monthly fee for using their TradingView charts i
TSLA BEARS WILL DOMINATE THE MARKET|SHORT
TSLA SIGNAL
Trade Direction: short
Entry Level: 399.95
Target Level: 370.03
Stop Loss: 419.83
RISK PROFILE
Risk level: medium
Suggested risk: 1%
Timeframe: 9h
Disclosure: I am part of Trade Nation's Influencer program and receive a monthly fee for using their TradingView charts in my analysis.
✅LIKE AND COMMENT MY IDEAS✅
AUD/NZD SENDS CLEAR BEARISH SIGNALS|SHORT
Hello, Friends!
AUD/NZD pair is trading in a local downtrend which know by looking at the previous 1W candle which is red. On the 9H timeframe the pair is going up. The pair is overbought because the price is close to the upper band of the BB indicator. So we are looking to sell the pair with the upper BB line acting as resistance. The next target is 1.237 area.
Disclosure: I am part of Trade Nation's Influencer program and receive a monthly fee for using their TradingView charts in my ana
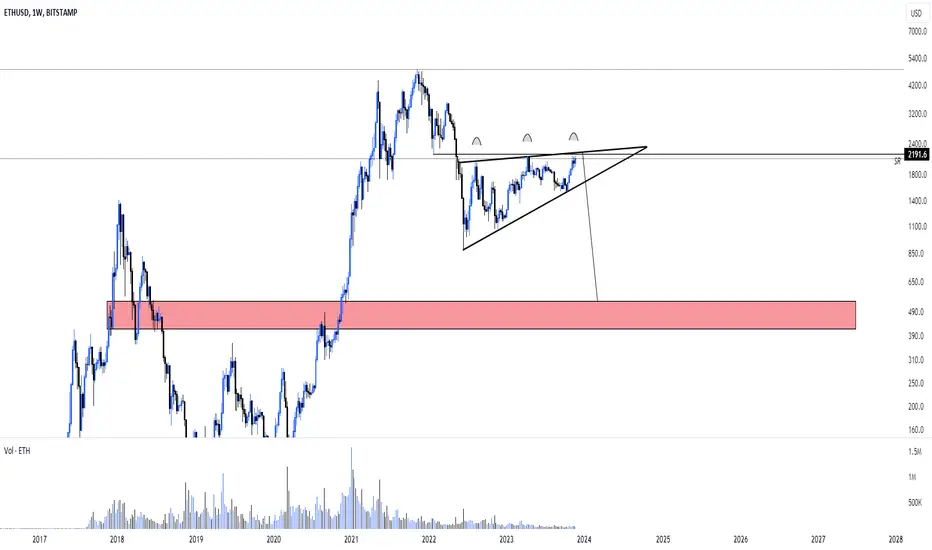
ETH Macro AnalysisEth is currenty making Bearish pennat Pattern as you all know about me that i m still bearish on BTC on Macro level.
But I trade BTC,ETH & ALts level by level regardless of beaish senerio
as you have seen my previous ideas regarding RUNE SOL APE and many more which i tell you to buy on dip with complete analysis & I also tell you about mini bull run in march .you can visit my wall to see that.
But i know that this not a real bull run, bull run will start in the end of 2025 or 2026 even if btc g
CHF/JPY BEARISH BIAS RIGHT NOW| SHORT
Hello, Friends!
We are now examining the CHF/JPY pair and we can see that the pair is going up locally while also being in a uptrend on the 1W TF. But there is also a powerful signal from the BB upper band being nearby, indicating that the pair is overbought so we can go short from the resistance line above and a target at 190.626 level.
Disclosure: I am part of Trade Nation's Influencer program and receive a monthly fee for using their TradingView charts in my analysis.
✅LIKE AND COMMENT
$AKE JUST CRASHED 93% FROM ATH! THIS IS WHY I WARNED YOU!EURONEXT:AKE JUST CRASHED 93% FROM ATH! THIS IS WHY I WARNED YOU!
On September 20, I told you NOT to chase EURONEXT:AKE near $0.164 ATH.
Today, just 40 days later:
$0.164 → $0.0109 Which is -93.35% DUMP!
Imagine investing $100K at ATH. Today, you'd have just $6,646 LEFT!
I genuinely hope you followed my warning and saved your hard-earned money.
Remember, missing an opportunity is better than losing your capital.
DON'T CHASE FOMO. DON'T CHASE HYPE.
Earn less, but protect your portfolio. M
$AIN UP 1,353% IN 2 MONTHS! BUT HERE'S MY WARNING…NYSE:AIN UP 1,353% IN 2 MONTHS! BUT HERE'S MY WARNING…
The rollercoaster isn't stopping!
▶️ Price: $0.28558
▶️ +1,353% in 2 months
▶️ +700% in just 7 days
But remember: NEVER chase green candles at ATH levels.
When the dumping starts, you'll remember this warning.
Momentum creates opportunities, but greed can destroy profits.
Is another leg up coming, or is a brutal correction ahead?
#AIN
NFA & DYOR
GBP/AUD BEARS WILL DOMINATE THE MARKET|SHORT
GBP/AUD SIGNAL
Trade Direction: short
Entry Level: 1.909
Target Level: 1.899
Stop Loss: 1.916
RISK PROFILE
Risk level: medium
Suggested risk: 1%
Timeframe: 1h
Disclosure: I am part of Trade Nation's Influencer program and receive a monthly fee for using their TradingView charts in my analysis.
✅LIKE AND COMMENT MY IDEAS✅
GBPAUD: Bearish Triangle Nearing CompletionWe last discussed GBPAUD on September 30, when we highlighted a potential bearish triangle that could be forming within the ongoing downtrend.
The latest price action suggests that this triangle may finally be nearing completion, potentially setting the stage for another impulsive move lower.
GBPAUD has fallen sharply this year, and the broader Elliott Wave structure still points to an incomplete bearish impulse. In a basic bearish impulse, the market moves lower in five waves, with waves 1, 3,
GBP/USD SELLERS WILL DOMINATE THE MARKET|SHORT
Hello, Friends!
GBP/USD pair is in the uptrend because previous week’s candle is green, while the price is clearly rising on the 4H timeframe. And after the retest of the resistance line above I believe we will see a move down towards the target below at 1.326 because the pair overbought due to its proximity to the upper BB band and a bearish correction is likely.
Disclosure: I am part of Trade Nation's Influencer program and receive a monthly fee for using their TradingView charts in my a
EUR/USD BEARISH BIAS RIGHT NOW| SHORT
EUR/USD SIGNAL
Trade Direction: short
Entry Level: 1.113
Target Level: 1.111
Stop Loss: 1.115
RISK PROFILE
Risk level: medium
Suggested risk: 1%
Timeframe: 1h
Disclosure: I am part of Trade Nation's Influencer program and receive a monthly fee for using their TradingView charts in my analysis.
✅LIKE AND COMMENT MY IDEAS✅
NASDAQ 100 Elliott Wave: Bearish Impulse Nearing Completion?The Nasdaq 100 remains under pressure, but the current decline may be approaching completion as price moves toward the key 29000K-28500K support area. From an Elliott Wave perspective, the index could be forming the final fifth wave of a bearish impulse.
According to Elliott Wave theory, a five-wave impulsive decline is commonly followed by a corrective rally, often unfolding in an A-B-C structure. Therefore, if support holds and the five-wave decline completes, we could see the Nasdaq 100 stab
$ZIG: 80% DOWNSIDE SETUP? THE WEEKLY CHART IS FLASHING A WARNINGAMEX:ZIG : 80% DOWNSIDE SETUP? THE WEEKLY CHART IS FLASHING A WARNING!
#ZIG is currently forming a bearish flag on the weekly timeframe. However, the breakdown is NOT confirmed yet.
Breakdown below $0.038 could trigger a potential 40%–80% downside move from the breakdown zone.
Downside Support Targets: $0.026/$0.014/$0.0076
Stop Loss: weekly close above $0.067.
From July 2023 to December 2024, AMEX:ZIG delivered a massive ~4,148% rally. After such an explosive advance, the current structur
USD Strength Could Crush Gold!Hey Traders,
In the coming week, we will be monitoring XAUUSD (Gold) for a potential selling opportunity around the 4,100 zone.
From a technical perspective, Gold is currently trading within a broader downtrend and appears to be going through a corrective phase. We are watching for price to move back toward the trendline and the key 4,100 support and resistance area, which could act as a potential selling zone if bearish momentum returns.
From a fundamental perspective, the upcoming FOMC meet
EURUSD is Nearing a Strong Resistance Area!Hey Traders, in today's trading session we are monitoring EURUSD for a selling opportunity around 1.11900 zone, EURUSD is trading in a downtrend and currently is in a correction phase in which it is approaching the trend at 1.11900 support and resistance area.
Trade safe, Joe.
$BTC LIQUIDITY SWEEP: THE REVERSAL SETUP I'M WATCHING.CRYPTOCAP:BTC LIQUIDITY SWEEP: THE REVERSAL SETUP I'M WATCHING.
Bitcoin swept the previous high near $82K and has now shifted short-term market structure around $80.4K.
My SMC plan:
➡️ Entry: Retest of the bearish Market Structure Shift (MSS)
➡️ Retest Short Entry Zone: $80,000-$804,00
➡️ Invalidation: HTF candle close above $84,870
➡️ Target 1: $75K–$76K sell-side liquidity
➡️ Target 2: $62K–$65K sell-side liquidity
I won't chase the breakdown. I want a retest and bearish confirmation first
USDJPY – A Strong Intersection for Sellers?USDJPY has been overall bearish, trading within the falling wedge pattern marked in red, with sellers maintaining control of the broader price structure.
However, following its recent bullish correction, price is now approaching an important technical area where sellers could step in once again.
📊 Technical Outlook
USDJPY is currently approaching the upper bound of its falling wedge, which intersects with a strong supply zone marked in blue.
This creates an interesting confluence of two te