Bullish Divergence
$TTD: Falling Wedge + Higher-Timeframe RSI Bullish DivergenceNASDAQ:TTD is showing a technical setup worth watching as price continues to compress inside a falling wedge structure.
The key signal here is not just the wedge itself, but the momentum behavior underneath price. RSI is showing bullish divergence across multiple higher timeframes:
Weekly RSI bullish divergence
2-week RSI bullish divergence
3-week RSI bullish divergence
This suggests downside momentum may be weakening while price continues to trade near the lower end of the structure.
From a technical perspective, falling wedges can become important reversal structures when price begins to tighten, volatility compresses, and momentum starts improving before price confirms the move.
For confirmation, I would want to see:
A clean breakout above wedge resistance
Improving volume on the breakout
RSI continuation higher
Price reclaiming prior resistance levels
Until then, this remains a watchlist setup, not a confirmed reversal.
Invalidation would be a sustained loss of wedge support with RSI failing to improve.
Overall, NASDAQ:TTD is setting up as a higher-timeframe bullish divergence watch. The chart still needs confirmation, but the structure and momentum are worth monitoring closely.
This is not financial advice. This is my personal technical analysis and trading plan for educational discussion.
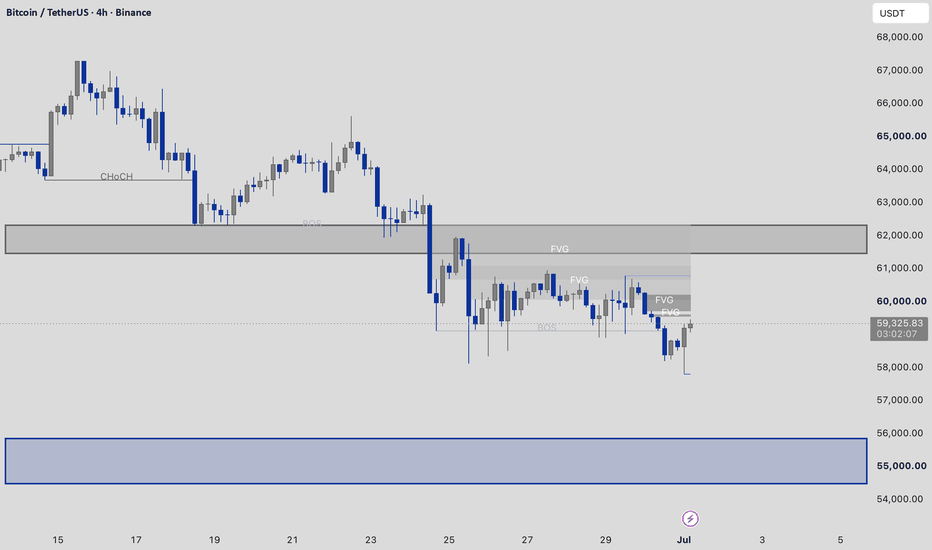
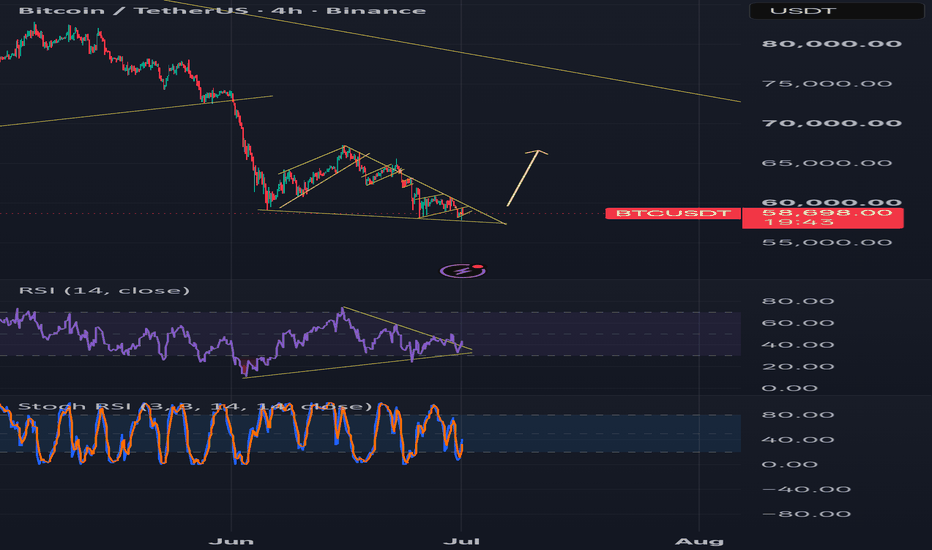
BTC Update: Selling Pressure Fades at Support🔍 Technical Analysis (H4 Timeframe)
Bullish Signs: On the daily chart, consecutive candlesticks with long lower shadows combined with a Bullish Divergence on the RSI signal that selling momentum is exhausting.
Rebound Potential: If buyers successfully defend the current support zone, we can expect a technical rebound to retest the 61K – 62K resistance area.
⚠️ Key Scenarios to Watch
The Bull Case: The 61K – 62K zone remains a crucial pivot. BTC needs a strong breakout and a daily close above this level to invalidate the short-term bearish structure.
The Bear Case: Conversely, failure to reclaim 61K – 62K will likely confirm a lower high, resumption of the macro downtrend, and a drop toward the major support pocket at 54K – 56K.
🎯 Trading Strategy
Action Plan: Wait and watch price action closely around the 61K – 62K cluster.
Market Bias: The mid-term bias still leans toward further correction. Risk management is key here, and the 54K – 56K zone remains our primary downside target if the bears regain control.
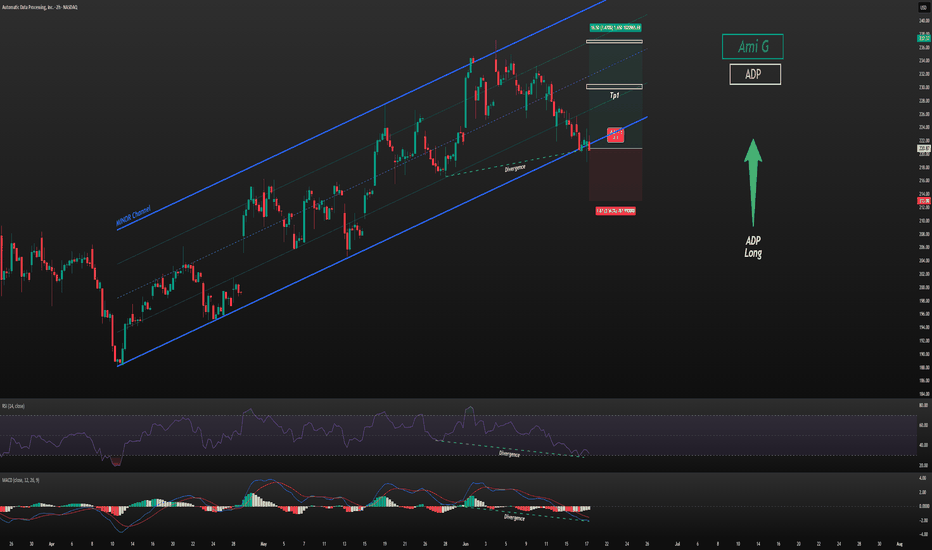
Live trading on ADP stockADP — Live Trade Setup NASDAQ:ADP
As you can see, price is currently trading near the lower boundary of its valid 67-day channel.
At the same time, both MACD and RSI are showing strong bullish divergences, adding further confluence to this setup.
In addition, one of our trading systems has generated a buy signal in this area, suggesting a potentially attractive long opportunity.
From here, price could potentially move:
first toward TP1
and then continue higher toward TP2.
As always, manage risk properly and trade according to your own strategy.
Follow proper risk and money management.
This is just my personal view, so please trade based on your own strategy and trading system.
Feel free to share your thoughts in the comments.
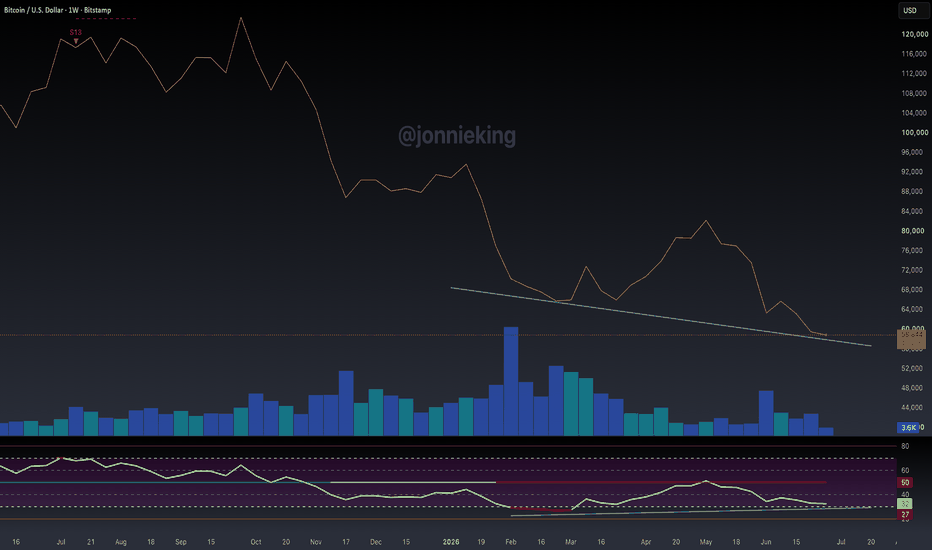
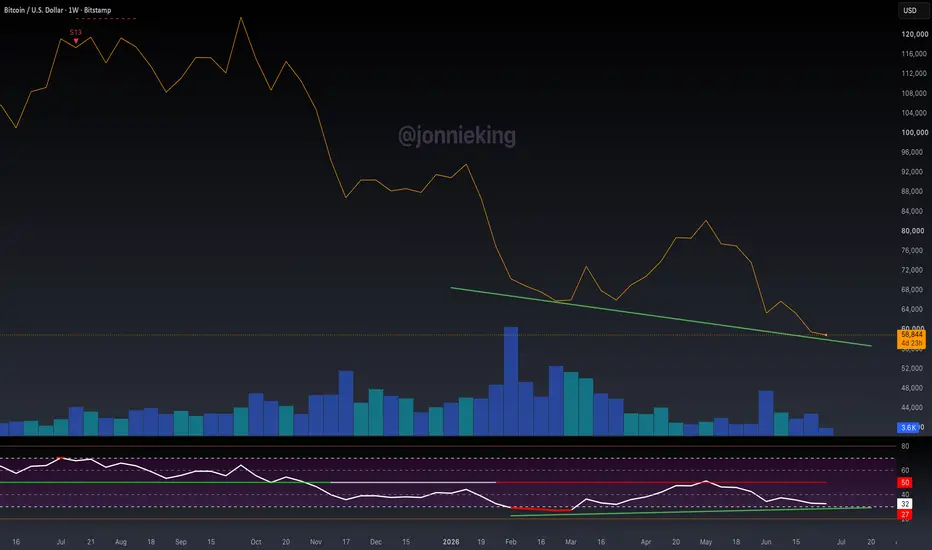
$BTC Very WEAK Bullish Divergence LESSON - Must ReadLately I’ve been seeing a ton of large accounts calling for a
CRYPTOCAP:BTC bottom because of the extremely weak bullish divergence on the Weekly chart.
This means absolutely nothing without confluence from PA, volume and other indicators-- all which are horrendous, such as volume which you can clearly see.
If PA keeps going lower, the bull div goes away, along with this silly bull-slop.
Example:
Low #1: BTC = $65,200 RSI = 27
Low #2 (today): BTC = $58,500 RSI = 32
That's a bullish RSI divergence because price made a lower low while RSI made a higher low.
But if ₿itcoin keeps falling...
Low #3: BTC = $54,000 RSI = 25
The divergence is invalidated because RSI made a lower low (25 < 27).
Bullish divergences aren't permanent. They can disappear if price and RSI continue making new lows before reversing.
The important threshold isn't the price, it's the RSI.
As long as BTC keeps making lower lows while RSI stays above ~27, the bullish divergence remains intact. If a future weekly low pushes RSI below that prior low, the divergence is no longer valid.
Please be careful with the financial advice you take from people on X and YouTube. Most of these people have very little experience with technical analysis and just shill you bull-slop for clicks.
Live trading on Altria Group (MO) stock.Altria Group (MO) — Live Trade Setup NYSE:MO
As you can see, price is currently trading near the lower boundary of its 50-day range channel. At the same time, the latest bearish move shows reasonable bullish divergences on both MACD and RSI.
In addition, one of our trading systems has generated a buy signal in this area, suggesting a potentially attractive long opportunity.
From here, price could potentially move:
first toward TP1
and then continue higher toward TP2.
As always, manage risk properly and trade according to your own strategy.
Follow proper risk and money management.
This is just my personal view, so please trade based on your own strategy and trading system.
Feel free to share your thoughts in the comments.
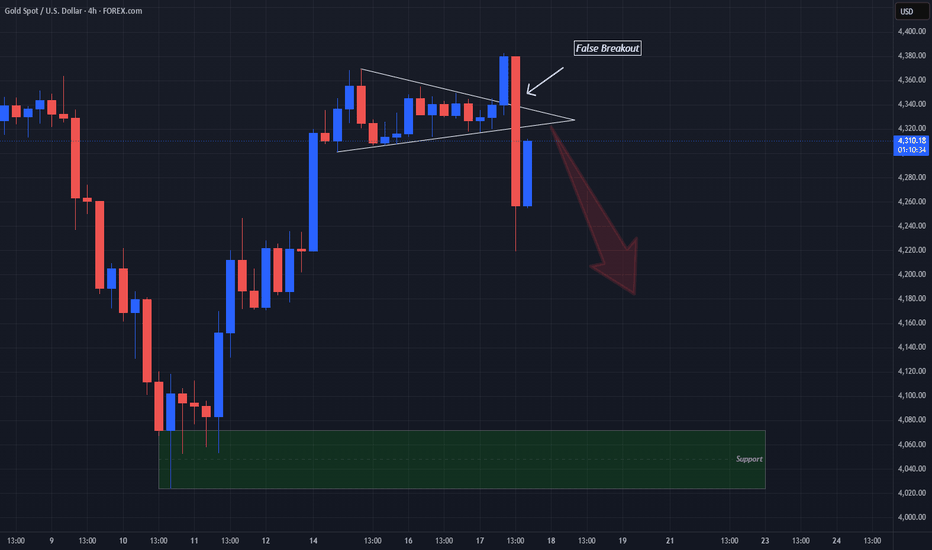
The New Fed Chair Has Gold Scared!!Price on OANDA:XAUUSD had been trading in a Pennant pattern up until we had the Interest Rates set by the Federal Reserve today delivering not only 1 but 2 breakouts, lets break it down!
Even though the Federal Reserve had Held Interest Rates today, the announcement of future Rate Hikes on the table had severely weakened OANDA:XAUUSD resulting in a False Breakout of the Falling Resistance and delivering a Breakout of the Rising Support of the Pennant.
Remember, OANDA:XAUUSD is a non-yielding asset and Interest Rate Hikes increase yield on assets that generate fixed-income.
-The Bullish Divergence formed on the RSI from the 2 Highs points to a further drop in price!
Currently price is pulling back to the Rising Support and I suspect a Retest of this Breakout is imminent!
If the retest is successful, the former Support-turned-Resistance should generate a Short Opportunity to take price down to the next Support Level!
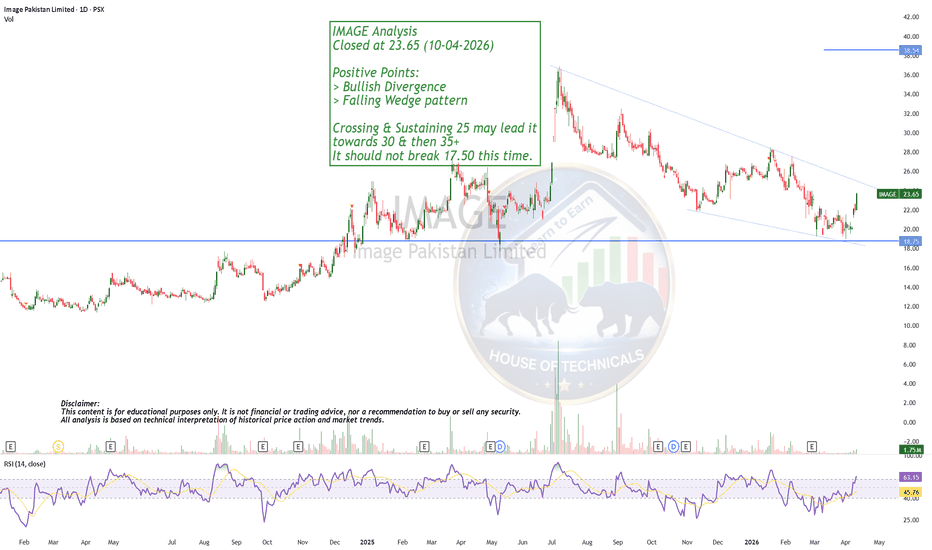
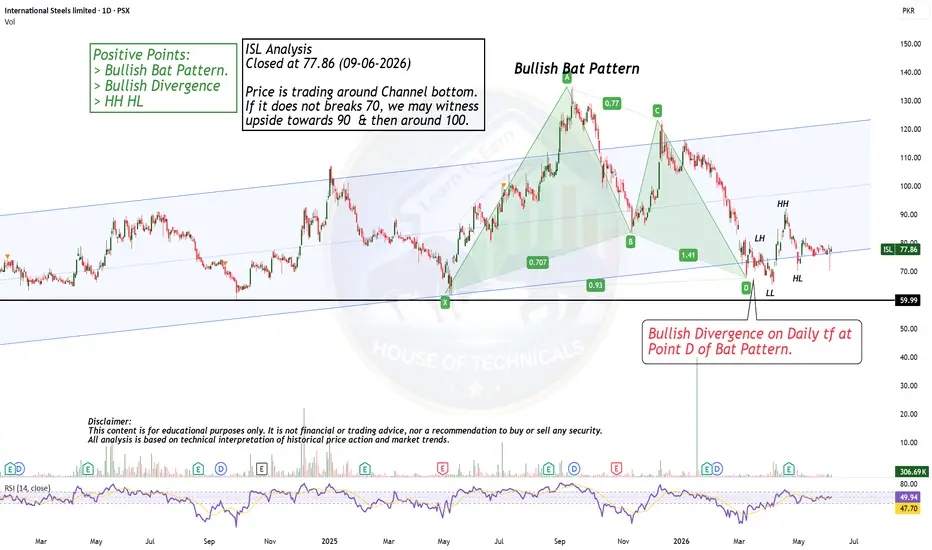
Bullish Divergence at Support!TREET Analysis
Closed at 25.13 (13-05-2026)
Bullish Divergence.
Seems like taking Support from a Very Strong Support Zone (22 - 25).
Sustaining this zone may lead it towards 32 - 34.
Fresh Entry should be taken once the price prints HL in current mentioned range.
Breaking 20 may expose next support levels around 16 - 17.
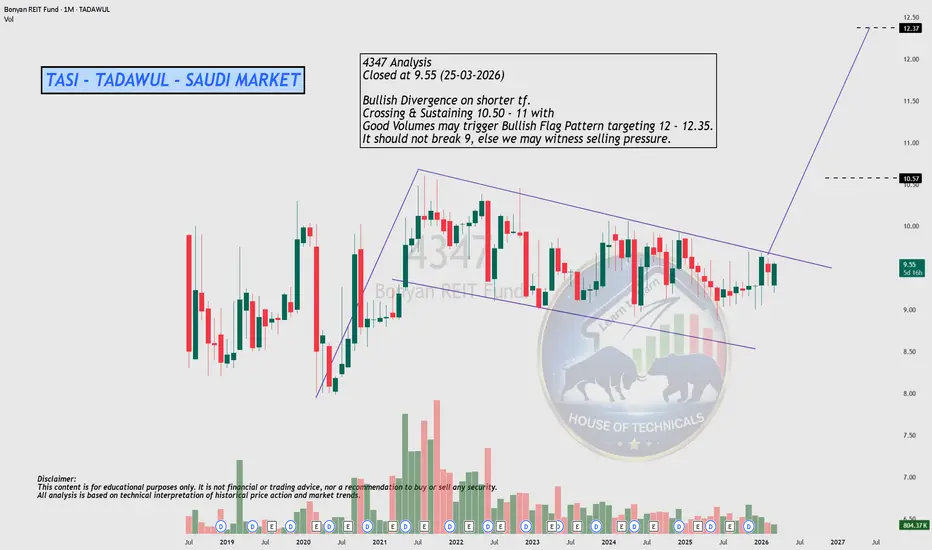
Bullish Pennant Pattern Appearing!MTL Analysis
Closed at 569.71 (09-05-2026)
Positive Points:
> Strong Bullish Divergence
> 50% Retracement
> Fundamental Developments including sale of combined harvestor & also
buying some land for dairy business(not officially announced though).
> Bullish Pennant pattern; targeting around 1000 - 1100. However 750 - 770
is the strong resistance zone that needs to sustain for the upside target of 1000+
> Breaking 460 may bring more selling pressure towards 410 - 418.
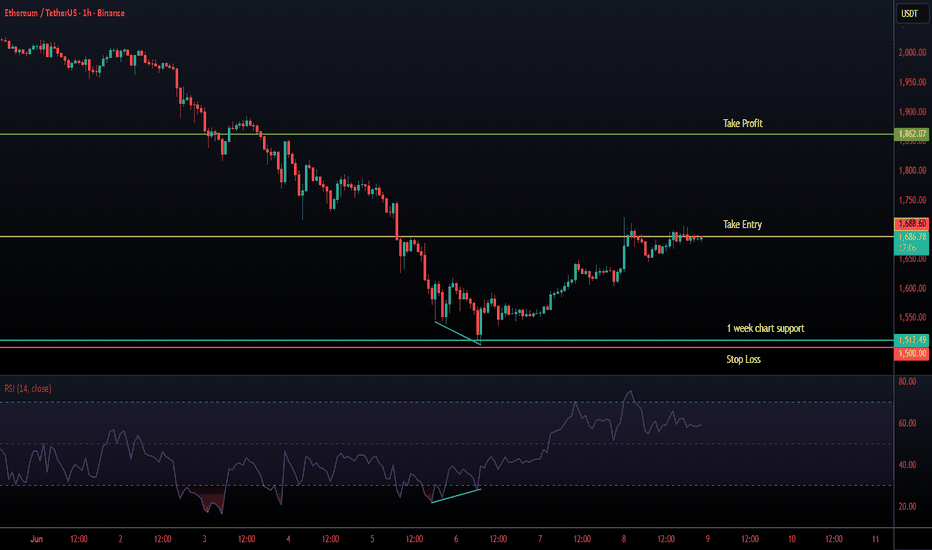
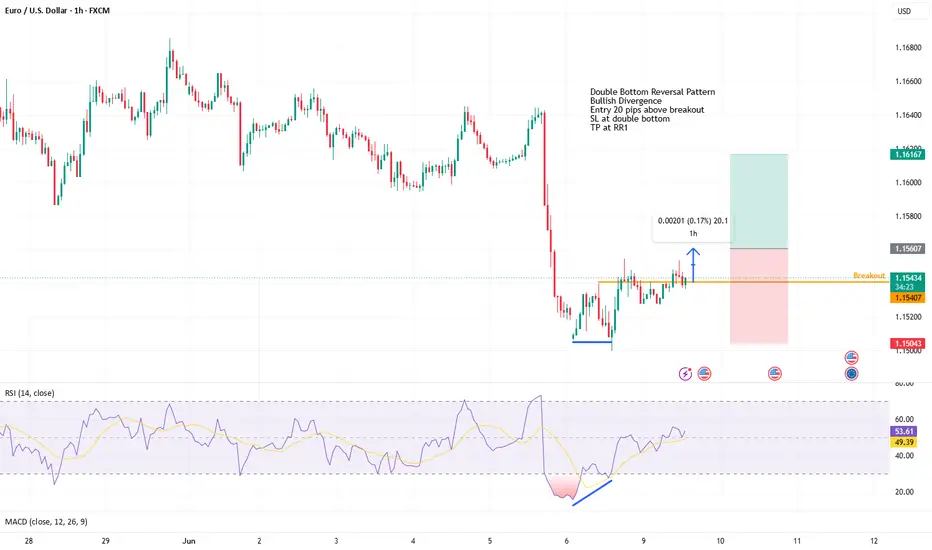
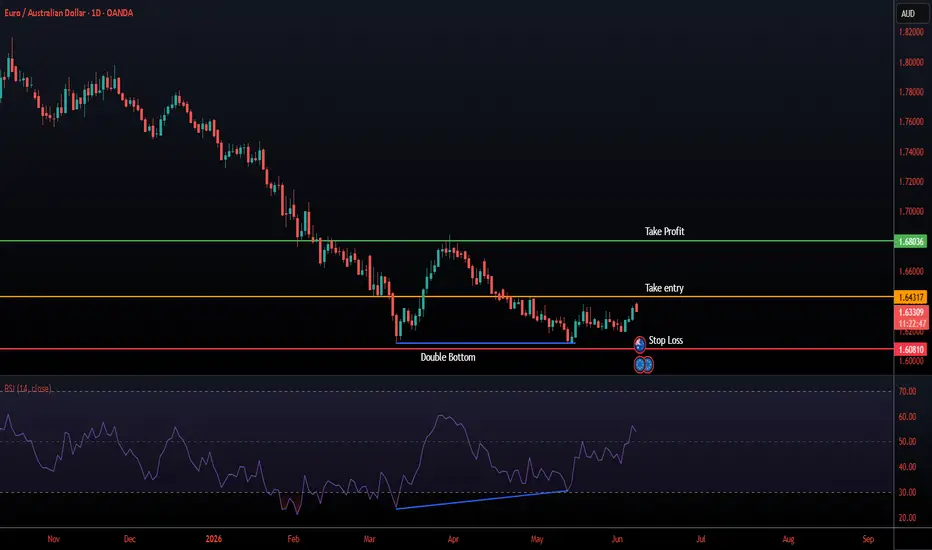
XAUUSDXAUUSD remains in a bearish trend overall; however, the 4-hour timeframe has formed a bullish pin bar at a key support level, indicating potential buying pressure. In addition, the 1-hour timeframe has created a bullish divergence, suggesting weakening bearish momentum and the possibility of a short-term bullish correction.