GOLD 1H CHART - MARKET ROUTE MAP Hey Everyone,
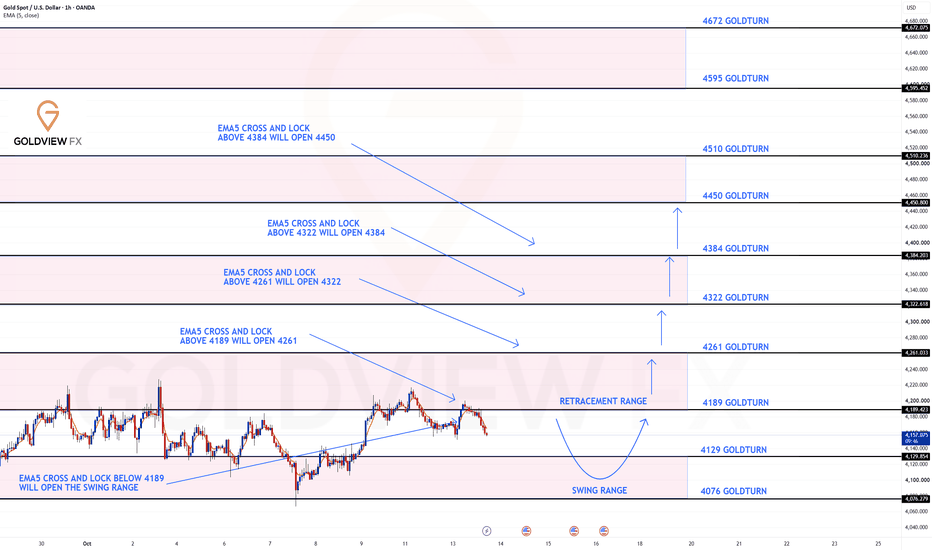
Gold continues to respect our previously shared market route map, with the 4261 upside gap remaining open on our radar.
As highlighted in our previous report, 4189 was the key decision point. Price has since tested this level, failed to maintain support and broken below, bringing our established swing range back into play.
🔴 4189 BROKEN – SWING RANGE ACTIVE
With 4189 support now broken, price is currently trading within our identified swing range.
4129 remains the key swing su
Bullish Flag
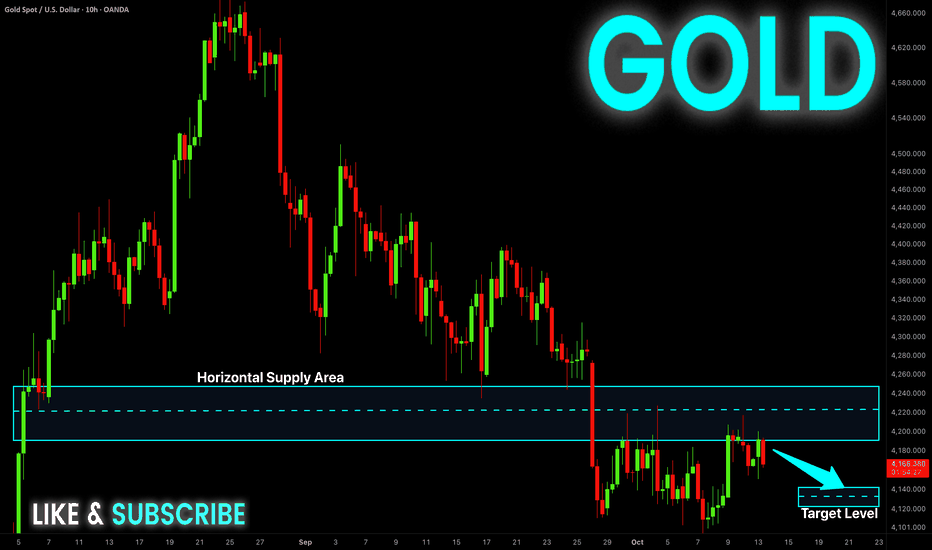
GOLD Pullback Expected! Sell!
Hello,Traders!
XAUUSD is rejecting the lower edge of the horizontal supply area, with sellers capping rebound attempts and a bearish continuation toward 4130.00$ favored if new selling gains momentum. Time Frame 10H.
Sell!
Comment and subscribe to help us grow!
Check out other forecasts below too!
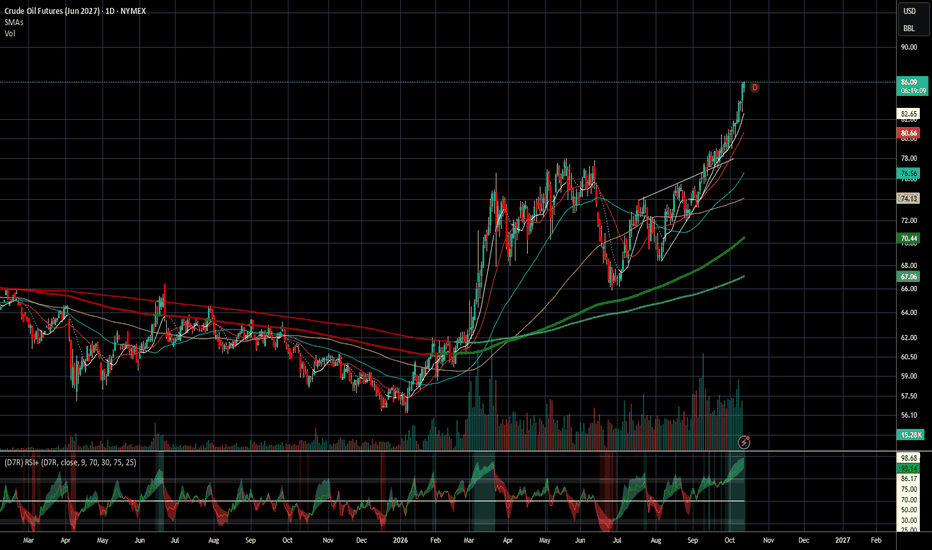
Pay Attention to thisLonger term oil futures are breaking out and continuing higher.
Everyone is focused on cash contracts for today, which haven't made new highs, yet oil futures for next summer and end of 2027 are pushing higher and higher.
July: you can see a rising wedge starting the rally
September: we sat on top of it, building like a pressure cooker
October: we are breaking out and up
Futures markets are essentially saying we are not going back to gas prices under $3 and I haven't heard a single person men
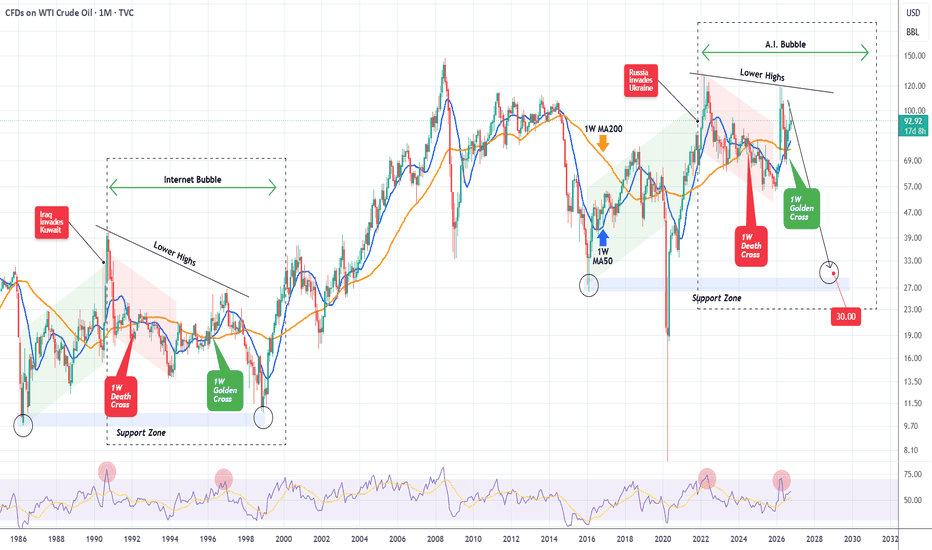
WTI OIL Headed to $30? Similarities with the Internet Bubble.WTI Oil (USOIL) is displaying a fascinating long-term technical formation on the 1M time-frame, one that bears striking similarities to the price action during the Internet Bubble era of the 1990s. As the current A.I. boom continues to dominate global investment sentiment, could Oil be preparing for a similar long-term collapse?
As you can see on the chart, the 1990s cycle started with a massive bullish expansion that peaked in 1990, followed by a prolonged sequence of Lower Highs. Despite seve
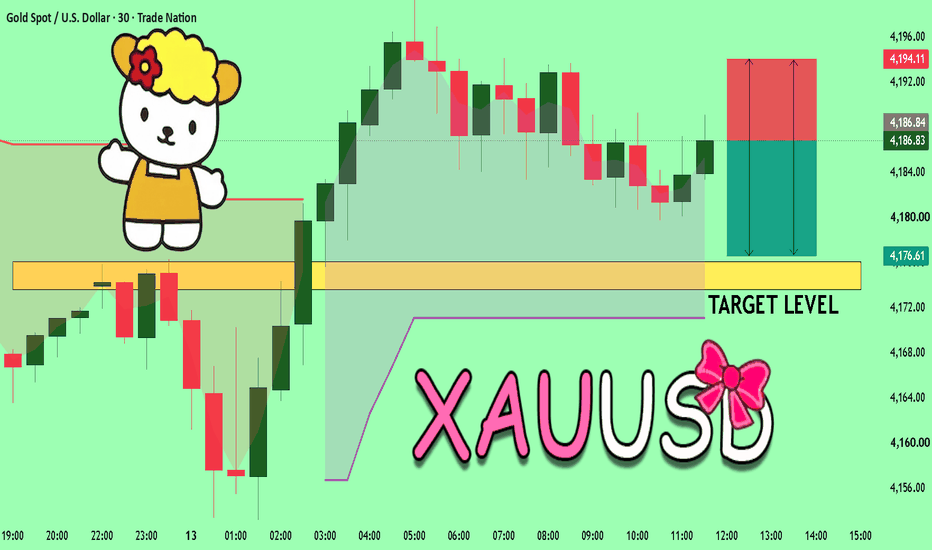
GOLD What Next? SELL!
My dear friends,
GOLD looks like it will make a good move, and here are the details:
The market is trading on 4186.8 pivot level.
Bias - Bearish
Technical Indicators: Supper Trend generates a clear short signal while Pivot Point HL is currently determining the overall Bearish trend of the market.
Goal - 4176.1
Recommended Stop Loss - 4194.1
About Used Indicators:
Pivot points are a great way to identify areas of support and resistance, but they work best when combined with other kinds of
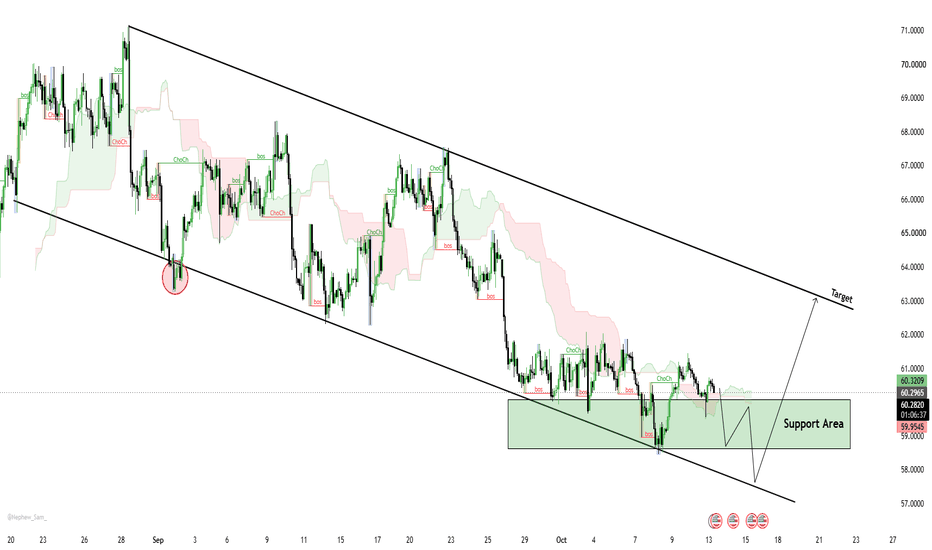
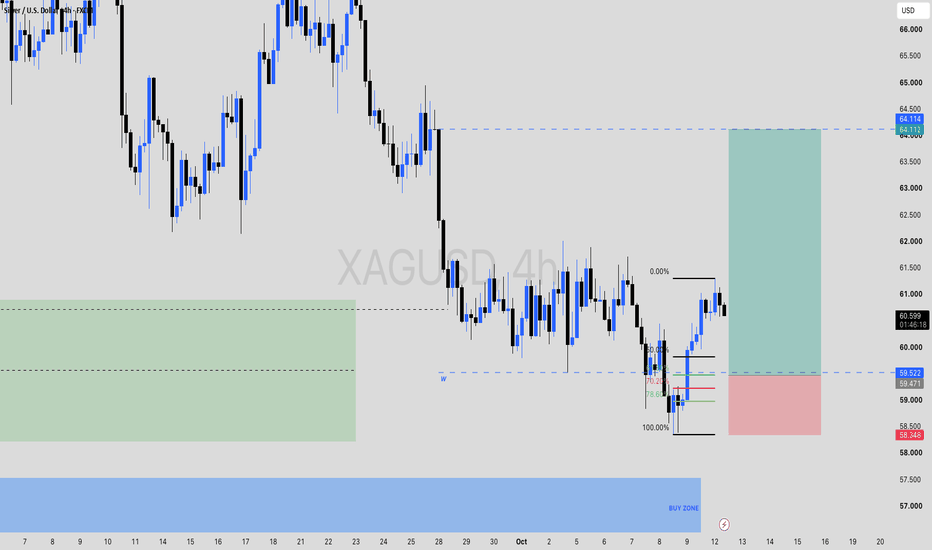
SILVER 2H: Descending Channel Accumulation & Bullish Reversal SILVER 2H: Descending Channel Accumulation & Bullish Reversal Target
SILVER (TVC:SILVER) is trading inside a multi-week descending channel on the 2H timeframe. Price has retested and held the key Support Area (58.5000 - 59.5000) at the bottom boundary of the channel and is currently consolidating near 60.3410, with chart projections pointing toward a bullish expansion up to upper channel resistance.
📈 Upside Map
🎯 Objective 1: 63.0000 - 63.5000 (Target / Channel Resistance)
🎯 Objective 2: 66.000
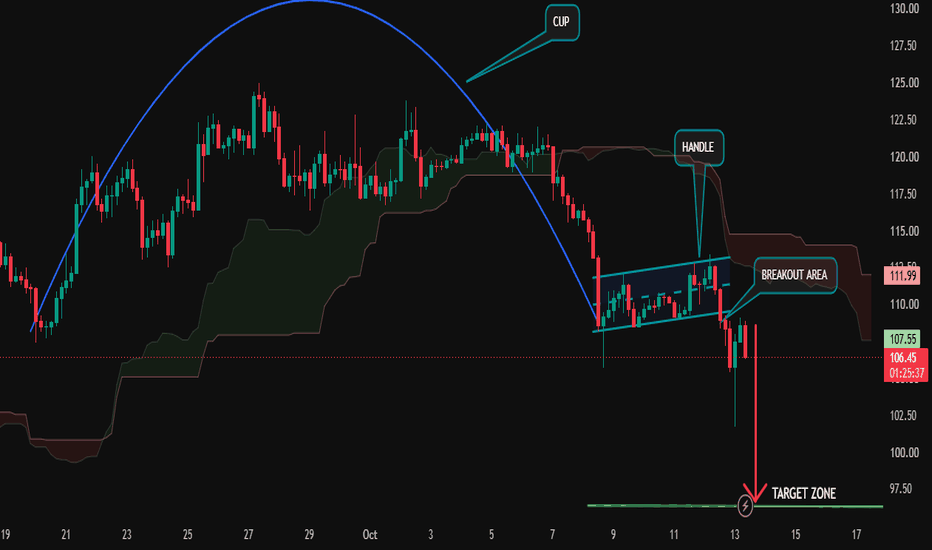
SOLUSDT | SELL SETUP...🔻 SOLUSDT | SELL SETUP
📍 Sell Engagement Area: 108.50–110.00
🎯 Profit Targets
TP1: 104.00
TP2: 100.50
TP3: 97.00
🛡️ Risk Control (SL): 113.00
📊 Technical Analysis:
SOL has broken below the rising channel support around 108–110, indicating a bearish shift in short-term market structure. Price is trading near 106.46, below the marked breakout area, while the overhead cloud suggests continued resistance. If price retests the broken channel and faces rejection, downside momentum could extend
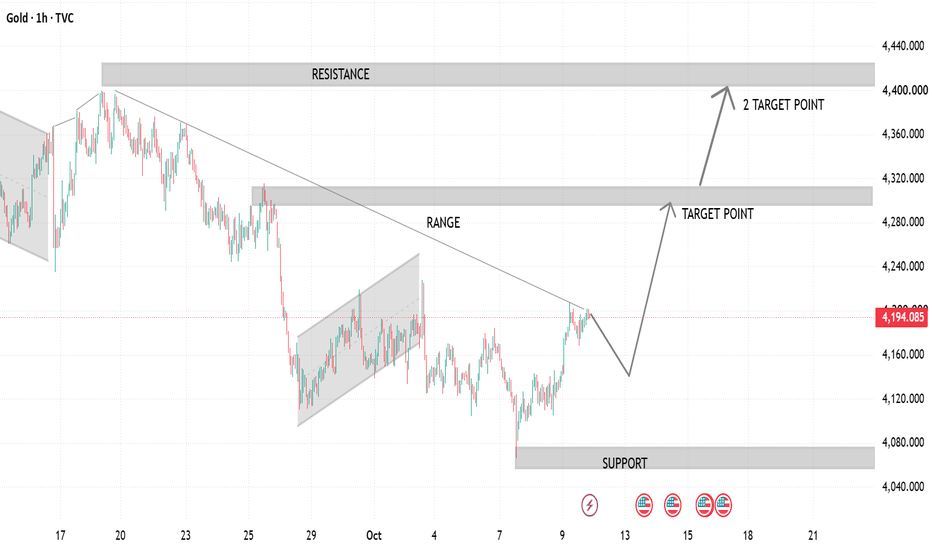
Gold (XAUUSD) Price Prediction & Technical Analysis | Key Suppor
In this Gold (XAUUSD) technical analysis, we examine the current market structure, key support and resistance zones, and potential price movements on the 1-hour chart.
📊 **Key Levels to Watch:**
- **Support Zone:** 4,055–4,075
- **Resistance Zone 1:** 4,295–4,315
- **Resistance Zone 2:** 4,405–4,425
- **Current Price:** Around 4,194
📈 **Potential Price Scenario:** Gold may experience a short-term pullback toward the 4,140–4,160 area before attempting an upward move toward the first resistan
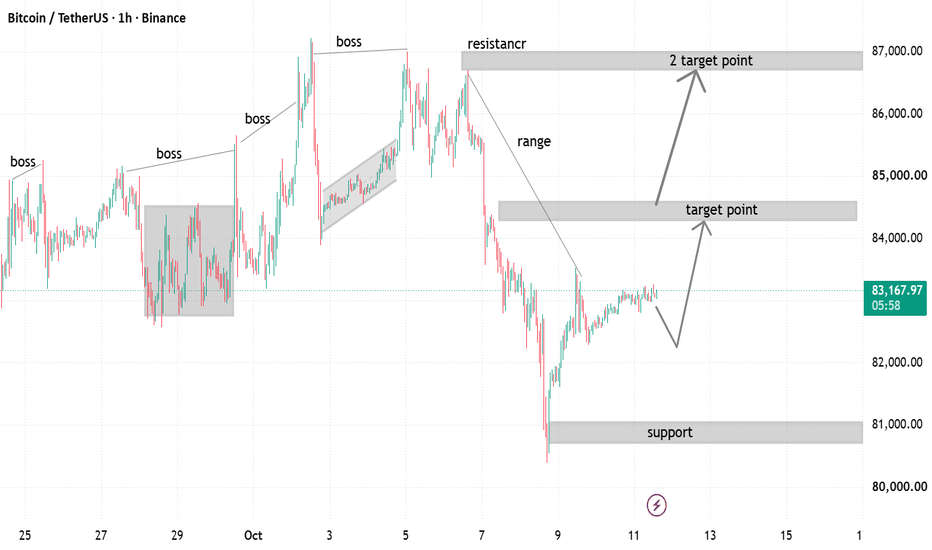
Bitcoin (BTCUSDT) Price Prediction & Technical Analysis | Key SuTitle:
Bitcoin (BTCUSDT) Price Prediction & Technical Analysis | Key Support, Resistance & Bullish Targets
Description:
Writing
📊 **Bitcoin (BTCUSDT) Technical Analysis – 1H Chart**
In this Bitcoin price analysis, we examine the current market structure, key support and resistance zones, and a potential bullish recovery scenario.
🔹 **Current Price:** Around $83,158
📍 **Key Levels to Watch:**
- **Support Zone:** $80,700–$81,000
- **Resistance Zone 1:** $84,200–$84,500
- **Resistance Zone
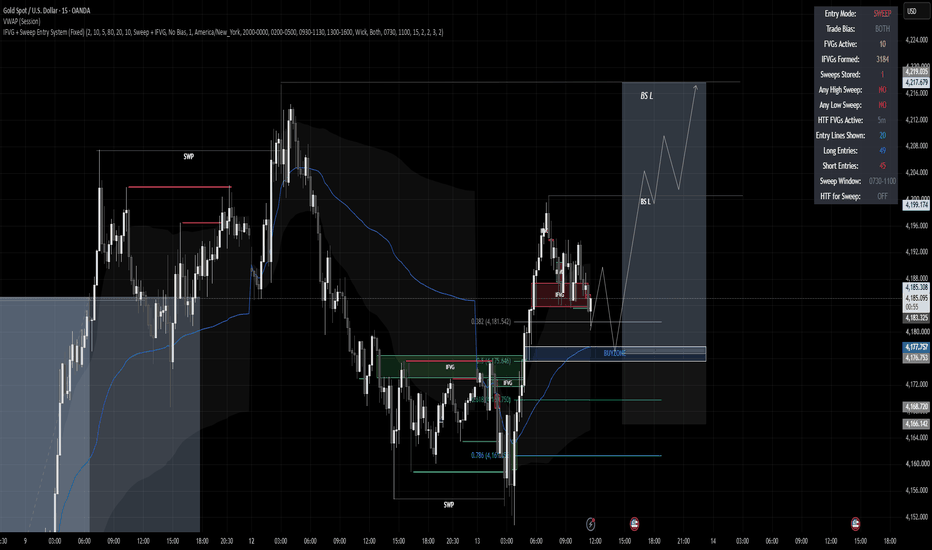
GOLD BULLISH CONTINUATION ?The bullish scenario on Gold remains interesting, especially if the DXY continues its retracement and provides further relief for precious metals. 👀
💧 LIQUIDITY SWEEP & BULLISH REVERSAL
Gold swept the lows around 4,152–4,156 before delivering a strong bullish displacement. This suggests that sell-side liquidity was taken before buyers stepped back in and shifted the short-term market structure.
📊 WHAT I'M WATCHING NOW
✅ Price is consolidating after the bullish impulse toward 4,198–4,200.
✅
Gold — Calm Inside the Range🥇 Gold is still trading inside a broad sideways structure after the sharp sell-off from the previous highs. Buyers have managed to recover from the lower boundary, but price remains below a major resistance zone where a breakout could change the short-term outlook.
The latest recovery is keeping bullish momentum alive, while the market continues to respect the boundaries of the current range.
🏆 Previously:
*We’ve changed our analysis timeframe from 15M to 1H. From now on, all our analyse
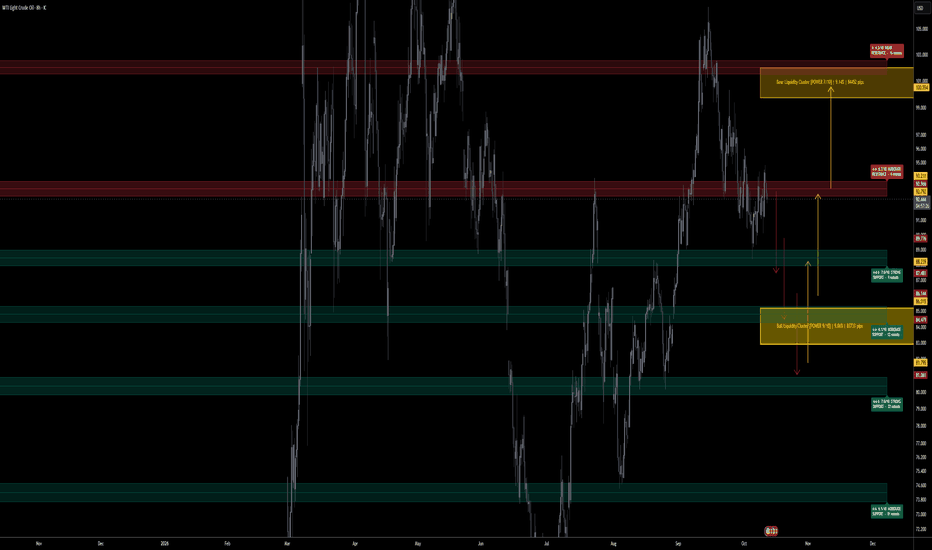
XTIUSD H8 Institutional Liquidity Levels Bulls/Bears▪️ My read: WTI at 92.444, pinned right under the ★★ 6.7/10 MODERATE RESISTANCE at 92.792 to 92.966. Crude has been printing lower highs since the September spike near 107, and every October rally has stalled in this band. I’m leaning lower first, into the ★★★ 7.6/10 STRONG SUPPORT at 88.00 to 88.90, before any real attempt at the upside.
▪️ The heavy bid sits further down. The Bull Liquidity Cluster at 82.00 to 84.80 overlaps the ★★ 6.1/10 support, and that’s where trapped longs get flushed
GOLD BULLS ARE STRONG HERE|LONG
GOLD SIGNAL
Trade Direction: long
Entry Level: 4,159.49
Target Level: 4,182.90
Stop Loss: 4,143.75
RISK PROFILE
Risk level: medium
Suggested risk: 1%
Timeframe: 1h
Disclosure: I am part of Trade Nation's Influencer program and receive a monthly fee for using their TradingView charts in my analysis.
✅LIKE AND COMMENT MY IDEAS✅
WE Gold, Tomorrow CPIHi, I'm Maicol, an Italian trader.
I've been studying Gold since 2019.
My trading approach focuses on swing trading and intraday setups.
I need your support.
Please leave a like and follow my profile.
It may seem like a small gesture, but it makes a big difference to my work.
Make sure to read the full description to understand today's trading plan.
Don't focus only on the chart. Thank you.
🌞 GOOD MORNING EVERYONE 🌞
Yesterday, Gold started moving below our first marked level at 4175 on H4,
XAUUSD | TRADING PLAN H1 13/10/2026✅ XAUUSD/H1
The H1 structure is currently moving sideways within a wide range. The Major Support (4168 - 4175) is the key short-term decision zone. If price holds above this zone, buying momentum may recover and push price toward the Strong Resistance (4215 - 4222). However, if price breaks below the Major Support (4168 - 4175) and an H1 candle closes beneath it, a deeper correction toward (4150 - 4155) and (4118 - 4125) may follow.
🔴 KEY LEVELS
Strong Resistance: (4215 - 4222)
Resistance: (
XAU/USD: Market Analysis and Strategy for October 13Looking ahead at the gold price trend for the next 15 days, the current pullback is primarily driven by short-term macroeconomic factors; the US dollar's resilience acts as a constraint on the upside potential for gold in the medium to long term. However, weak US employment data combined with safe-haven demand stemming from Middle East geopolitical tensions provides a floor for international gold prices. Today, focus should be placed on fluctuations in US Treasury yields and speeches by Federal
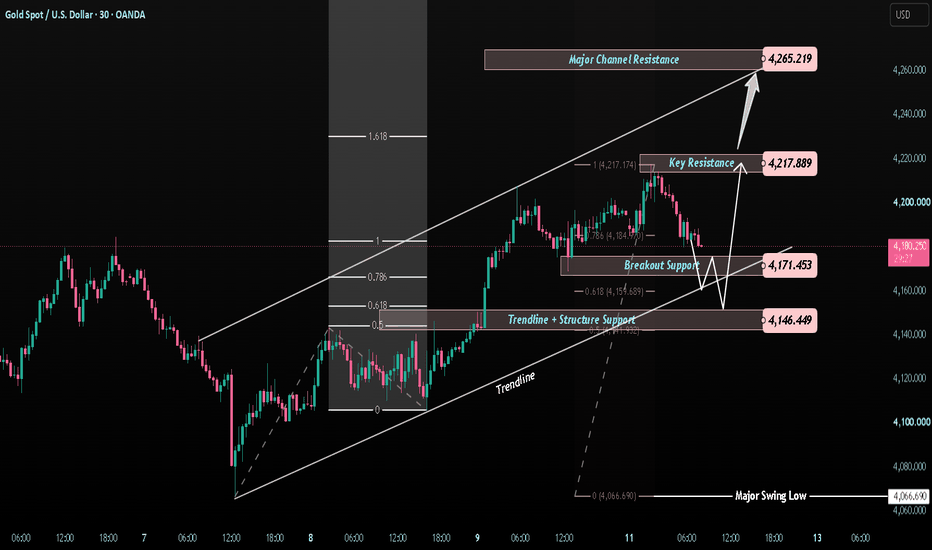
XAUUSD — 4,171 Retest or 4,265 Breakout?
Gold is trading around 4,183 on the M30 chart after a strong recovery. Price is holding above the rising trendline, keeping the short-term structure bullish.
Macro News
Gold is supported by a softer U.S. dollar and lower oil prices as markets prepare for this week’s U.S. inflation data. CPI is due Wednesday, followed by PPI and Retail Sales on Thursday. Markets currently price only about a 17% chance of an October Fed hike, while the U.S. Treasury market is closed today for Columbus Day, which
XAUUSD · H1 · Morning Map · Tuesday 13 OctoberR3 4244
R2 4220
R1 4205
Pivot 4181
S1 4157
S2 4142
S3 4118
Monday's play is done. Overnight, sellers took price down through S1 at 4157, and the play from Monday's pivot reached its target. Pivot to S1, $20, plus a little positive swap for holding it overnight.
Then buyers stepped in at 4151. They took price straight back up, closed the hour above the pivot and pushed on to 4201, just short of R1. Price is now at 4191, pulling back.
The pivot at 4181 is today's decision zone. It was resista
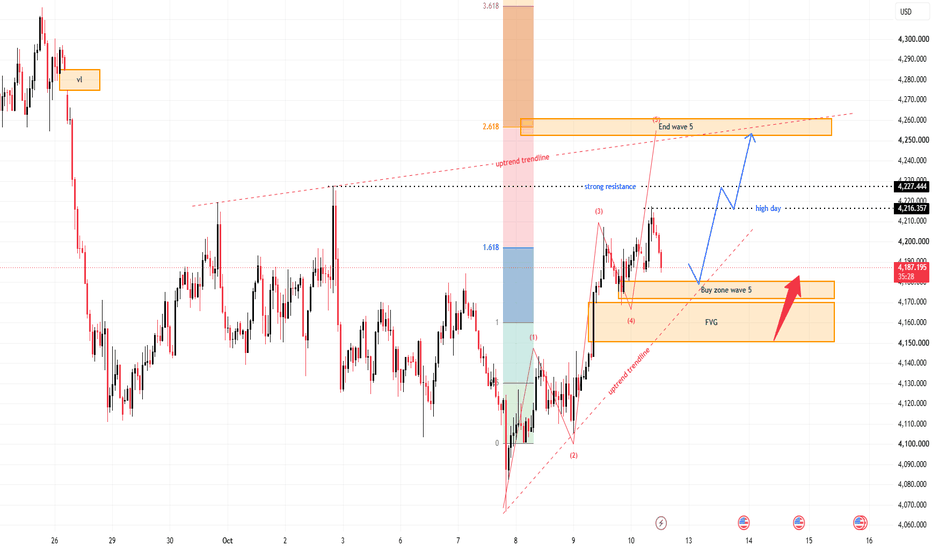
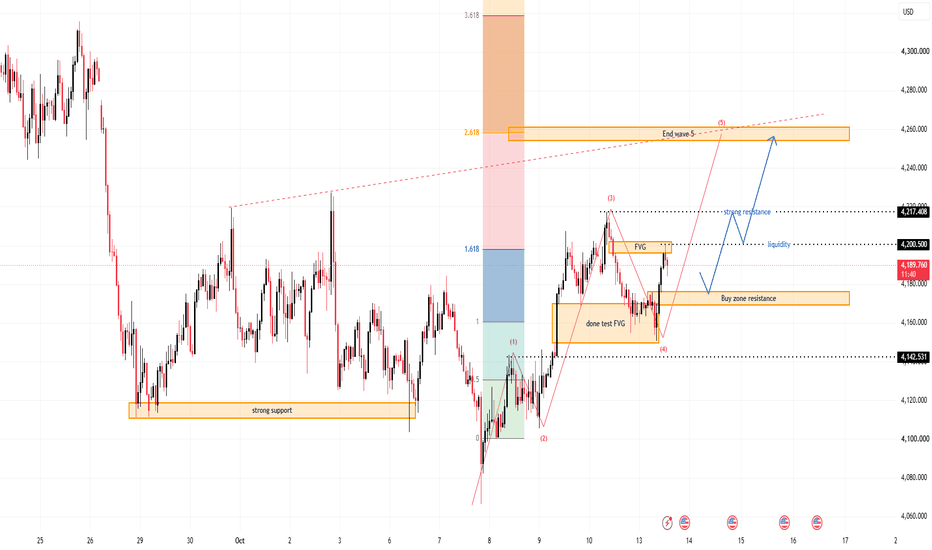
XAUUSD — Bullish Wave 5 Toward 4,260
From Kelly’s view, gold is still holding a constructive bullish structure after the strong recovery from the 4,070–4,100 area. Price is currently trading around 4,187, while the latest pullback is approaching an important Wave (4) retracement and buy zone above the rising trendline.
The key idea is simple: if buyers defend the 4,170–4,180 area, gold may complete Wave (4) and begin the next bullish Wave (5) toward 4,216, 4,227, and eventually the 4,250–4,260 Fibonacci target zone.
⟡ Market str
Gold is now in a potential sell zone.Selling here is still risky since the daily structure is bullish and there's liquidity resting above (BC, ST), but it's worth keeping the setup in mind. If I do take shorts, it'll be with half my usual risk. As for longs, the setups are only internal structure for now, so I'm staying patient.
XAUUSD — Bullish Wave 5 Toward 4,260
From Kelly’s view, gold is still holding a constructive bullish structure after completing a deeper Wave (4) pullback into the 4,150–4,170 support area. Price is currently trading around 4,187, while buyers are attempting to rebuild momentum above the recent retracement zone.
The key idea is simple: if buyers continue to defend the 4,165–4,175 buy zone, gold may resume the bullish sequence toward 4,200, 4,217, and eventually the projected 4,250–4,260 Wave (5) target.
⟡ Market structure
Gold