Cypher
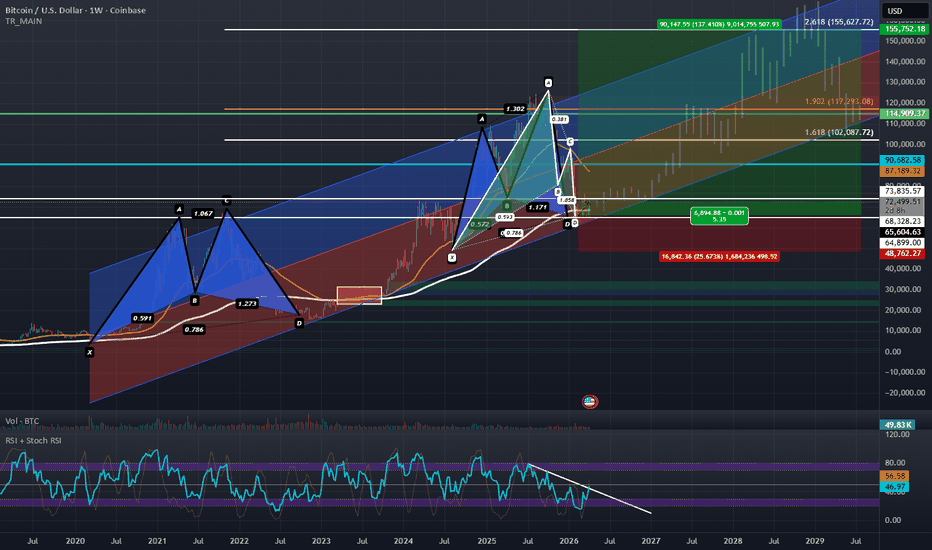
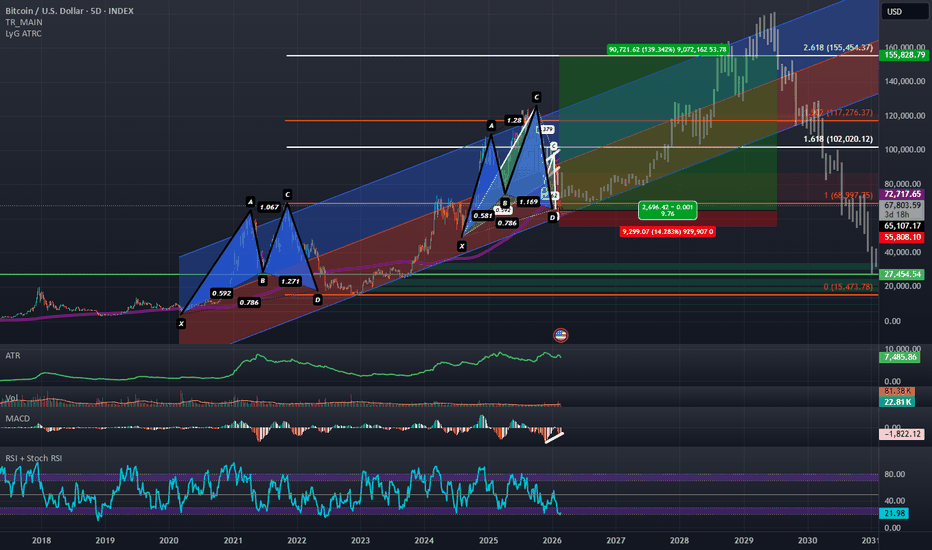
BTCUSD: Bullish Gartley Support Confirmed Targeting $155,627.72This is a follow-up to the previous bullish entry idea from 2 months ago at the bottom of the channel.
Over the last several weeks BTC has been putting in a bottom at the bottom of this channel both in terms of putting in a Double Bottom on the weekly timeframe and confirming a Bullish Inverted Hammer on last month's Monthly Close; in this time BTC has been taking back the 200-week moving average and given that BTC rarely stays below the 200-week Moving Average for long it is statistically likely that BTC begins a new bull cycle from here. We've also seen a significant rise in Demand Deposits and Physical Currency in Circulation which is likely to lead to this new money chasing fixed supply assets which is a category BTC fits perfectly into.
This macro bottom aligns with the combined PCZ of a Bullish Cypher and Bullish Gartley and seems to be setting up to repeat the end of the 2021-2022 Cycle Top to Bottom Fractal and is trading above the previous Cycle Highs. If this Cycle ends like it did in 2022 we should begin a new uptrend that can take BTC all the way up to the 2.618 Fibonacci Extension at the top of the Linear Regression Channel which aligns wit the $155,672.72 area.
It would seem that Bitcoin is trading around the previous Cycle High Horizontal Support/Resistance Zone. BTC has been holding above the lower end of the zone at $64,899.00 and has been finding resistance at upper end of the zone at $73,835.57, BTC is yet to break above the upper end of this zone but if it does BTC will likely be able to begin it's next major move to the LOBF (the middle line of the channel) where it might then find resistance but if it manages to push above that level too it could later rise to the 2.618 and perhaps even the 3.168-3.618 Extensions before pulling back.
The RSI has also begun to break free from it's downtrend and lastly the USDT.D has been showing some signs of potential weakness as explained here:
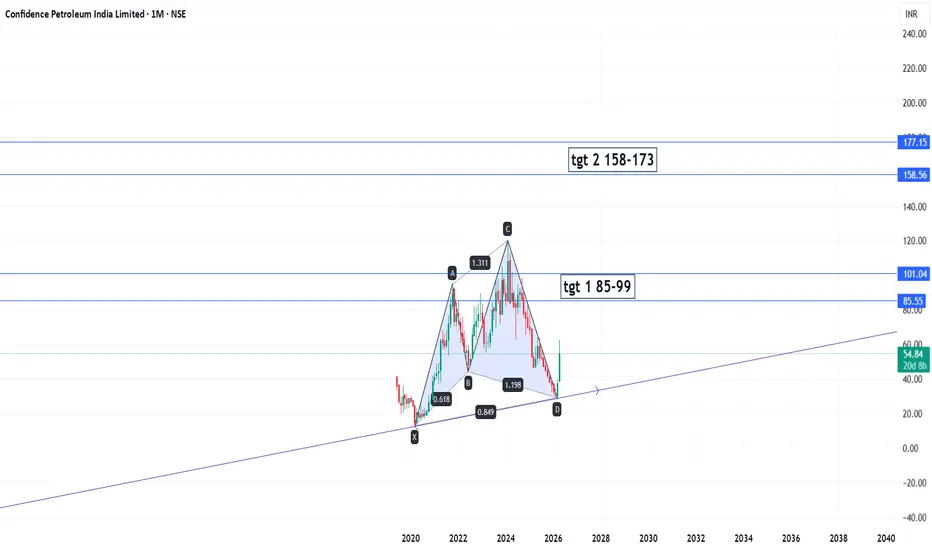
Cypher pattern in makingSetup
The Cypher pattern is a 4-leg reversal pattern that relies on specific Fibonacci ratios.
Here is how this specific setup validates:
B Point: Must be a retracement of the XA leg, typically between 0.382 and 0.618.
Here, it sits perfectly at the 0.618 level.C Point:
This is a "beyond" extension of the XA leg, reaching at least 1.272. On this chart, it pushed to 1.311, creating a higher high and trapping early shorters.
D Point (The Entry): The completion point occurs at the 0.786 retracement of the XC move. As we can see, price has touched the 0.849 (relative to the whole move) and is finding support on the multi-year trendline.
🎯 Key Levels to Watch
The chart identifies two clear supply zones where liquidity is expected to sit:
Target 1 (85–99): This aligns with the previous structural resistance and the 0.618$
Fibonacci retracement of the CD leg.
Target 2 (158–173): A long-term target that aims for a retest and breakout of the previous "C" point highs.
💡 Trading WisdomHarmonic patterns are high-probability setups, but they aren't magic.
Confirmation is King: Look for a bullish candle close on the weekly or monthly timeframe to confirm the "D" point reversal.
Risk Management: A stop-loss should typically be placed just below the X point. If price breaks the origin of the pattern, the harmonic structure is invalidated.
Confluence: The fact that the "D" point coincides with the purple ascending trendline adds a significant layer of technical weight to this trade.
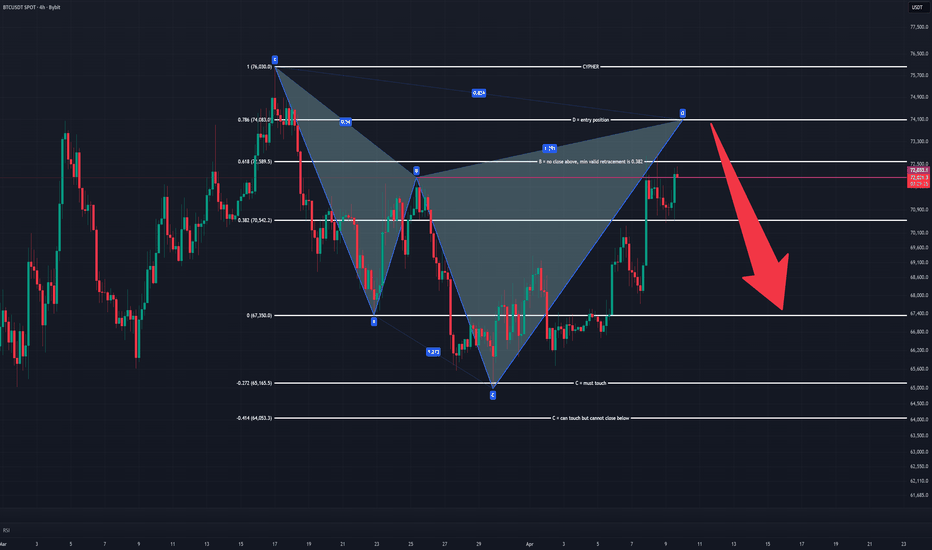
BTCUSDT 4H Bearish Cypher: PRZ Hit, Reversal Toward 67k?BTCUSDT 4H — Bearish Cypher nearing completion, watch for rejection from PRZ
BTC is trading into a very clean bearish Cypher structure on the 4H chart, with price now pressing into the potential reversal zone (PRZ) around 72.8k–73.8k .
The structure is technically interesting because:
X-A defines the initial impulsive leg
B respects the retracement conditions and has not closed above the invalidation area
C swept deep enough into the lower support zone and stayed within acceptable limits
Price is now approaching D , the key completion area of the pattern
At the moment, BTC is trading just under resistance while the market is testing the upper boundary of the purple supply zone. As long as price remains below the 73.8k region , this area can act as a short-term exhaustion zone.
Bearish thesis
If BTC rejects from the current PRZ, the first meaningful downside target sits around 67.3k (point A / major horizontal support). A deeper move could extend toward the 65.1k zone , which aligns with the lower liquidity/support region marked on the chart.
Key levels
PRZ / reaction zone: 72.8k–73.8k
Invalidation: sustained breakout and acceptance above 73.8k
Major invalidation / structural risk: 76k
Target 1 : 67.3k
Target 2: 65.1k
What I want to see
I would prefer confirmation in the form of:
rejection wicks into resistance,
weakening momentum on lower timeframes,
or a bearish close back below the purple zone.
Until that happens, this remains a setup zone, not a confirmed reversal.
This chart suggests BTC is at a decision point: either reject from the Cypher completion area and rotate lower, or invalidate the pattern with strength above resistance.
Not financial advice. Manage risk and wait for confirmation.
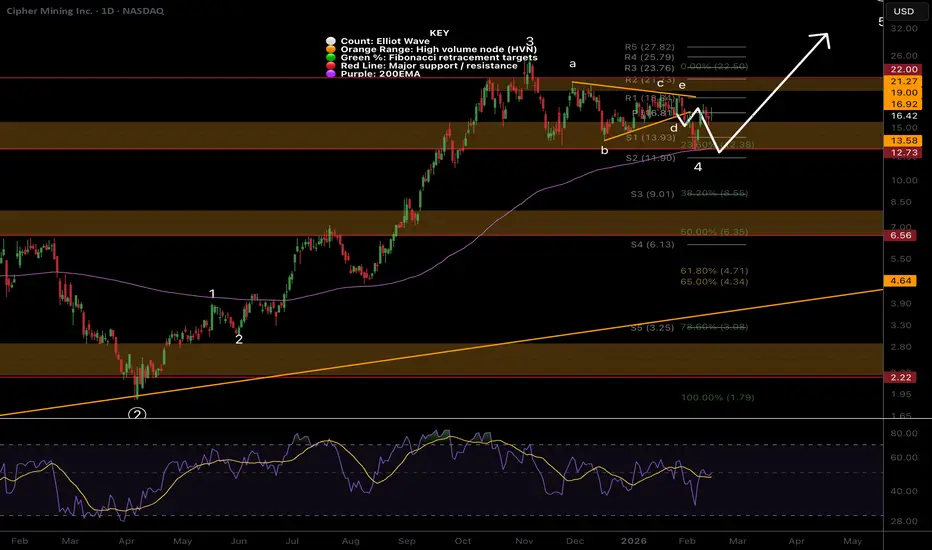
CIPHER Macro analysis | The bigger picture | Long-term holdersNASDAQ:CIFR remains in a wave 4, below the all-time high. Wave 4s are characterised by their drawn-out, shallow, volatile ranges, well known as the place where traders give their gains back to the market through impatience and false signals. Wave 4s usually end at the 0.382 Fib, $8.52, but can extend as far as the 0.5, aligning with the weekly 200EMA and HVN, so this is a high confluence area. Price is currently testing the weekly pivot as support and the upper trend-line of the previous trend. Wave 5 has a minimum target of $37, at the R2 weekly pivot.
📈 Weekly RSI is trending down from overbought, bears are taking over, plenty of room to fall
👉 Analysis is invalidated if price falls below the 0.5 Fibonacci retracement at $6.35 or gets above $15.80
USDCAD SELL 1.4000On the daily chart, USD/CAD has stabilized and is trending upwards, with a short-term bullish bias. The current resistance level to watch is around 1.4000. This level represents a potential shorting opportunity based on a bearish cypher pattern; consider shorting once this level is reached.
Bullish 2021 Bitcoin Fractal Suggests Bitcoin has BottomedBitcoin is sitting at the PCZ of a what can be plotted as both a Bullish Cypher and a Bullish gartley and on the 5D timeframe it is below the 200 Period SMA which it usually doesn't stay below for long; and is also sitting a the 1.618 Standard Deviation demand line of a Linear regression Channel while exhibiting Bullish Divergence on the MACD and starting to show a second recovery from oversold zones in the RSI after what was a sharp secondary decline into oversold zones and lastly on the price decline, the ATR spiked up but has since started to return back to where it came from which signals the downside volatility might be waning here.
All of this suggests to me that on a technical level Bitcoin has indeed bottomed and if we are to complete the same harmonic fractal as we did leading to and during the completion of out last Bullish Cypher in 2020-2022, our next target would align with the 2.618 Fibonacci Extension which happens to be around the top of the channel BTC has developed over the years and would also bring BTC back on track to keeping up with the SPX which has already reached its 2.618 extension and may be headed for the 3.168 extension next as seen in this fractal of the SPX here:
The other week I closed my shorts on BTC and started to position for a deadcat-bounce with a target around 106k but upon looking back at some older charts and targets and seeing the Japanese Inflation numbers read below 2%, I came to the conclusion that BTC might be enabled to rise and complete its fractal fully which would take it to the 2.618 extension and given all the confluence at both the current entry and potential future exit I think it will probably be a good idea to raise the full profit taking target to $155.4k
Once BTC catches up with the SPX in terms of extensions and fractal completions; this may then lead to the ultimate decline in both Bitcoin and the S&P-500, but that bearish angle is just me thinking further ahead. For now and for the time being I will be focused on the Bullish higher Bullish targets.
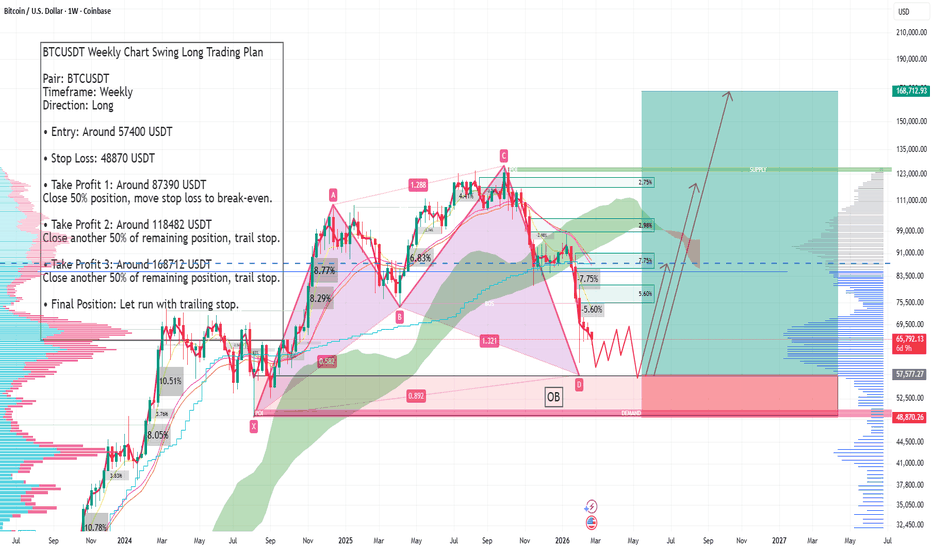
BTCUSDT Weekly Chart Swing Long Trading Plan BTCUSDT Weekly Chart Swing Long Trading Plan
Pair: BTCUSDT
Timeframe: Weekly
Direction: Long
• Entry: Around 57400 USDT
• Stop Loss: 48870 USDT
• Take Profit 1: Around 87390 USDT
Close 50% position, move stop loss to break-even.
• Take Profit 2: Around 118482 USDT
Close another 50% of remaining position, trail stop.
• Take Profit 3: Around 168712 USDT
Close another 50% of remaining position, trail stop.
• Final Position: Let run with trailing stop.
CIFR, triangle finished, , whats next?NASDAQ:CIFR
🎯 The bearish triangle from the last report played out. “ This is a penultimate pattern, we can expect price to thrust lower, test the daily 200EMA, end the correction, then makes its way to new highs.” So far so good.
📈 Daily RSI is back to neutral at the EQ
👉 Analysis is invalidated if price falls below wave 4, suggesting we have a complex correction lower
Safe trading
CIFR Triangle path played out nicely..NASDAQ:CIFR triangle in wave B played out, following my path closely, touching the daily 200EMA and major High Volume Node support line, at the 0.236 Fibonacci retracement. This is a highly probable place for wave 4 to end.
Triangle are a penultimate pattern, so that thrust lower last week should mark the end of the downtrend.
There is no divergence in the daily RSi and has a little room left to hit oversold but can do so on a bullish divergence without a new low.
Price closed Fridays candle at the highs +16% showing consumer confidence to hold over the weekend news cycle.
Safe trading
An At Market & Future Trading Opportunity on GOLDWhat’s Really Going On With Gold?
Gold took a sharp hit to close out last week—but let’s keep things in perspective. This market has been on a massive bullish run, and after a move like that, consolidation isn’t a surprise… it’s normal.
Barring any unexpected geopolitical headlines, the most logical next phase for gold is a pause. And pauses are where some of the best advanced pattern opportunities tend to show up.
A Potential Setup Forming
Dropping down to the 4-hour chart makes things clearer & immediately puts a bat pattern on the radar.
Something Already in Play
If you’re looking for a setup right now, gold has already completed a bearish cypher pattern near the end of last week. Price is currently trading inside the cypher completion zone, which helps explain the recent hesitation and chop.
If you have any questions, comments or want to share your ideas, please do so below!
I wish you guys a great trading week ahead!
Akil
BTC BULLISH CYPHERStructure of the Cypher Pattern
A valid bullish Cypher follows this sequence:
X → A: Strong impulsive rally
A → B: Deep retracement (typically 0.382–0.618 of XA)
B → C: Expansion beyond point X (usually 1.272–1.414 XA)
C → D: Final retracement to 0.786 of XC, where reversal is expected
Your chart aligns perfectly with this geometry.
Key Fibonacci Validation on the Chart
From the visual levels shown:
0.382 retracement: ~96,788
0.5 retracement: ~87,673
0.618 retracement: ~78,558
0.786 retracement (Cypher completion): ~63,000–65,000
0.886 extension: ~57,856 (failure threshold)
Price has rotated directly into the 0.786 XC retracement, confirming the Cypher’s Potential Reversal Zone (PRZ).
Buy Zone (PRZ – Accumulation Area)
Highlighted on the chart as “BUY ZONE”
📍 Buy Zone Range:
$63,000 – $66,000
Why this zone matters:
Aligns with 0.786 XC retracement
Sits above the 0.886 invalidation
Converges with prior structural support
Marks emotional capitulation after the C-leg blow-off
This is not a single-price entry—it’s a zone for scaling in, ideal for staggered buys or confirmation-based entries on lower timeframes.
Risk Management (Invalidation Level)
❌ Pattern Failure Below:
~$57,800
A decisive weekly close below the 0.886 level invalidates the Cypher and signals structural weakness. Any bullish thesis should be abandoned below this level.
Exit Zones (Profit Targets)
Your chart clearly plots measured harmonic expansions as upside objectives. These align with classic Cypher take-profit logic.
🎯 Target 1 – Conservative Exit
$86,800
Prior range midpoint
0.5 Fibonacci retracement of the larger move
Ideal for partial profit or breakeven adjustment
🎯 Target 2 – Primary Expansion
$103,600
Structural resistance
Common harmonic reaction level
Strong zone for trimming or trailing stops
🎯 Target 3 – Full Pattern Resolution
$124,000 – $126,000
Completion of projected harmonic expansion
Previous cycle high region
Optimal area for full exit or long-term distribution
Summary Table
Zone Price Area
Buy Zone (PRZ) $63K – $66K
Invalidation ~$57.8K
Target 1 ~$86.8K
Target 2 ~$103.6K
Target 3 ~$124K–$126K
Final Thoughts
This Cypher is structurally clean, well-proportioned, and forming on a weekly timeframe, which significantly increases its reliability. The market has already done what Cyphers demand—exhaust momentum beyond reason—and is now retracing into a mathematically defined accumulation zone.
If this pattern holds, the current region represents asymmetric risk, where downside is clearly defined and upside remains substantial.
CIFR triangle in wave B has completed, per previousNASDAQ:CIFR has completed the triangle in wave B of 4 with thrust down in wave C, characteristic behaviour of wave Cs.
Triangle are patterns found before a terminal move suggesting we are nearing a bottom at the daily 200EMA, 0.236 Fibonacci retracement.
Safe trading
AUDUSD: A Rare “Stop & Reverse” Trading OpportunityToday, we’re taking a look at the AUDUSD, and this is one of those charts that really makes technical traders smile—because we’ve got two patterns forming at the same time that actually complement each other, rather than conflict.
On one hand, we have a potential head and shoulders top, which points toward a bearish trading opportunity if price confirms the pattern. On the other hand, we also have a potential bullish Cypher pattern, which would offer a buying opportunity if it completes as expected.
At first glance, this might sound confusing. How can a market present both a bullish and bearish setup at the same time?
Why This Setup Is So Unique
The key detail here is location. The completion point of the Cypher pattern lines up almost perfectly with the level where I’d be looking to take profits on the head and shoulders trade. In other words: If the head and shoulders plays out, that downside target becomes the exact area where the bullish Cypher would be completing. This creates a rare and powerful situation where a trader can potentially use a “Stop & Reverse” approach: Trade the head and shoulders to the downside, take profits at the Cypher completion zone, then, flip the position and trade the move back to the upside
Rather than choosing between bullish or bearish bias, the market gives us a structured plan for both scenarios, all based on price action and pattern completion.
The Big Takeaway
This is a great example of why technical analysis isn’t about predicting the market—it’s about preparing for multiple outcomes. When patterns align like this instead of asking “Which direction will price go?”, we can focus on “What will I do when price gets here?”
If you have any questions, comments, or want to share your own opinion on the AUDUSD, feel free to leave them below.
And as always, I’d really appreciate it if you hit that like button before you go.
Akil
BTC — Cypher Pattern, Fading Momentum & What Comes NextAfter the –36% drop from ATH, Bitcoin has found support in the 80K–90K range, where price has now been chopping sideways for almost 60 days. This kind of consolidation is pretty typical after a sharp selloff.
Back in June 2025, I already mentioned that a potential Cypher harmonic could be forming on BTC. At the time it was still early, but months later the structure is lining up very cleanly and looks like it’s playing out step by step.
The 86K–82K zone remains a key support area that bulls need to defend. Losing this zone would be a big deal technically and would likely open the door for further downside.
Macro Context
Cypher patterns are powerful because they combine:
impulse exhaustion
failed continuation
deep retracement psychology
They tend to appear near major cycle inflection points, especially after extended bullish phases and distribution-style highs. This makes them particularly relevant in the current market environment.
Let’s break the structure down step by step.
Cypher Structure Breakdown (X–A–B–C–D)
BTC has respected the key Fibonacci relationships of a Cypher extremely well.
X → A: Impulse Move
This was a strong, clean impulsive leg showing clear bullish dominance and participation.
Psychology:
Late bears trapped, early longs confident
A → B: Pullback
Price retraced to 0.579, sitting nicely within the Cypher sweet spot (0.382–0.618).
Structure held, which is crucial.
Psychology:
Doubt kicks in → “Is the move over?” → weak hands get shaken out.
B → C: Expansion & Euphoria
BTC pushed to the 1.274 extension of XA, clearly exceeding point A.
This is where optimism peaked and momentum chasing kicked in.
Psychology:
FOMO → breakout buying → late-cycle confidence
C → D: Reversal Zone
This is the most important part of the structure.
0.786 retracement of XC
Completion zone around 65.5K
Strong overlap with:
2021 ATH
2024 trading range
Psychology:
Euphoria → disbelief → forced selling → acceptance.
Where We Are Now
Bitcoin is currently trading between C and D, meaning:
we’re in a corrective phase
volatility has faded
and for the first time in four years, we’re seeing a clear bearish bias after a long period of bullish momentum
100K psychological level remains the major overhead barrier. As long as price stays below this level, bulls are on the defensive.
Macro Check
The broader technical picture remains cautious:
Below previous yearly open (93.5K)
Above yearly open (87.6K)
Below weekly 21 EMA/SMA (98K-102K)
Above monthly 21 EMA/SMA (87K–89K)
Structurally, this looks very similar to previous cycle transitions where momentum slowly faded before deeper moves followed.
Scenarios Going Forward
🔴 Primary Scenario
If the Cypher continues to play out:
downside pressure persists
volatility expands near liquidity pockets
target zone sits around:
66K–64K, centered near the 0.786 Fib (~65.5K)
This would be a healthy macro correction.
🟢 Invalidation Scenario
The bearish structure weakens if:
BTC reclaims and holds above prior value
price shows acceptance above 100K
momentum flips bullish again
In that case, the Cypher either gets delayed or invalidated.
Final Thoughts
Right now, the data favors patience and caution.
The most ideal path would be:
a push into the 97K–100K resistance zone
followed by continuation lower toward the 74.5K year low, which I’d like to see taken out
In choppy conditions like this, no trade is still a trade. Staying flat, preserving capital, and waiting for clarity is often the smartest move. Plan your levels, set alerts, and only act when the market gives you a high-probability setup.
_________________________________
💬 If you found this helpful, drop a like and comment!
CIFR Macro analysis | The bigger picture | Long-term holdersNASDAQ:CIFR
🎯 CIFR remains in a wave (4) of 3 range, near the all-time high. Wave 4s are expected to be drawn out, often being a triangle or flat correction, where most traders give their money back to the market due to whipsaw and fakeouts.
📈 Weekly RSI has printed bullish divergence above the EQ, but with no strong reaction yet. This can take months to play out sometimes. Falling below the orange trend line will negate this divergence.
👉 Analysis is invalidated if price falls below the 0.5 Fibonacci retracement at $6.35
Safe trading
CIFR Short-term analysis | Trading and expectationsNASDAQ:CIFR
🎯 Wave d of the triangle may still be underway, wave e is expected to end at the daily pivot where price currently sits, above the daily 200EMA, showing the uptrend is still intact but flattening.
📈 Daily RSI bullish divergence has failed to play out, showing the bears are in control.
👉 Analysis is invalidated if price falls below wave C, $12.50, suggesting a deeper retracement
Safe trading
Newmont Corporation (NEM) – Short Setup Technical AnalysisNewmont Corporation (NEM) – Short Setup Technical Analysis
NEM is currently trading well above the 3rd Anchored VWAP band, reflecting a significant price–value dislocation and elevated mean-reversion risk. At this level of deviation, upside continuation typically becomes inefficient and increasingly dependent on late participation.
This overextension coincides with the formation of a bearish Cypher harmonic pattern, which often develops near exhaustion points within extended moves. The Cypher completion zone defines a technically sensitive area where bullish momentum frequently deteriorates and distribution risk increases.
From a tactical perspective, this setup favors a mean-reversion short rather than trend continuation. A rejection from the current level or loss of acceptance above the upper VWAP band would confirm bearish control and increase the probability of a rotation back toward the Anchored VWAP and prior value area.
Bias: Short on rejection above the 3rd VWAP band
Target: Mean reversion toward Anchored VWAP
Invalidation: Sustained acceptance above the Cypher completion zone
Context: Bearish Cypher completion + extreme VWAP deviation = asymmetric short opportunity