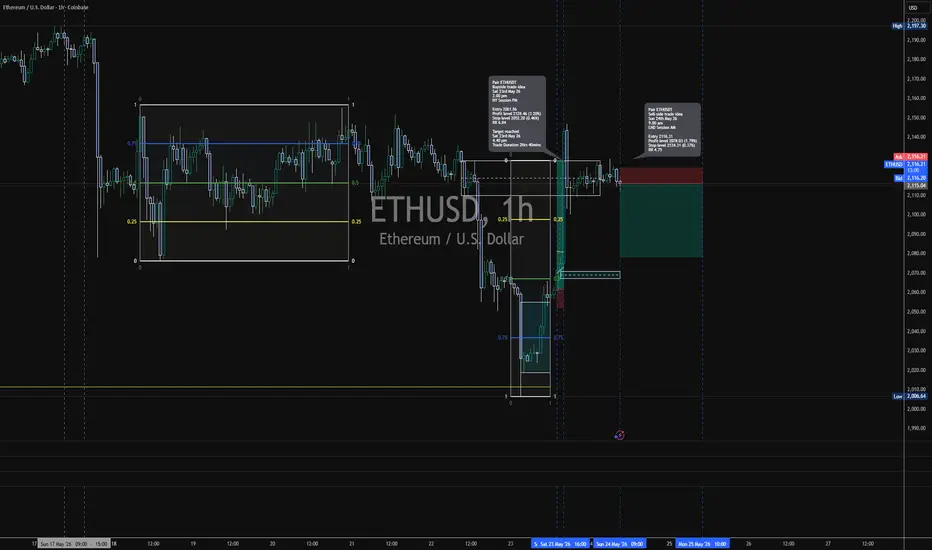
Short
Short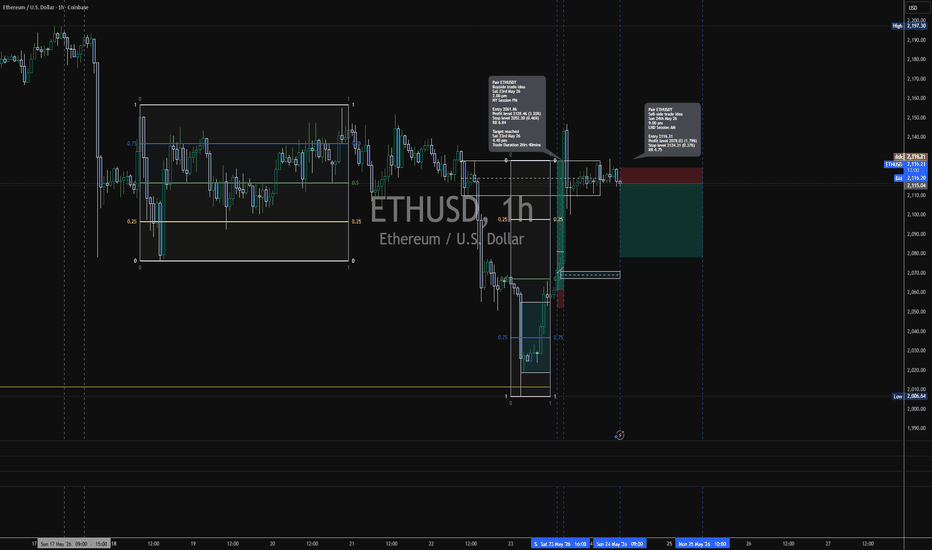
GOLD Weekly Analysis | 24 May 2026XAUUSD Analysis | 4h Chart
Follow price OANDA:XAUUSD
❇️ Analysis Description: Gold is facing a major structural decision. The overall bias remains cautious, but a shift in market structure depends on how price reacts to the current downtrend line and key horizontal levels. Volume and momentum will dictate the next major trend.
🔄 Trend & Market Scenarios:
Bullish Confirmation (Breakout): If the price gains enough bullish momentum to break above the major downtrend line and the 4,560.60 resistance area, we expect a shift in market structure. Buyers will likely take control after a valid pullback to this flipped support area.
Bearish Continuation (Breakdown): If the sellers defend the trendline and push the price below the 4,455.60 support zone, the bearish momentum will intensify, opening the path for deeper corrective waves.
🎯 Key Structural Targets
🟩 Upside Targets (On Successful Break & Pullback): 4,663.40 (T1) | 4,767.60 (T2) | 4,871.10 (T3)
🟥 Downside Target (On Support Breakdown): 4,350.52 (T1)
⚠️ Note on Targets: As price reaches the first structural target, partial profit-taking (Save Profit) or trailing stops (Risk-Free) is highly recommended to protect capital against sudden market reversals.
💬 What is your view on Gold this week? Let me know in the comments!
💡 Quick Note: I drop daily Gold & Bitcoin signals on lower timeframes right here throughout the week! Make sure to follow my page so you don't miss out on these daily setups. 📲✨ BTC Weekly Analysis | 24 May 2026BTCUSDT Market Outlook | 4H Chart
Follow price BINANCE:BTCUSDT
❇️ Market Analysis & Scenarios:
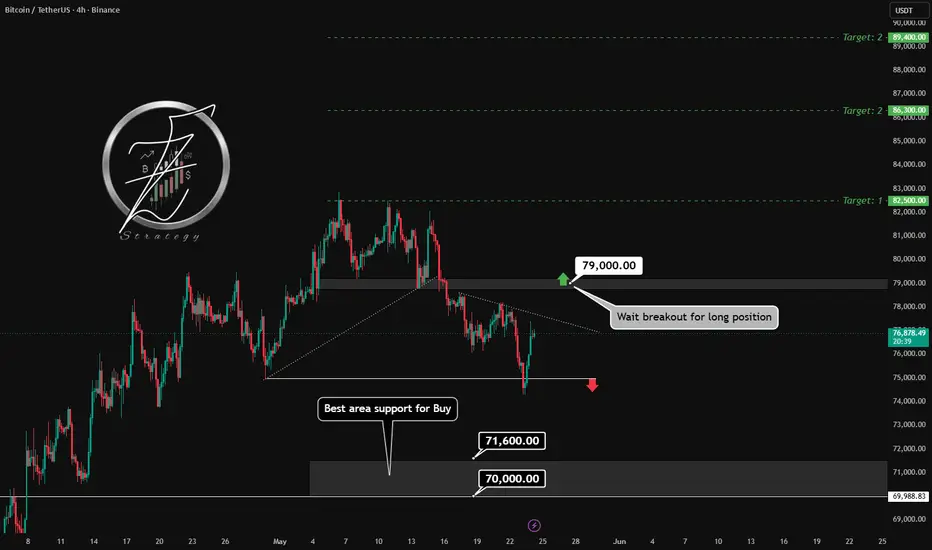
Bitcoin is currently testing its dynamic trendline resistance on the 4H timeframe. The overall structure remains under key decision points for the upcoming week, presenting two major technical scenarios:
🔼 Bullish Scenario (Breakout):
For a sustained upward movement towards the higher liquidity pools at 82,500 , 86,300 , and potentially 89,400 , BTC needs to clear and firmly close a 4H candle above the horizontal resistance at 79,000 . A successful breakout and pullback confirmation above this level will switch the short-term momentum completely to the bulls.
🔽 Bearish Scenario (Correction):
If the price fails to break above 79,000 and drops below the local pivot at 74,500 , we can expect a deeper corrective wave. In this case, the most high-probability accumulation and major support zone sits between 70,000 - 71,600 , where buyers are highly likely to defend the macro bullish structure.
💬 What is your bias for this week? Let me know in the comments!  Long
Long
 Long
Long
 Short
Short
Why Markets Move Sideways Most of the Time✌️ Sup Traders!
A sideways market is not dead price action. It is the market taking a breather after a strong move. In crypto, this often shows up as crypto consolidation, where buyers and sellers fight inside a tight zone without a clear winner.
That is one reason why markets move sideways: price needs time to absorb liquidity, reset momentum, and build the next structure.
📦 Range Bound Market: The Chop Zone
A range bound market happens when price keeps moving between support and resistance. Bulls buy the lows, bears sell the highs, and the chart starts crab-walking.
This type of sideways price action can look boring, but it tells a lot about crypto market behavior. The market is testing levels, trapping late entries, and building liquidity on both sides.
₿itcoin Sideways Movement
A bitcoin sideways movement often slows down the whole crypto market. When BTC is stuck in a range, altcoins usually follow the same mood: fake pumps, sudden wicks, and plenty of chop.
This is typical market consolidation crypto behavior. The chart may look quiet, but under the hood, positions are being built and flushed.
⚔️ Trend vs Range Market
The key difference in a trend vs range market is direction. A trend has clean momentum. A range has rotation.
In a ranging market crypto setup, price often moves from one side of the range to the other. Some traders may view price range trading as an option, focusing on range highs, range lows, and the midpoint. But fakeouts are common, so context matters.
📊 Market Structure Matters
Reading market structure crypto helps separate real moves from noise. A clean breakout can shift the range into a trend. Until then, the market is still in chop mode.
That is why crypto chart consolidation and other price movement patterns should be read as context, not certainty.
🚦 Final Takeaway
Markets spend a lot of time sideways because price needs to reset, absorb liquidity, and prepare for the next move. A range trading market may look boring, but it is often where the next big setup starts forming.
This material is for educational purposes only and does not constitute financial advice. Education 
 Long
Long
Long 
 Long
Long
 Short
Short
USDJPY Tactical Short Positioning Into HTF Supply RepricingMarket Context
USDJPY is currently retracing into a high-confluence premium pricing region following the impulsive downside displacement printed from the late-April highs. The current advance appears corrective in nature rather than structurally impulsive from a higher-timeframe perspective.
The broader focus here is not directional prediction, but rather identifying where the market is most likely to facilitate liquidity exchange and inventory redistribution before the next meaningful repricing event.
Current price action is rotating directly into:
• Daily supply,
• nested 4H supply,
• a fresh 4H POC/value imbalance,
• and a visible external buy-side liquidity pool resting above prior swing highs.
From an execution standpoint, this presents a potential exhaustion/reversal environment if the market fails to achieve sustained acceptance above the current premium range.
Trade Expression
Instrument:
USDJPY
Execution Model:
Passive limit participation into premium HTF supply
Entry:
160.220 Sell Limit
Protective Stop:
161.180
Target Framework:
TP1 — 158.90
TP2 — 157.55
TP3 — 156.70
Trade Thesis
The working assumption is that the current rally phase is primarily a liquidity retrieval operation designed to:
• rebalance prior downside inefficiency,
• facilitate buy-side liquidity collection,
• and mitigate higher-timeframe supply before directional continuation is resolved.
The execution is intentionally positioned deeper within supply rather than fading initial resistance interaction. The objective is to avoid early participation ahead of potential liquidity completion above the local highs.
If price trades through external liquidity and subsequently fails to sustain acceptance above the supply complex, the expectation shifts toward:
• dealer inventory redistribution,
• lower timeframe structure failure,
• and downside repricing into prior imbalance.
The setup materially improves if post-sweep orderflow produces:
• displacement lower,
• bearish engulfing expansion,
• MSS on intraday structure,
• and failed reclaim attempts after liquidity extraction.
Risk Allocation & Position Management
This is structured as an asymmetrical HTF reversal attempt with volatility-adjusted risk parameters.
Risk guidelines:
• sub-1% portfolio risk preferred,
• size adjusted relative to wider stop architecture,
• no averaging beyond predefined execution parameters.
Management framework:
• TP1 intended for partial distribution and balance sheet protection,
• stop reduction to breakeven considered only after confirmed downside displacement,
• TP2 functions as the primary swing objective,
• TP3 reserved strictly for expanded bearish continuation conditions.
Invalidation
The short thesis becomes materially weaker if:
• price achieves sustained daily acceptance above the supply complex,
• bullish continuation develops via compression and absorption,
• or repeated tests of supply fail to generate meaningful downside displacement.
Under those conditions, the market would likely be signaling passive offer absorption rather than active distribution.
Conclusion
This is a liquidity-driven premium supply execution, not a momentum fade.
The edge here derives from:
• positioning into asymmetric pricing,
• allowing liquidity objectives to complete,
• and participating only if higher-timeframe supply reasserts control post-sweep.
Execution quality and post-entry orderflow behavior remain the critical variables.
US Bond Yields Break Ascending Broadening WedgeUS10Y — "US Bond Yields Break Out of Consolidation! A Fresh Alarm for Risk Assets?"
Date: May 18, 2026
We need to take our eyes off stocks and crypto for a moment to analyze the global proxy for borrowing costs: the 10-Year US Treasury Yield (US10Y). The weekly chart is flashing a major warning signal that could soon rattle investment portfolios worldwide. Let’s break down what price patterns and time cycles are revealing.
________________________________________
🔍 1. Technical Analysis
• Basic Level: In the macro view, the US10Y continues to trade within a massive Ascending Broadening Wedge. The recent weekly close at 4.601% signals that bullish momentum has returned with significant strength.
• Advanced Level: The latest weekly candle delivered a powerful breakout above the short-term resistance line (Inner Downtrend Line) at 4.500%. This breakout aligns perfectly with the Dotted Parabolic Arcs (representing Time Cycles), confirming that yields have bottomed out for this cycle. The yield is now turning upward into a fierce new wave (indicated by the blue arrow), mirroring past historical behavior (yellow arrow).
________________________________________
📉 2. Trend Outlook
• Short-to-Medium Term: Distinctly Bullish. The trend has shifted upward after unlocking the key psychological and technical resistance at 4.500%.
• Long-Term: The macro structure remains an established Structural Uptrend, characterized by a series of higher lows well above the primary support line.
________________________________________
💼 3. Trading & Portfolio Strategy
• For Yield Speculators: Focus on Long Yield / Short Bond Price positions to ride the momentum above 4.500%, or look to enter on a throwback (retest of support).
• For Overall Portfolios: Historically, a surging US10Y exerts heavy pressure on risk assets, particularly high-growth tech stocks and Gold. Investors should exercise extreme caution and avoid chasing rallies in Big Cap equities while yields hover above 4.601%.
________________________________________
🎯 4. Key Targets (Yield %)
Level Type Yield Target Technical Description
First Resistance 4.750% Previous short-term swing high
Major Resistance 5.000% - 5.150% Cycle target zone (apex of the blue arrow / upper boundary of the Broadening Wedge)
First Support 4.500% Breakout level (former resistance turned support)
Structural Support 3.900% - 4.000% Primary long-term ascending support line
________________________________________
🛑 5. Stop Loss
For yield bulls, the ultimate invalidation level (Structural Stop) is a weekly close below 4.350%. Dropping below this level would confirm a False Breakout and drag the yield back into a deep consolidation phase.
________________________________________
🔄 6. Scenarios & Market Probabilities
• Rally to 5.000%+ (70% Probability): This is the highly probable base case. The latest weekly candle closed as a strong, solid green body above 4.500%, confirming the cyclical reversal.
• Minor Pullback / Range-bound (30% Probability): Yields may temporarily retest the 4.500% support floor before accumulating enough energy to resume the uptrend.
• Invalidation Condition: The bullish outlook will be completely nullified if the yield plunges and registers a weekly close below the critical structural support at 4.000%.
________________________________________
📝 Market Summary
The 10-Year US Treasury Yield (US10Y) has made its choice, decisively breaching the 4.500% barrier. This price action perfectly validates our primary time cycle, sending a clear warning that global capital costs are about to get more expensive.
With the next destination sitting at the psychological 5.000% milestone, investors should actively rebalance their asset allocation. Staying flexible will be key to weathering the volatility expected across risk assets during the second half of 2026.
Disclaimer: This analysis is based on technical indicators and historical data. Investors should always cross-reference technical setups with incoming inflation data and Federal Reserve policy decisions before making investment choices.
 Long
Long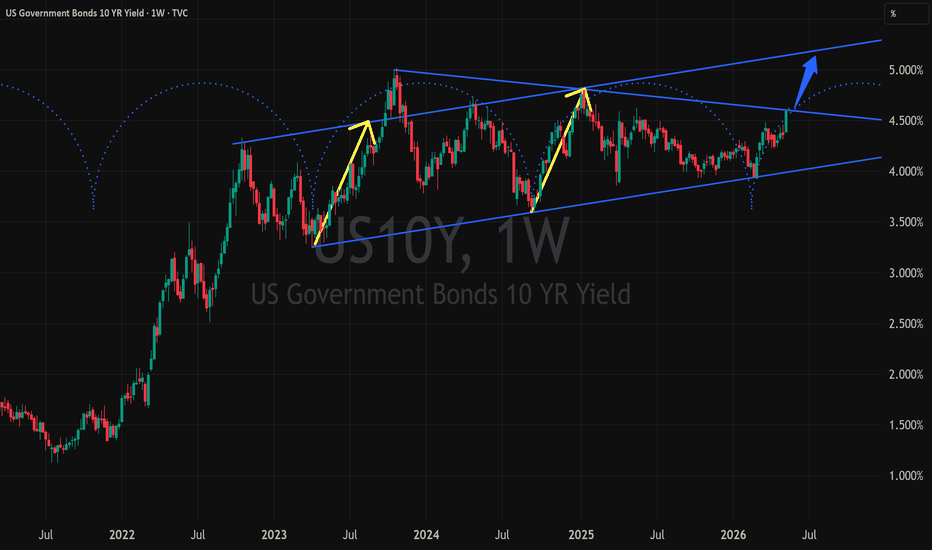
Gold Week Ahead Strategy (May 17, 2026)#XAUUSD Week Ahead Strategy (May 17, 2026)
📉 Daily Timeframe Outlook:We are in an overall bearish trend. After a temporary rally over the past month, the price is now aggressively pushing back down toward the previous lows.
⏱️ 4H Timeframe Outlook: The momentum of this latest downward wave is exceptionally strong. It is highly probable that the immediate level at 4,510.00 will be easily broken.
❗️Downside Targets: If the current support fails, the next major support levels to watch for potential reaction or targets are 4,377.00 and 4,250.00. You can look for entry setups on either of these supports only if a clear confirmation candle appears.
🎯 My Trading Strategy: My primary bias remains strictly bearish. However, we must watch for two key structural levels:
🔼The Pullback Scenario: The price might attempt a short-term pullback toward 4,622.00. If it reaches this level and shows rejection, it offers a high-probability short setup.
🔽The Trend Shift: If the price breaks cleanly above 4,622.00, the bearish structure invalidates, and the trend will flip to bullish. Until then, look for sell confirmations.
📊 Reason for Entry & Exit
⚠️ Execution Rule: The setup is only valid if a candle closes with these exact criteria.
1️⃣ Valid Breakout: At least 80% of the candle body must close outside the key level in the direction of the trade.
2️⃣ Momentum: The body size must be at least 2x the size of its shadows (No Doji or Pin bars allowed).
3️⃣ Relative Size: The candle body should be average-to-large compared to recent candles.
4️⃣ Pullback Entry: If the price breaks through and then retests the level, you can safely enter using a confirmation candle meeting the criteria above.
🛡 Position Management
🔴 Stop Loss (SL): Placed safely behind the last swing prior to the breakout candle.
🟢 Take Profit (TP): Main target levels are marked numerically on the chart (4,622.00 / 4,510.00 / 4,377.00 / 4,250.00).
🔼 Note: Only accept trades with a minimum 1:1 Risk/Reward ratio. Use Risk-Free (Break-even) management to trail higher targets.
⚠️ Risk Warning: The crypto market is highly volatile. Please strictly follow your proper risk and money management rules if you enter based on this setup.
💬 Join the Discussion: I'd love to hear your thoughts on this setup in the comments! For direct inquiries or more details, feel free to message me in private chat.
📈 Daily Trade Updates: I post daily analysis and intraday setups for both Bitcoin (BTC) and Gold (XAU) right here. Follow this page closely to copy and track these setups for your real trading journey! BTC Week Ahead Strategy (May 17, 2026)📊 BITSTAMP:BTCUSD Analysis for the Week Ahead | May 17, 2026
📉 Daily Timeframe Outlook: We are currently witnessing a deeper retracement compared to previous corrective waves within an overall bearish market structure. This highlights growing selling pressure in the medium term.
⏱ 4H Timeframe Outlook: Following the sharp decline from last week's high, the price maintains its bearish momentum. There is a high probability of continued downside toward the key liquidity level at $77,000.
🎯 My Trading Strategy: Patience is key right now. I am waiting for the price to react to the $77,000 zone before pulling the trigger:
Bullish Scenario (Buy): If we see a strong bullish reaction at this level followed by a breakout of the recent minor lower highs, I will look for long positions in the direction of the new momentum.
Bearish Scenario (Sell): If the price breaks cleanly below this level, I will apply the exact same strategy for a short position beneath the zone.
🚦 Reason for Entry & Exit
⚠️ Execution Rule: The setup is only valid if a candle closes with these exact criteria.
1️⃣ Valid Breakout: At least 80% of the candle body must close outside the key level in the direction of the trade.
2️⃣ Momentum: The body size must be at least 2x the size of its shadows (No Doji or Pin bars allowed).
3️⃣ Relative Size: The candle body should be average-to-large compared to recent candles.
4️⃣ Pullback Entry: If the price breaks through and then retests the level, you can safely enter using a confirmation candle meeting the criteria above.
🛡 Position Management
🔴 Stop Loss (SL): Placed safely behind the last swing prior to the breakout candle.
🟢 Take Profit (TP): Main target levels are marked numerically on the chart ($75,000 / $79,300 / $82,000).
🔼 Note: Only accept trades with a minimum 1:1 Risk/Reward ratio. Use Risk-Free (Break-even) management to trail higher targets.
⚠️ Risk Warning: The crypto market is highly volatile. Please strictly follow your proper risk and money management rules if you enter based on this setup.
💬 Join the Discussion: I'd love to hear your thoughts on this setup in the comments! For direct inquiries or more details, feel free to message me in private chat.
📈 Daily Trade Updates: I post daily analysis and intraday setups for both Bitcoin (BTC) and Gold (XAU) right here. Follow this page closely to copy and track these setups for your real trading journey!  Long
Long