##Leading Diagonal Completed | What Is Silver Telling Us Next?# Silver | U.S. Dollar — XAGUSD
Following the previous analysis, the price structure has now provided us with stronger evidence.
The **Leading Diagonal** that we previously considered as one of the primary aggressive scenarios has now completed with a valid **5-3-5-3-5 structure**, remaining consistent with the rules and guidelines of the Elliott Wave Principle.
Therefore, the possibility of facing a **larger correction** from this area has become increasingly important.
The current price ac
Economic Cycles
XAUUSD | Bullish Breakout with Upside PotentialThe price has broken above the descending channel and is now retesting the breakout area as support. As long as the price holds above this level, I expect the bullish momentum to continue toward the marked resistance zone.
Entry: Current price or after a confirmed retest.
Stop Loss: Below the highlighted support area.
Target: 4839.89.
This setup is based on market structure, channel breakout, and support/resistance analysis. Always wait for confirmation and apply proper risk management.
Gold | Tracking Wave IV Before the Next Major MoveGold | Tracking Wave IV Before the Next Major Move
XAUUSD | 4H Elliott Wave Update
Based on the Elliott Wave Principle, two primary structural scenarios currently best fit the market. These represent our current interpretation of price behavior and will be reviewed as new structural evidence emerges.
In the aggressive scenario, Wave A is considered complete as a Leading Diagonal. The Base Channel has been drawn solely to evaluate the first impulsive advance of Wave B. If this structure remains
Bitcoin: Double Zigzag or Triple Zigzag? | Elliott Wave AnalysisIn this analysis, the primary focus is identifying the corrective structure that has been developing since Bitcoin's recent all-time high. Based on the current wave count and the Elliott Wave Principle, the price action continues to resemble the complex Zigzag family. The key question, however, is whether the market is developing a Double Zigzag or extending into a Triple Zigzag.
Under the aggressive scenario, the preferred interpretation continues to favor the development of a Triple Zigzag. F
Is Wave 3 Beginning, or Is One More Correction Still Ahead?## Crude Oil: Is Wave 3 Beginning, or Is One More Correction Still Ahead?
From the largest Elliott Wave perspective, crude oil remains within the final fifth wave of the highest degree.
Following the completion of the larger-degree Wave 4, an entire eight-wave cycle appears to have been completed. The market has now reached a critical point where two primary scenarios remain valid.
### Aggressive Scenario
The bullish interpretation suggests that Waves 1 and 2 of Wave 3—within the larger fift
BABA: The Zone Broke Before It WorkedThirty-eight bars ago, Structura Accumulate marked a zone on BABA around 111. Price then did the thing nobody puts in a marketing screenshot: it fell straight through, to 92.50.
Today it trades near 127.
Read that sequence honestly, because it is the whole lesson.
A zone is not a floor. It marks where a market is rebuilding structure around a long-anchored reference - not a level that holds. The 20% drawdown below the zone was not the tool being wrong. It was the test running, and the first
ADA Analyses-13, [July 21, 2026]Welcome to my page! I share daily technical analyses of crypto assets and other charts here.
BINANCE:ADAUSDT
💡Market Analysis:
ADA has broken above the descending trendline and key resistance level with a strong bullish momentum candle. A successful retest of this key level will confirm the continuation of the upward trend toward the next resistance targets.
Key Support & Resistance:
Key Resistance: 0.1943 - 0.2262
Key Support Area: 0.1735 (Key Level) / 0.1560
🎯 Trade Entry & Exit P
Price Discovery — Where Trends Actually Come FromMost traders treat range and trend as opposites — one to avoid, one to chase. They are not opposites. They are two stages of the same process, and understanding how one produces the other changes how every chart gets read.
Two States, Not Two Choices
Every chart is showing one of two things at any given moment: a market negotiating, or a market discovering. A range is negotiation — neither side has enough conviction to push price beyond the current boundaries, so price oscillates while parti
$XAUUSD | Is Wave IV Taking Shape?Gold’s larger structure is currently at a critical stage.
At this point, only a decisive break above the current all-time high, followed by a clearly impulsive structure, can confirm the continuation of the broader bullish trend. A brief breakout alone is not enough — the internal structure of the move after the breakout is equally important.
Until then, the main priority is to observe price behavior and evaluate the possibility of a corrective structure developing.
According to the Guideline
Silver (SI1!) | Elliott Wave Structure and the Paths AheadSilver (SI1!) | Elliott Wave Structure and the Paths Ahead
Silver’s long-term structure remains focused on the aggressive Elliott Wave scenario, shown by the blue path.
Under this count, Silver may have completed a major Wave 1 at the 2011 peak, followed by a deep and complex Wave 2 correction. The current advance may now be the early stage of a larger Wave 3.
However, a bullish structure does not mean price must move higher without corrections. From here, Silver may form a small short-term c
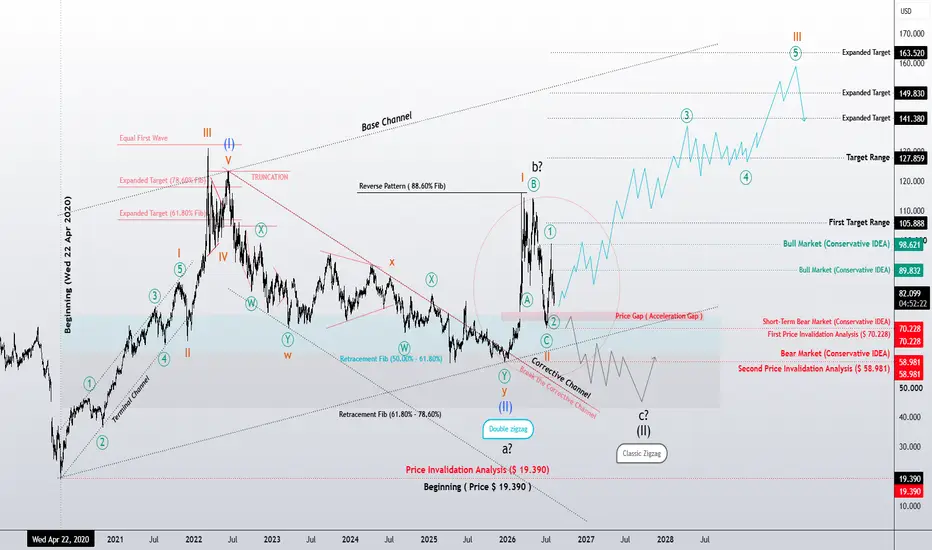
Bitcoin Momentum Update #4: Back Above NeutralBitcoin Daily Time Series Momentum has moved back above the neutral 1.0 level and is currently reading approximately 1.01 .
After recovering from the lower reference zone near 0.8, momentum spent several weeks moving around the neutral level. The latest reading shows another move into positive territory.
What has changed?
Short-term daily momentum is once again slightly stronger than its longer-term momentum baseline.
The important question now is whether momentum can remain above 1.0
AUD/USD Weekly | Two Valid Elliott Wave ScenariosAUD/USD Weekly Chart | Elliott Wave Principle
The weekly structure continues to support two valid scenarios for the larger-degree Wave (B). Until the market provides additional evidence, both scenarios remain valid under the rules and guidelines of the Elliott Wave Principle.
Since this chart represents the relative value of the Australian Dollar against the U.S. Dollar, prolonged one-directional trends are generally less common than in many other markets. Monetary policy, interest rates, infl
FBMKLCI Long-Term Cycle: Can the Index Break 1,882 ?This six-month chart presents a long-term technical outlook for the FTSE Bursa Malaysia KLCI (FBMKLCI) based on historical market cycles, Fibonacci projections and BBMA structure.
FBMKLCI is currently trading around 1,732 points after recovering from the major correction zone near 1,350–1,400. The index remains above its long-term moving-average support, while the Bollinger Band structure is beginning to improve. This suggests that the broader recovery remains intact, although the index has not
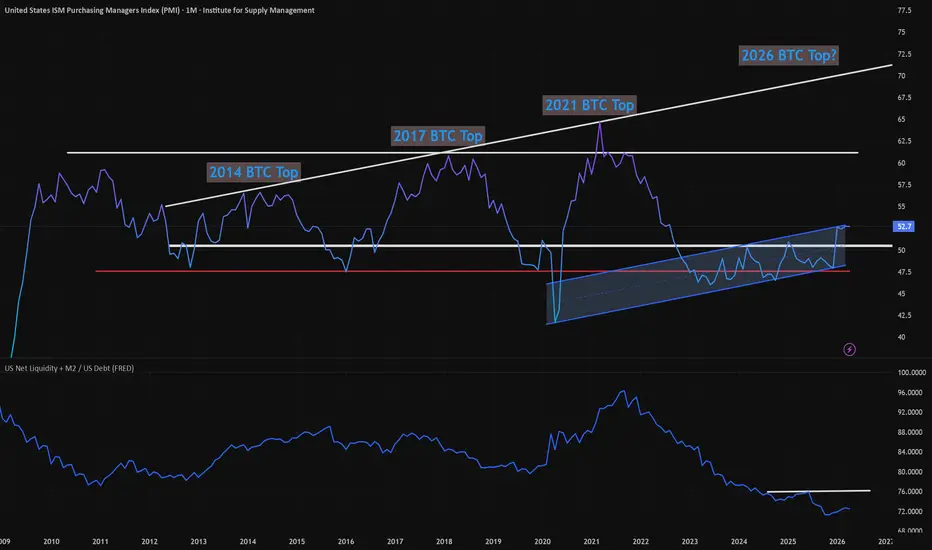
2026 ATH Rally? PMI and US Net Liquidity + M2 / US DebtIn this study, we analyze the ISM Purchasing Managers Index which while in an uptrending parallel channel of sorts, it also shows that the 2025 'Bull Run' never got close to projected 'top' levels.
Almost as if we never had the 2025 bull market top rally. Could it just be DELAYED?
While The ISM Manufacturing PMI is holding above the critical 50 threshold indicates continued economic expansion, which historically correlates with risk-on sentiment in crypto markets.
At 52.7 (+0.57%), we're see
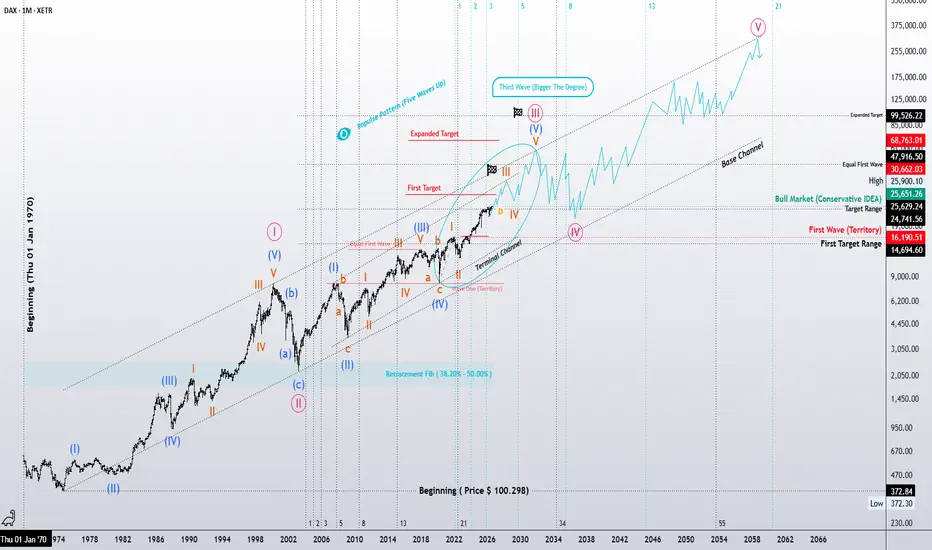
DAX 40 | Is a Powerful Third Wave Still Unfolding?Elliott Wave Perspective
The long-term structure of the DAX 40 continues to align with the characteristics of a developing bullish impulse. Based on the current wave count, the market may still be advancing within a higher-degree Wave III—a phase that often displays the strongest momentum and acceleration within an impulsive cycle.
One of the most important aspects of the current structure is the relationship between the waves of a lower degree. Since Wave (1) and Wave (3) are approximately eq
MSFT: Six Months in a Zone - Reading the Exit HonestlySeven bars ago, MSFT left an accumulation zone it had lived in for roughly six months. The status panel now reads NO ACCUMULATION, relative volume reads HIGH, and price is back at the prior shelf near 480. This is the part of a zone's life that gets misread most - so here is the honest version.
What the chart shows
From the August 2025 high near 560, MSFT declined for months and then spent February through July building a base between the mid-340s and the low 430s. The tool printed its marks
EURUSD Report: Resistance (M FVG) Mitigation & July Low Vector1. High-Horizon Order Flow & Active Range Positioning
The macro framework for EURUSD continues to be governed by our multi-year Monthly dealer range (1.20831 to 1.01779). As illustrated on the monthly workspace, price action is actively trading within the Premium Half of this monitored dealer range.
Our primary high-horizon stance remains objectively bearish. As long as order flow is constrained beneath major overhead resistance, the technical path of least resistance points directly toward sel
EURUSD Structural Report: FMP Weekly Market Preview1. High-Horizon Order Flow Context
The structural framework for EURUSD remains firmly in a high-horizon bearish expansion phase. Following the explicit weekly candle body break beneath the 1.14110 BreakPoint floor, order flow is operating with an aggressive downward velocity.
Accounting for an average weekly distribution profile of 150+ pips, our technical framework tracks price delivery strictly via hard-coded spatial parameters rather than predictive session bias.
2. Structural Pathways (Th
NQ Weekly Outlook: Higher Early, Lower Midweek? | 3–7 August2026The Fringe Cycles model read for the coming week suggests a mixed structure: positive early in the week, negative through the middle, and potentially positive again into Friday.
This outlook is based on the NQ Globex session, not only regular cash-session price action. Each daily bias applies approximately from 18:30 Eastern on the previous evening through 15:30 Eastern on the stated trading day. For evaluation, each daily bias is measured from the 18:30 Eastern opening price using a 2% target
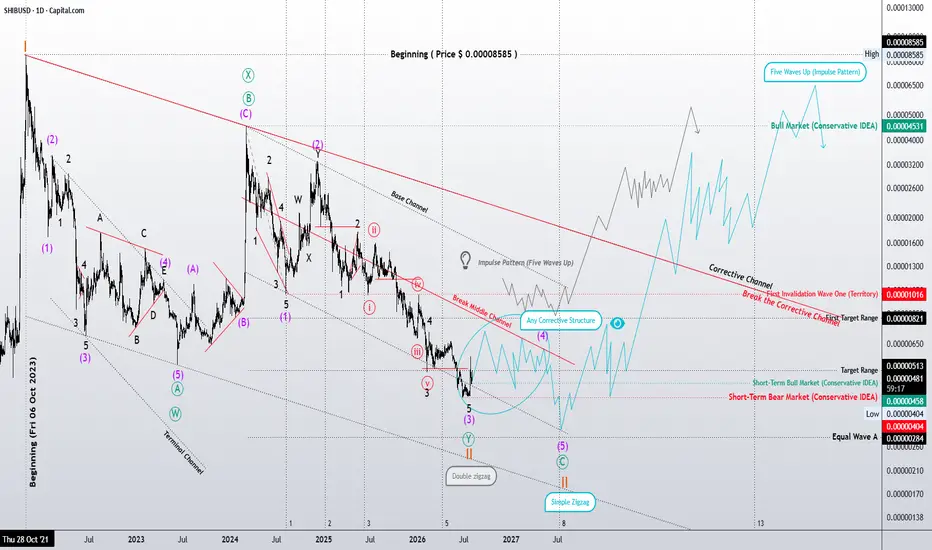
Two Valid Elliott Wave Scenarios Before the Next Bullish PhaseSHIBA Daily | Two Valid Elliott Wave Scenarios Before the Next Bullish Phase
A closer examination of the daily chart suggests that the current corrective structure can be interpreted in two valid ways under the Elliott Wave Principle.
The first scenario considers the correction as a completed or nearly completed Double Zigzag (W-X-Y). If this interpretation is correct, SHIBA may already be approaching the end of its higher-degree correction, allowing the market to begin building a new bullish
Is a Powerful Third Wave Still Unfolding? | Elliott Wave PerspecDAX 40 | Is a Powerful Third Wave Still Unfolding? | Elliott Wave Perspective
The long-term structure of the DAX 40 continues to align with the characteristics of a developing impulsive trend. If the current wave count remains valid, the market may still be advancing within a higher-degree Wave III, the phase that often carries the strongest momentum of an impulsive cycle.
One of the most interesting aspects of the current structure is the relationship between the lower-degree waves. The near
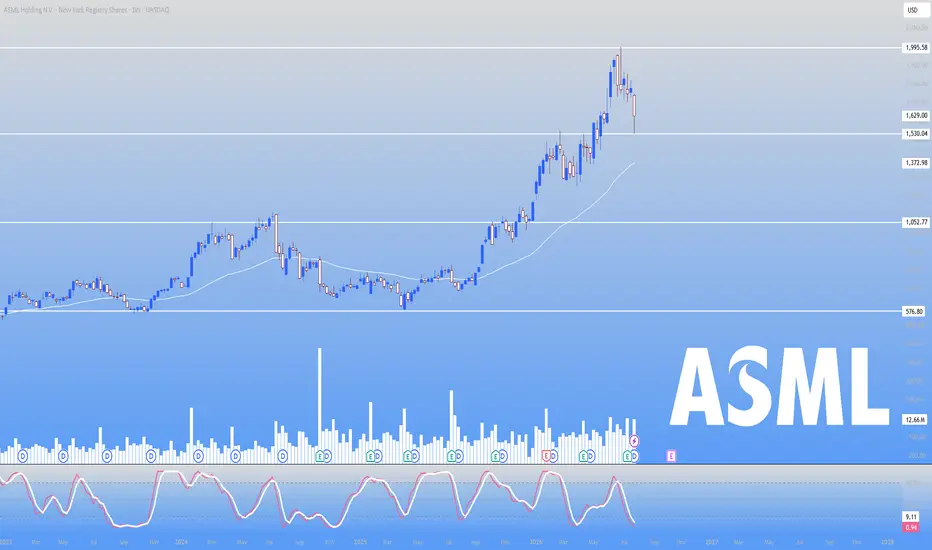
Why Semiconductor Stocks Suddenly CrashedThe AI driven semiconductor rally suffered one of its sharpest pullbacks of the year as investors questioned whether the industry's massive capital spending can generate returns quickly enough to justify record valuations.
The selloff accelerated after concerns emerged that cheaper Chinese AI models and growing competition could reduce the long-term demand for premium AI infrastructure, while rising Treasury yields further pressured high growth technology stocks. Hedge funds also reduced expos