FBMKLCI Long-Term Cycle: Can the Index Break 1,882 ?This six-month chart presents a long-term technical outlook for the FTSE Bursa Malaysia KLCI (FBMKLCI) based on historical market cycles, Fibonacci projections and BBMA structure.
FBMKLCI is currently trading around 1,732 points after recovering from the major correction zone near 1,350–1,400. The index remains above its long-term moving-average support, while the Bollinger Band structure is beginning to improve. This suggests that the broader recovery remains intact, although the index has not
Economic Cycles
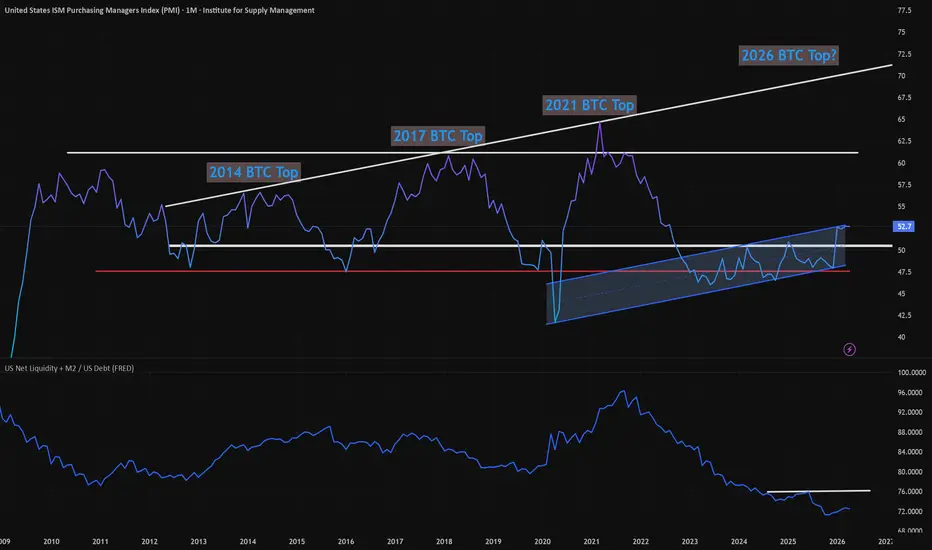
2026 ATH Rally? PMI and US Net Liquidity + M2 / US DebtIn this study, we analyze the ISM Purchasing Managers Index which while in an uptrending parallel channel of sorts, it also shows that the 2025 'Bull Run' never got close to projected 'top' levels.
Almost as if we never had the 2025 bull market top rally. Could it just be DELAYED?
While The ISM Manufacturing PMI is holding above the critical 50 threshold indicates continued economic expansion, which historically correlates with risk-on sentiment in crypto markets.
At 52.7 (+0.57%), we're see
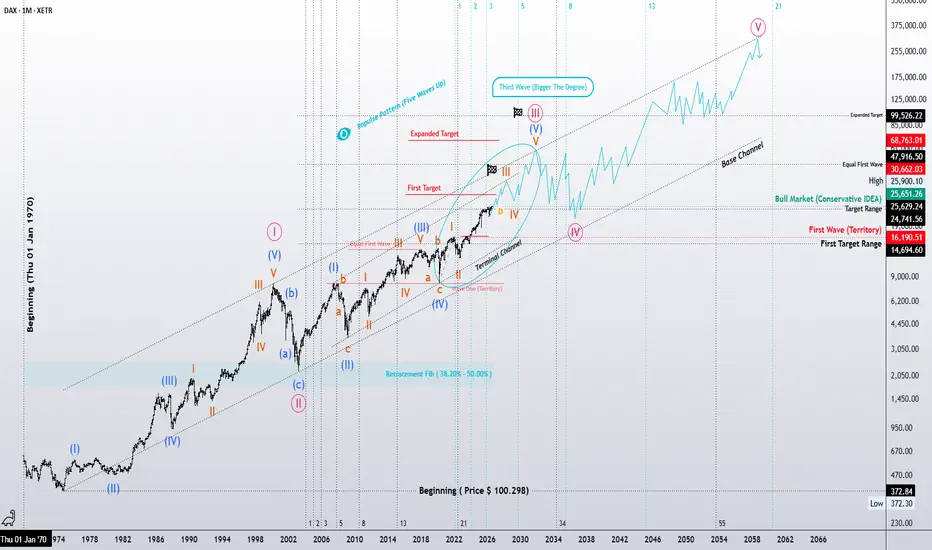
DAX 40 | Is a Powerful Third Wave Still Unfolding?Elliott Wave Perspective
The long-term structure of the DAX 40 continues to align with the characteristics of a developing bullish impulse. Based on the current wave count, the market may still be advancing within a higher-degree Wave III—a phase that often displays the strongest momentum and acceleration within an impulsive cycle.
One of the most important aspects of the current structure is the relationship between the waves of a lower degree. Since Wave (1) and Wave (3) are approximately eq
MSFT: Six Months in a Zone - Reading the Exit HonestlySeven bars ago, MSFT left an accumulation zone it had lived in for roughly six months. The status panel now reads NO ACCUMULATION, relative volume reads HIGH, and price is back at the prior shelf near 480. This is the part of a zone's life that gets misread most - so here is the honest version.
What the chart shows
From the August 2025 high near 560, MSFT declined for months and then spent February through July building a base between the mid-340s and the low 430s. The tool printed its marks
EURUSD Report: Resistance (M FVG) Mitigation & July Low Vector1. High-Horizon Order Flow & Active Range Positioning
The macro framework for EURUSD continues to be governed by our multi-year Monthly dealer range (1.20831 to 1.01779). As illustrated on the monthly workspace, price action is actively trading within the Premium Half of this monitored dealer range.
Our primary high-horizon stance remains objectively bearish. As long as order flow is constrained beneath major overhead resistance, the technical path of least resistance points directly toward sel
EURUSD Structural Report: FMP Weekly Market Preview1. High-Horizon Order Flow Context
The structural framework for EURUSD remains firmly in a high-horizon bearish expansion phase. Following the explicit weekly candle body break beneath the 1.14110 BreakPoint floor, order flow is operating with an aggressive downward velocity.
Accounting for an average weekly distribution profile of 150+ pips, our technical framework tracks price delivery strictly via hard-coded spatial parameters rather than predictive session bias.
2. Structural Pathways (Th
NQ Weekly Outlook: Higher Early, Lower Midweek? | 3–7 August2026The Fringe Cycles model read for the coming week suggests a mixed structure: positive early in the week, negative through the middle, and potentially positive again into Friday.
This outlook is based on the NQ Globex session, not only regular cash-session price action. Each daily bias applies approximately from 18:30 Eastern on the previous evening through 15:30 Eastern on the stated trading day. For evaluation, each daily bias is measured from the 18:30 Eastern opening price using a 2% target
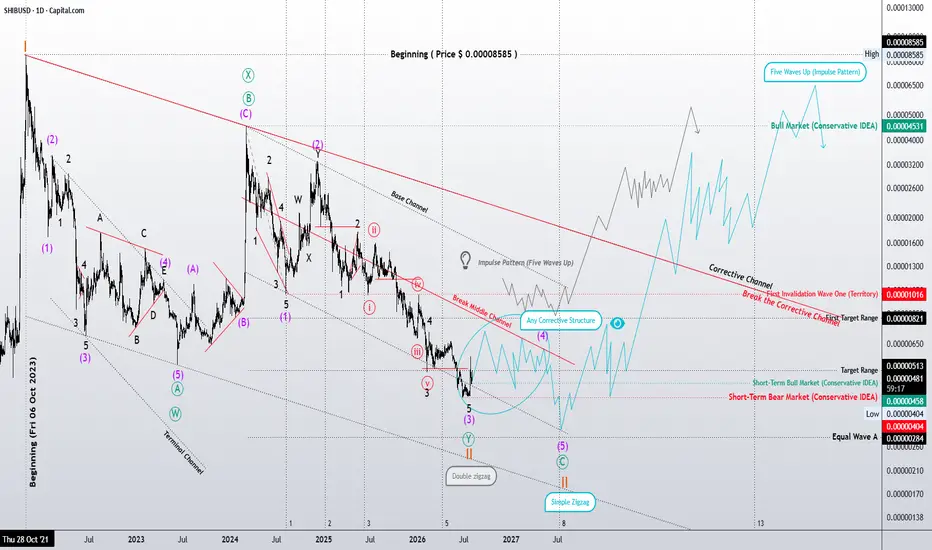
Two Valid Elliott Wave Scenarios Before the Next Bullish PhaseSHIBA Daily | Two Valid Elliott Wave Scenarios Before the Next Bullish Phase
A closer examination of the daily chart suggests that the current corrective structure can be interpreted in two valid ways under the Elliott Wave Principle.
The first scenario considers the correction as a completed or nearly completed Double Zigzag (W-X-Y). If this interpretation is correct, SHIBA may already be approaching the end of its higher-degree correction, allowing the market to begin building a new bullish
Is a Powerful Third Wave Still Unfolding? | Elliott Wave PerspecDAX 40 | Is a Powerful Third Wave Still Unfolding? | Elliott Wave Perspective
The long-term structure of the DAX 40 continues to align with the characteristics of a developing impulsive trend. If the current wave count remains valid, the market may still be advancing within a higher-degree Wave III, the phase that often carries the strongest momentum of an impulsive cycle.
One of the most interesting aspects of the current structure is the relationship between the lower-degree waves. The near
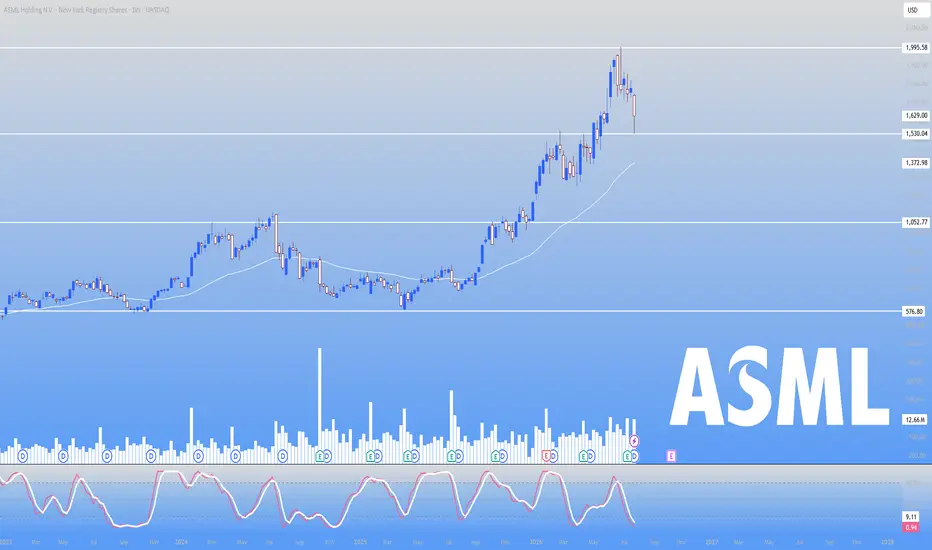
Why Semiconductor Stocks Suddenly CrashedThe AI driven semiconductor rally suffered one of its sharpest pullbacks of the year as investors questioned whether the industry's massive capital spending can generate returns quickly enough to justify record valuations.
The selloff accelerated after concerns emerged that cheaper Chinese AI models and growing competition could reduce the long-term demand for premium AI infrastructure, while rising Treasury yields further pressured high growth technology stocks. Hedge funds also reduced expos
AUD/USD Monthly Chart | Elliott Wave Principle
A long-term structural review suggests that the decline from the all-time high can be interpreted as a completed five-wave impulsive decline. Following that move, the market developed a three-wave corrective structure, which, from an Elliott Wave perspective, may represent only a portion of a larger-degree corrective pattern.
At this stage, it is still too early to assemble the entire puzzle. The roadmap presented on the chart should be viewed as a structural hypothesis based on the current wa
Research & Educational | When Structure Speaks Before Price📚 Research & Educational | When Structure Speaks Before Price
The value of an analysis should not be judged solely by whether a target was reached. Instead, it should be evaluated by whether the market structure was identified correctly before the move unfolded.
In this study, originally published nearly a year ago, the focus was not on predicting a specific price. Instead, the analysis emphasized the potential completion of a corrective structure, the identification of an invalidation level,
SHIBA | Is the First Major Cycle Ending? A Potential Golden Era SHIBA | Is the First Major Cycle Ending? A Potential Golden Era Ahead?
Based on my personal interpretation of the current Elliott Wave Principle structure, SHIBA may be approaching the completion of its first major corrective cycle. Either the correction has already ended, or the market may require only the completion of the remaining lower-degree waves before a new motive cycle can begin.
This view is based on my wave count, Fibonacci relationships, and the current price structure. According
CAKE: Four Inside Weeks, Failed Breakdown, and Reclaim Attempt
⚛️ CAKE has spent roughly four weeks tightening inside a shrinking range, with each weekly candle compressing further into the apex. That is the type of market state I want to pay attention to. Not because it guarantees direction, but because sustained compression usually precedes expansion.
The important development is the downside fakeout. Price swept below the lower range support, failed to accept lower, and has now reclaimed back into the range. That puts trapped shorts and late sellers i
TQQQ: Price Is Approaching the ReferenceStructura Accumulate has been silent on TQQQ for 90 bars. In that stretch price roughly doubled from the low $40s to near $88, then gave back about 34% from that high. The reference line the tool draws now sits at 51.52, roughly 11% below the last close of 57.75 - and the chart has that unmistakable look: price heading toward a line that marked two lows before.
This Idea is about why that look is a trap, and what the honest read of this chart is today.
What the chart shows
Two zones since A
PUNCH. Loss of conviction and paper hands.$PUNCH springtime glory is a thing of the past, and now reality of a bear market is testing community's endurance amid a constant price dump
buying now is a pig in a poke, as evidenced by last week's move, which was swallowed up by selling, and the price has returned to its original position - that is, to a decline
paper hands won't attract investments from conviction wallets here, simply because no one wants their bag constantly eroded by selling - $PUNCH community needs to maintain its convi
Semiconductor Tech vs DOWSome cycles rotation
Here is a breakdown of the comparison between Semiconductor Tech (SMH) and the Dow Jones Industrial Average (DJI) based on the video:
1. Market Rotation Dynamics
Shift from Tech to Value/Cyclicals: Money is actively rotating out of high-flying semiconductor stocks and growth tech into safer, dividend-paying, or blue-chip value sectors within the Dow Jones Industrial
2. Short-Term vs. Long-Term Trend
Long-Term: Semiconductors have consistently outperformed the Dow Jones
Sh
Is Wave 3 Beginning, or Is One More Zigzag Still Ahead?Crude Oil (UKOIL) | 4H Elliott Wave Update
From an Elliott Wave perspective, Waves I and II of the current degree appear to be complete.
Wave I developed as an Impulse, ending with signs of a possible truncation, while Wave II unfolded as an Expanded Flat, which now appears to be complete.
The focus now shifts to the current price action and the character of the developing structure.
From the recent low, the initial rally can be counted as a clear five-wave Impulse, suggesting that Wave 1 of
AAPL – 291 Reclaim Confirms The CSE Continuation Case |Apple is now turning into a very important live case for my CSE Capital — Option Decision OS, also known as the Continuation Swing Engine.
In my earlier Apple analysis, the message was clear: Apple remained a high-quality stock, but I did not want to chase it without structure. A strong company is not automatically a good option entry. The stock first needed to reclaim an important technical zone and prove that buyers were taking control again.
That key zone was 291.
Now that Apple has reclai
SPCX should go higherI recently visited The Kennedy Space Center Visitor Complex and had a chat with an astronaut about the Perseverance and Curiosity rovers. At some point, he mentioned he'd recently talked to Elon about SpaceX and was told Elon wanted to land his rockets in the ocean to help generate coral reefs. Interesting! I also realized how frequently SpaceX was on display throughout the complex. I couldn't stop thinking any investment in SPCX will have a decent ROI in the future.
That said, the stock took a
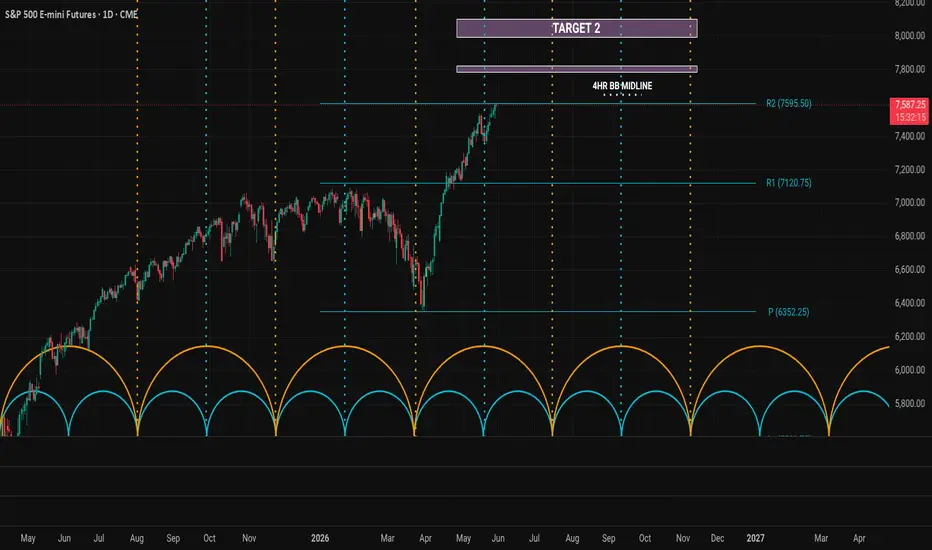
S&P 500: Third-Wave Expansion or a Deeper Correction?The larger structure provides the context.
The structure inside the red circle may reveal the answer.
Is the current advance still developing a powerful third wave—or is the market approaching a deeper correction?
Zoom in. Read the structure. Then return to the bigger picture.
— Research by Mr. Nobody
“Patterns whisper. I listen.” 🎧📊
S&P 500 Index
yesterday
The First Grand Impulse or the Beginning of an Extended Fifth Wa
US10YR 1W TIME CYCLESCYCLICAL PATTERN OF 65 - 70 WEEK HIGHS (+-2)
Smaller Pattern of 20 - 26 Week Lower Highs from Major One.
Based on this, Next Highs should be:
Sept 28th - Nov 21st 2026
Aug 16th - Oct 5th 2027 (Major)
Inversely correlated with Stocks/SPX/NDX so a High = a Low for those ones (usually)