Long
Long
ETF POWER CAN GAIN BTC TO 92K + INTO 2026 BULLRUN ALREADY STARTThe ETF structure is one of the strongest structures Bitcoin can have. Based on the data, we are seeing steady ETF inflows into BTC, step by step. If this trend continues, our next target could be $84K. With strong ETF volume and continued institutional demand, Bitcoin could potentially reach $92K+ in the coming period.
Bitcoin is processing to create the 81K zone as support, which it make it as normally zone and high chance of increase to 84K, after 84K, the space trend is open to 92k+
After the 92K, the fomo can take BTC over, which the most will expect the bullrun is started, but the bullrun already started into AUG 2026  Long
Long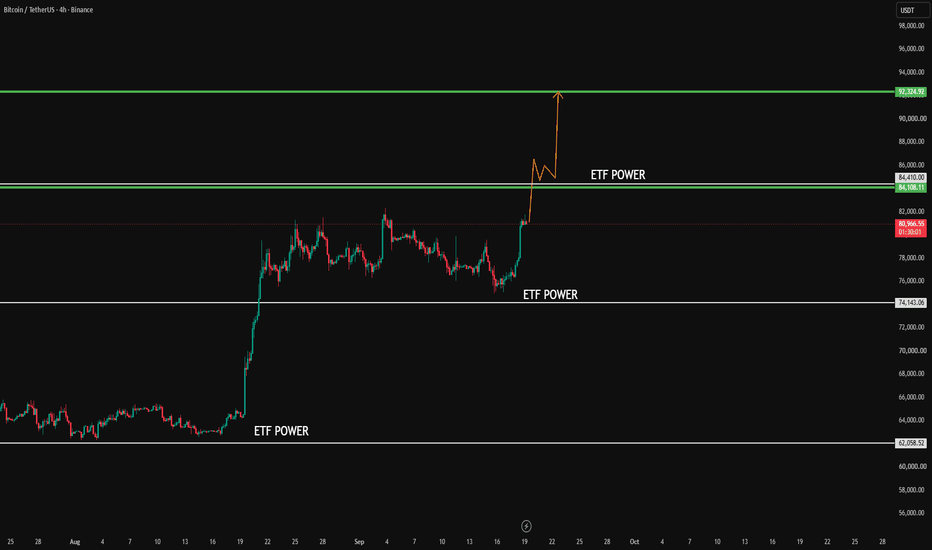
Long 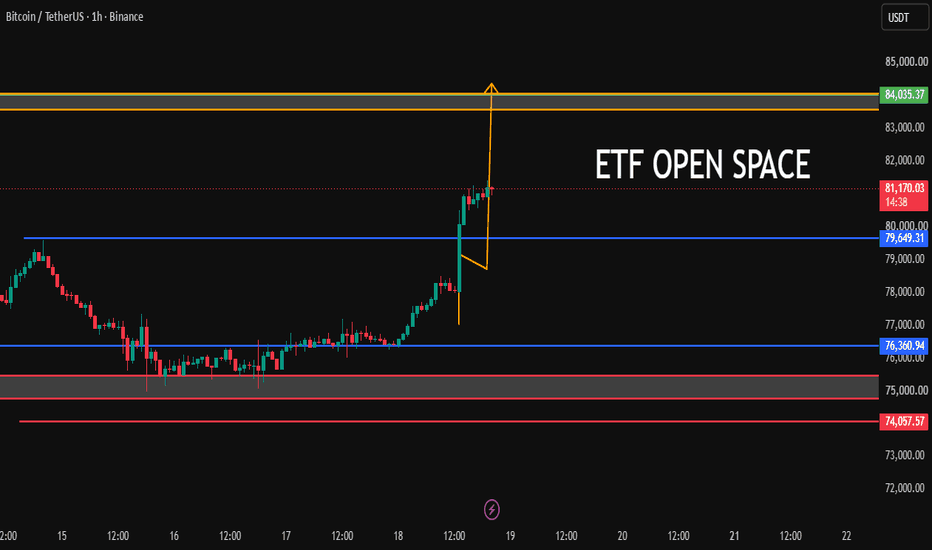
Long 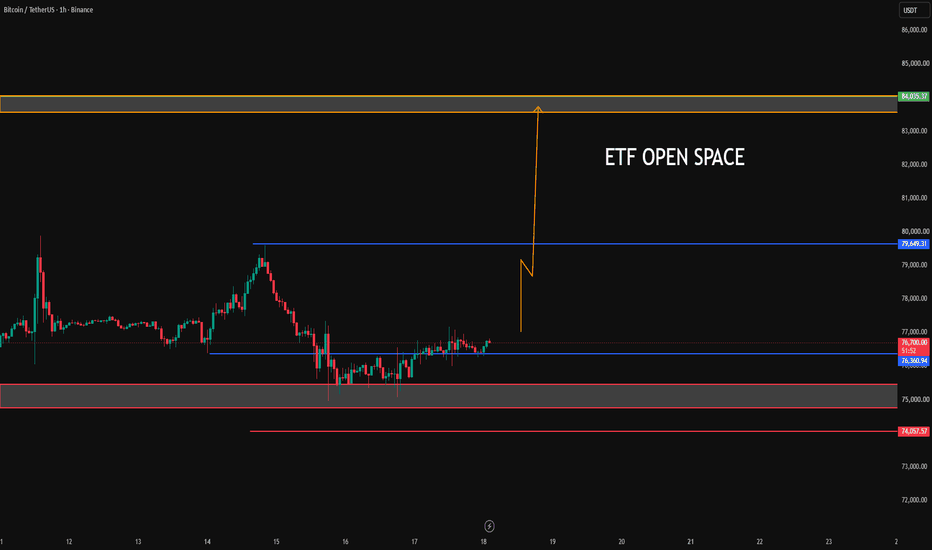
 Long
Long
 Long
Long
 Long
Long
$SOXX , 12M Semiconductor Cycle Structure IdeaSOXX tracks the semiconductor sector, giving exposure to companies across chip design, manufacturing, memory, semiconductor equipment and related technologies.
That makes SOXX much more important than simply another technology ETF.
Its cycle structure can be used as a broader reference for the semiconductor complex, including major names such as NVIDIA, AMD and Broadcom on the chip-design side, TSMC and Samsung on manufacturing, Micron and SK Hynix in memory, and ASML, Applied Materials, Lam Research and KLA across semiconductor equipment.
These companies do not all move for exactly the same reasons, but they are connected through the same semiconductor production cycle.
The current SOXX chart shows a clear 12-month cycle structure.
There are three projected upside targets for the 12M cycle.
The first target has already been reached !!
Price subsequently rejected from that level and entered the current corrective phase.
The remaining two 12M targets are still projected above the market, around 910 and 1,150.
The correction is where the structure becomes interesting.
I have three separate correction target groups mapped below the current price:
$395–$420
$320–$350
$205–$230
These are not three separate bearish scenarios. They are three possible correction zones within the same larger cycle. Price does not need to reach all three.
The cycle can complete its correction at any one of these structural areas before continuing toward the remaining 12M targets. This becomes particularly relevant when looking at the underlying semiconductor stocks.
A correction in SOXX can propagate differently through the sector:
NVDA / AMD / AVGO
semiconductor demand and high-performance compute
TSM
advanced foundry and manufacturing capacity
MU / SK Hynix / Samsung
memory and HBM cycle
ASML / AMAT / LRCX / KLAC
semiconductor manufacturing equipment and capacity expansion
Therefore, SOXX is not simply measuring one company or one semiconductor subsector. It represents the interaction between multiple stages of the semiconductor cycle.
That is why the structural levels on SOXX are important.
12M cycle target 1 : completed
Current structure : corrective phase
Correction zone 1 : $395–$420
Correction zone 2 : $320–$350
Correction zone 3 : $205–$230
12M cycle target 2 : $910+-
12M cycle target 3 : $1,150+-
Now the question is where the correction completes.
If one of the lower structures provides the required reaction, the remaining 12M targets remain part of the larger cycle structure.
The semiconductor cycle therefore becomes something I want to monitor across the entire chain rather than through a single stock (despite owning several of those)
SOXX gives us the structure !!!!!!!
The individual semiconductor stocks show how that structure propagates through the sector.
Follow, Boost, Join, Thank You!
Financial Disclaimer: This post is not financial advice. I am not your financial advisor, your life coach, or your legally responsible adult. Always do your own research and never trade based solely on internet content. $BWET - ETF , Tanker Freight Cycle Structure IdeaBWET (Breakwave Tanker Shipping ETF) is not a traditional tanker-stock ETF. It provides exposure to crude-oil tanker freight through futures, primarily VLCC TD3C contracts for Middle East Gulf to China, with additional TD20 Suezmax exposure. The instrument therefore reflects tanker freight rates, vessel availability, route changes and the pricing of future transportation costs rather than the equity value of shipping companies.
That distinction is important when reading the long-term chart.
The current weekly structure is approaching a major decision point around the 640 area.
From here, I have three different cycle paths mapped on the chart.
Path 1:
A deeper retracement toward the 210 area, followed by a recovery toward the 800–900 region and a subsequent return toward the current structural area.
This would represent a significant correction while still keeping the larger cycle structure intact.
Path 2:
Price continues expanding from the current level before completing the larger correction.
The first expansion zone is around 1,500, followed by a retracement toward the current structural area and another expansion toward the 1,200–1,250 region.
In this sequence, the correction comes later rather than immediately.
Path 3:
The 210 structural level fails and the cycle searches for much deeper liquidity.
The major downside liquidity zone is around 28–30.
From there, the chart allows for a recovery toward the 70–80 region.
Above the current structure, the higher-timeframe expansion levels become increasingly significant, with the chart projecting approximately 2,100, 2,900, 4,100 and 5,600.
The important point is that BWET can move extremely aggressively because it is directly exposed to freight futures.
A change in tanker freight conditions can therefore produce movements that are substantially larger than what would normally be expected from a conventional equity ETF.
For the cycle analysis, I am not trying to select one path in advance.
The relevant levels are the structural zones:
640 — current decision area
410–550 — structural / gap region
210 — major downside structural level
28–30 — deeper liquidity zone
1,200–1,500 — major expansion area
2,100+ — higher-timeframe expansion levels
The sequence matters more than the prediction.
Price will determine which structure remains valid.
Follow, Boost, Join, Thank You!
Financial Disclaimer: This post is not financial advice. I am not your financial advisor, your life coach, or your legally responsible adult. Always do your own research and never trade based solely on internet content.  Long
Long
 Long
Long
 Long
Long
 Long
Long
KWEB: Chinese internet on the verge of a reversalAMEX:KWEB
KraneShares CSI China Internet ETF tracks the largest Chinese internet companies trading on the Hong Kong Exchange, NASDAQ, and NYSE. Top holdings: Tencent 9.99%, Alibaba 8.08%, Meituan 8.05%, PDD Holdings 7.99%, NetEase 6.20%. Total 34 positions with AUM around $5.3–6.5 billion.
Technicals
On the daily chart, KWEB has formed an inverted head and shoulders pattern, where the deep retracement to the right shoulder‘s base coincided with the most important technical event: a daily retest of the broken global downtrend line and the 50-day moving average. In the $26.50–$26.60 range, a strong support cluster has formed, confirmed by NYSE Arca trading volumes: after Thursday’s panic sell-off, on Friday the price stabilized and trading volume dropped by a third to 18.20 million shares, indicating a shortage of sellers. RSI and Stochastic have unloaded into deeply oversold territory, forming a bullish convergence for a rebound. The current price of $26.66 offers an ideal entry point. A daily close below the key level of $26.12 would completely invalidate the pattern. The main profit target is the strong mirror level at $30.74, where the upside potential is +15.3% and where the move will encounter resistance from the 200-day moving average.
Fundamental context
On August 20, Alibaba reported its June quarter results. Revenue grew 9% year-over-year to 268.95 billion yuan ($39.64 billion). GAAP net profit fell 76% - not due to an operational crisis, but because of a 75% increase in capital expenditures to $9.98 billion on AI infrastructure and data center construction. Non-GAAP net profit declined 38%. However, Alibaba Cloud revenue accelerated to 45% year-over-year, and the AI segment has shown triple-digit growth for twelve consecutive quarters. The market panicked over the headline profit drop, but this is an investment cycle, not a business breakdown.
On March 12, 2026, the National People‘s Congress officially approved China’s 15th Five-Year Plan for the period 2025–2030. The key priority is technological self-sufficiency and strategic sovereignty in artificial intelligence, semiconductors, and digital infrastructure. This is a direct structural tailwind for all companies in the KWEB basket. The entire ETF trades at a P/E of 13.85x - a significant discount to US peers with comparable growth rates.
This week‘s global macro catalyst was the US Treasury Department’s decision to double its long-term bond buyback volume from $2 billion to $4 billion per operation. This has already triggered a powerful Bitcoin rally above $77,600 (+22% in five days), the largest weekly inflow into BTC ETFs since October 2025 ($1.92 billion), and a wave of short liquidations totaling $3.5 billion. Expanded liquidity from the Treasury historically creates a tailwind for all risk assets - including the Chinese tech sector.
This publication is for analytical purposes only and does not constitute individual investment advice. Share your thoughts in the comments and don't forget to support the idea with a like if you found the analysis useful!  Long
Long
 Long
Long
 Long
Long
QQQ: Post-ATH Consolidation – Two Paths to $850Fresh ATHs are rarely the end of a move—they are often the beginning of the next one. QQQ has printed a new all-time high at $769 and has now entered a constructive correction phase. This is not a structural breakdown; it looks like a healthy consolidation designed to build energy for the next leg higher.
We are not betting on direction.
We are waiting for price to confirm its next intent.
There are two distinct tactical windows I am watching for a high-probability long entry.
📌 The Two Entry Scenarios:
🟢 Scenario 1: Pullback & Price Action Confirmation.
Wait for the price to rotate down into the green support zone at 708.00. Here, we are not buying the level blindly. We are looking for a confirmed candle rejection on the 4H timeframe—such as a bullish engulfing pattern, a long lower wick, or a structural shift (MSS) off this zone. This provides a low-risk entry with tight invalidation.
🟢 Scenario 2: Breakout of the ATH.
If the market does not pull back and instead chooses to push through the major ATH level at 769.00 ( the 16 April high ), we wait for a clean candle close above it.
A subsequent retest of this broken level as support would confirm the breakout. This is our trigger for the larger macro move.
📊 Trade Management & Invaildation:
The invalidation for this entire bullish thesis is strictly set at 684.0. If the price breaks down below this level with conviction, the structural setup is completely void, and we stand aside.
Once the position is active, our primary directional target is set at 850.0. As always, we will re-evaluate and update the target as the market structure evolves.
💡 Execution Mindset:
No FOMO. No guessing. We do not chase the ATH, and we do not catch the falling knife blindly. We let the 4H timeframe provide the confirmation—whether on a pullback or a breakout—and we react accordingly.
⚠️ Risk Warning:
This analysis is for educational purposes only and does not constitute financial advice. QQQ is a high-capitalization ETF heavily correlated with the broader Nasdaq-100 tech sector. Always manage your position sizing strictly according to your personal risk tolerance, respect your invalidation level without hesitation, and never risk capital you are not fully prepared to lose. Long 
Long 
XAR BREAKS TO A NEW ALL-TIME HIGH — Is Aerospace & Defense Start
AMEX:XAR just closed at $296.73, after reaching $297.79, pushing through its previous all-time-high area.
But the ATH is only part of the story.
TECHNICAL PICTURE
On the weekly chart, XAR appears to have completed a large inverse Head & Shoulders formation.
The structure is interesting:
Left shoulder formed during the first part of 2026.
The deeper correction created the head.
Buyers stepped back in around the rising long-term trend.
The right shoulder held substantially above the major 2025 lows.
Price has now broken the ~$290–295 neckline / previous ATH zone.
That means two important technical events are happening together:
1. Breakout from a multi-month bullish reversal/continuation structure.
2. Breakout into price discovery above the previous ATH.
If the breakout holds, the chart opens potential upside zones around $320, $327 and eventually the $340–350 area based on the projection shown on the chart.
The level I would watch most closely now is not $320.
It is $290–295.
A successful retest of the old resistance as new support would make the breakout considerably more convincing. A weekly move back below that area would raise the possibility of a failed breakout.
FUNDAMENTALS ARE SUPPORTING THE CHART
XAR isn't a single defense contractor. It tracks a modified equal-weighted basket of U.S. aerospace and defense companies, which spreads exposure across the industry rather than allowing a few mega-cap names to dominate the ETF.
And the spending backdrop remains unusually strong.
At the 2025 Hague Summit, NATO members committed to moving toward 5% of GDP in defense and defense-related investment by 2035, including at least 3.5% for core defense requirements. European Allies and Canada had already increased combined defense expenditure by nearly 20% in real terms in 2025.
Meanwhile, S&P Global's 2026 aerospace & defense outlook describes strong commercial and defense demand, with suppliers increasing production to meet demand. It also points to the proposed U.S. 2027 defense budget of nearly $1.5 trillion, although the final enacted amount remains uncertain.
So this isn't simply a technical breakout occurring in isolation.
Price is breaking out while the industry's underlying demand cycle remains strong.
THE RISK
New ATH breakouts can also become crowded very quickly.
Supply-chain constraints remain an issue for aerospace manufacturers, higher production requires more capital, and future defense spending still depends on political and budget decisions.
So chasing a vertical move is very different from seeing the breakout confirmed.
For me, $290–295 is now the battlefield.
Above it → price discovery remains intact.
Below it → the breakout deserves another look.
What would you do here?
🟢 Buy the ATH breakout ?
🔵 Wait for a $290–295 retest ?
🔴 Too extended — stay away ?
I’m curious to see how traders are reading this one.
 Long
Long
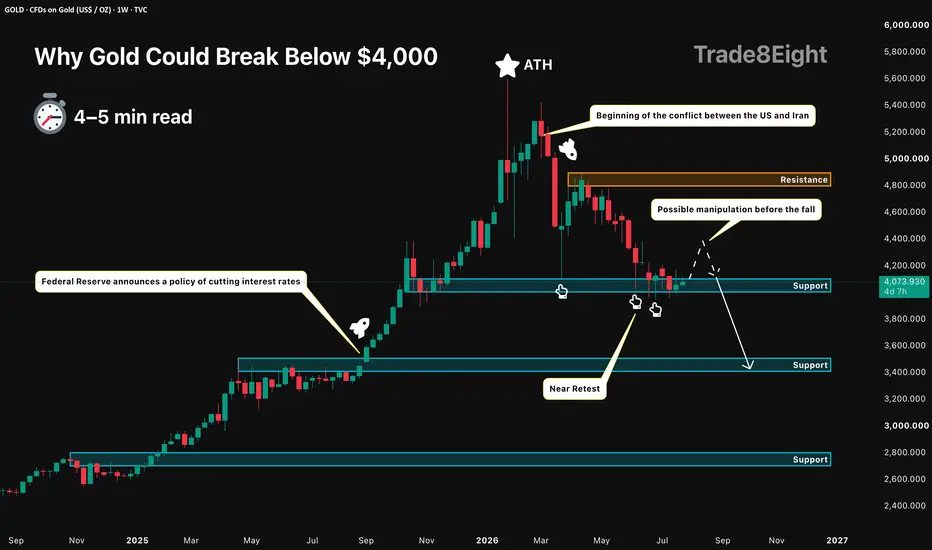
Why Gold Could Break Below $4,000Gold is sitting on the level that now separates consolidation from a much deeper correction. On the weekly chart, price is testing the marked support around $4,000 after failing to sustain its recovery below the major resistance zone near $4,800.
The first pressure point is the US dollar. During ordinary risk-off periods, gold may benefit from defensive demand. But when risk reduction becomes a broader liquidity event, investors often sell positions across multiple markets and move into dollar cash. A renewed dollar bid would make gold more expensive for non-US buyers and could place additional pressure on investment demand.
The second factor is the changing interest-rate outlook. CME FedWatch currently implies roughly a 79% probability of a Federal Reserve rate increase in September. Higher policy-rate expectations tend to support the dollar and push nominal and real yields higher. Since gold produces no yield, its relative attractiveness declines as the return available from cash and government bonds increases.
Investment flows are already showing signs of pressure. Physically backed gold ETFs recorded $8.9 billion of outflows in June, while total holdings declined by 74 tonnes. North American funds experienced the largest withdrawals. Global flows remained positive over the full first half of the year, so this is not evidence of a complete structural exit from gold, but it does show that marginal Western demand has weakened as expectations for tighter monetary policy have increased.
There is also no clear physical shortage forcing the market higher. Total gold supply increased by 2% year over year in the first quarter. Mine production reached a record first-quarter level of almost 885 tonnes, while recycling rose by 5%. Industrial and technology demand remains strategically important, especially for electronics and AI infrastructure, but at 82 tonnes it is still relatively small compared with investment, jewellery and central-bank demand.
The technical structure brings these fundamental pressures together. Since March, gold has repeatedly returned to the same support area without producing a sustainable recovery. Price is now forming lower highs while spending more time close to the lower boundary. This resembles bearish compression rather than a strong rejection from support.
A temporary move higher is still possible. The chart allows for a short squeeze or a false recovery before sellers regain control. However, repeated Near Retests can gradually absorb the resting demand protecting a level. If buyers cannot create meaningful distance from $4,000, another test becomes more likely, and each new test may leave the support increasingly vulnerable.
🎓 The logic behind this market view is explained in more detail in my education material, which can be found in Related publications : “Near and Far Retests: What Every Trader Should Know”
If this post was useful, feel free to boost 🚀 it and share your view in the comments 💬
⚠️ Disclaimer: This is a public market view based on current analysis; market conditions and price direction are subject to change based on news factors and volatility. This is not financial advice. Please do your own research and manage your risk.  Short
Short
 Long
Long
 Long
Long
ARKK ETF: Trapped in a Pinning Regime? Title: ARKK ETF: Trapped in a Pinning Regime? Quant & Technical Deep Dive 📉🤖
🧠 Fundamental Overview:
The ARK Innovation ETF (ARKK), managed by Cathie Wood, is a fund focused on disruptive innovation characterized by a high-risk/high-volatility profile and a long-term approach.
The current price hovers around $75 - $76.
Year-to-date, the fund has registered a moderate return of ~7.38% (significantly underperforming traditional indices), with a 1-year cumulative return of approximately 5.43%.
Additionally, it carries a relatively high expense ratio of around 0.75% annually, a steep management cost compared to traditional index funds like the S&P 500.
📊 Technical Breakdown (1D Timeframe):
Looking at the daily chart, ARKK experienced a massive 30% profit-taking wave starting last October, plummeting from roughly $92 down to $63. This descent closely tracked a uniform Elliott Wave sequence. However, near the start of Wave 3 (around December/January), the price carved out a classic double-top pattern. This exact zone acted as a fierce resistance block later in July, establishing it as a heavy supply area to watch in the short-to-medium term.
Currently, price is trapped in a tight lateral consolidation zone. In late July and early August, we witnessed a textbook "Bear Trap"—the price temporarily broke below the zone's support, but selling volume completely failed to follow through. Furthermore, since entering this indecision phase, both the MACD and RSI have been flashing clear bearish divergences, printing lower highs on the oscillators while the price attempted higher upward impulses.
🤖 Quantitative & Options Analysis:
Our algorithmic indicators deliver a clear message: ARKK is locked in a tight, low-volatility consolidation phase.
Gamma Exposure (GEX) Heatmaps: The GEX engine identifies a distinct "Pinning Regime" with heavy positive gamma resting at the $77.67 Call Wall. This means market makers are actively hedging in a way that suppresses large price swings, pinning the asset near current levels.
Dynamic Monte Carlo Projections: The forecasting model perfectly corroborates the options data, predicting a near-flat 20-day median target of $77.84 with a slight negative drift and a conservative 47.1% upside probability.
🎯 Conclusion & Strategy:
Both classical technicals and algorithmic models mathematically confirm that you should avoid breakout strategies right now. The optimal approach in this environment is to favor mean-reversion trading or collect options premium while the price chops sideways.
⚠️ Disclaimer: This analysis is strictly for educational purposes and is intended solely to intellectually enrich our trading community. It is NOT financial or investment advice. Always execute your own research and manage your risk accordingly.