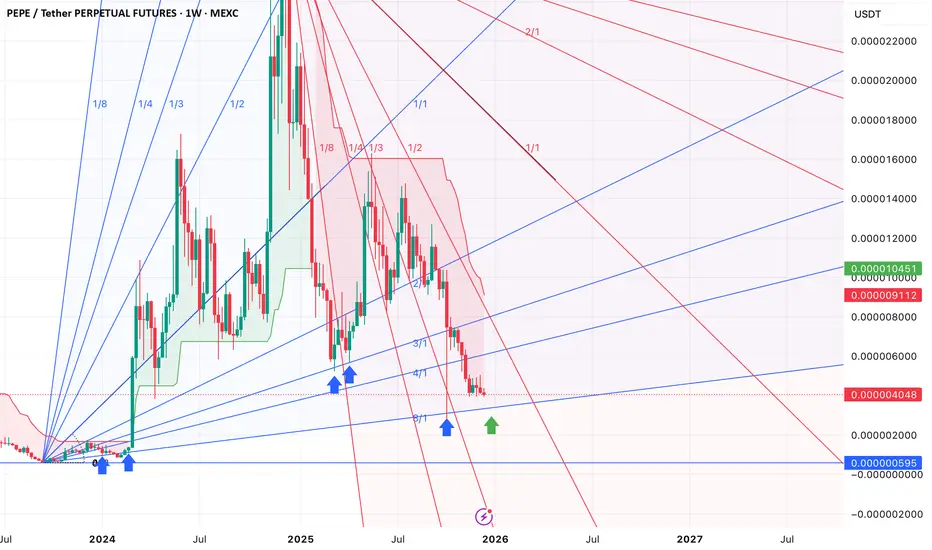
Gann time and price HBR The swing high is at 333.8. Price then fell to the swing low at 144 in 332 days. You can see the symmetry in price and time.
I have marked the square up on the chart back at 333.8 in 335 days.
Price has a lot of work to do in next 90/100 days. This falls in line with ganns idea of price acceleration in the last phase of swing.
The company has recently been on a purchasing spree to expand its reach into the gulf of America.
They have also been buying back shares.
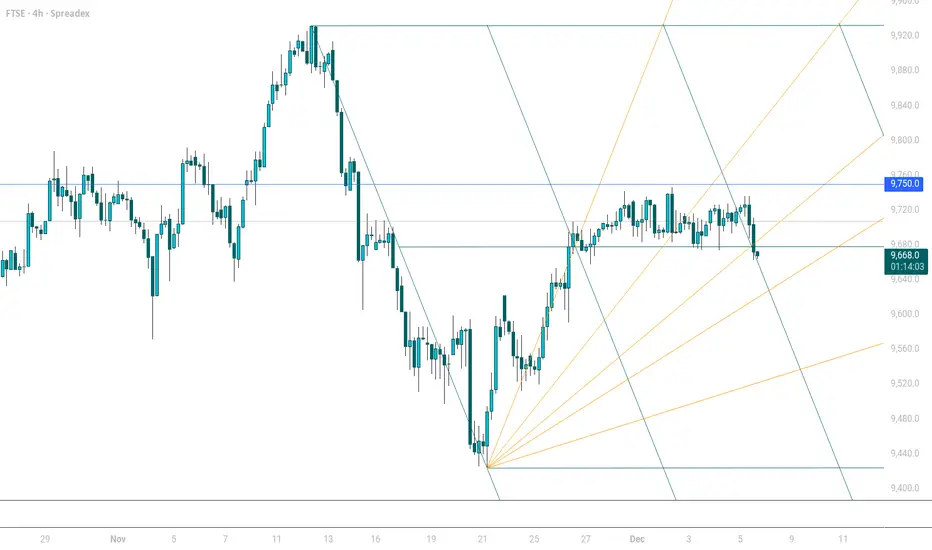
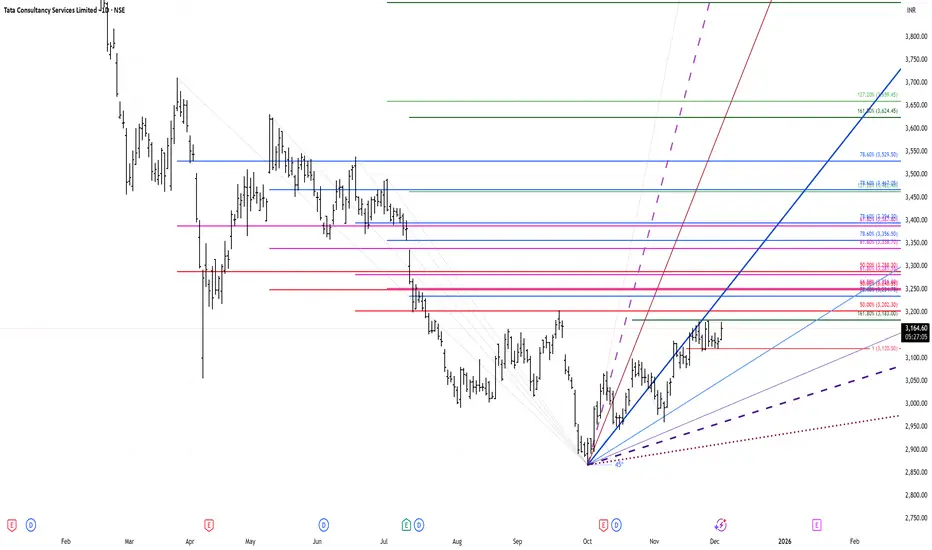
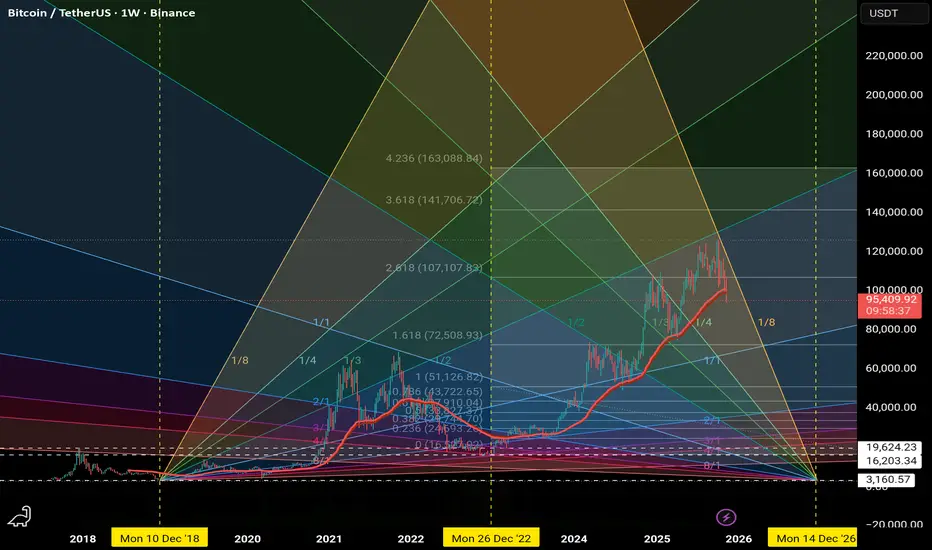
Gann Fan
EURJPY bearish expectations from here
OANDA:EURJPY we can see BEARISH ENGULFING candle, after bearish engulfing looks like coming descending triangle. We are have constant bullish trend here long period and here after todays events expecting to see point of revers.
SUP zone: 182.500
RES zone: 180.300, 178.900
Elloit wave ETH 12/15/2025ETH has been forming a complex correction recently, which could represent either a larger wave (II) or a minor wave 4 within wave (I). This corrective structure is difficult to count precisely; however, as time passes, it appears that the correction has not yet finished.
The recent downward pressure likely marks the end of wave (b) within the Ⓨ wave. This view is further supported by Gann resistance, leading me to expect that the correction may complete around the 3,450–3,500 level.
PLAN THE TRADE. TRADE THE PLAN. IT'S THIS SIMPLE !📅 Q4 | W50 | D8 | Y25 |
📊 EURGBP FRGNT FULL TRADE BREAKDOWN - TAKE PROFIT + 2%
🔍 Analysis Approach:
I’m applying Smart Money Concepts, focusing on:
Identifying Points of Interest on the Higher Time Frames (HTFs) 🕰️
Using those POIs to define a clear trading range 📐
Refining those zones on Lower Time Frames (LTFs) 🔎
Waiting for a Break of Structure (BoS) for confirmation ✅
This method allows me to stay precise, disciplined, and aligned with the market narrative, rather than chasing price.
💡 My
EURUSD FRGNT Daily Forecast -Q4 | W47| D18 | Y25 |📅 Q4 | W47| D18 | Y25 |
📊 EURUSD FRGNT Daily Forecast
🔍 Analysis Approach:
I’m applying Smart Money Concepts, focusing on:
Identifying Points of Interest on the Higher Time Frames (HTFs) 🕰️
Using those POIs to define a clear trading range 📐
Refining those zones on Lower Time Frames (LTFs) 🔎
Waiting for a Break of Structure (BoS) for confirmation ✅
This method allows me to stay precise, disciplined, and aligned with the market narrative, rather than chasing price.
💡 My Motto:
"Capital managem
Key Gold Reversal Times for Daily Trading“Time-based analysis focuses on identifying the specific times when the market is likely to reverse or show strong movement. Instead of analyzing only price levels, it studies cycles, timing patterns, and repetitive market behaviors to predict when major or minor turning points may occur.”
BTC.D May not TOP until next September!Despite alt/BTC pairs looking battered
**Capitulation is likely not complete**
Most Altcoins remain in downtrends v BTC
Timeline:
2025: grind to 63-65%
2026 Final Push to 73%?
Altcoins to seek relief once this finally turns around.
You may be able to start DCA'ing BTC as early as next March in preparation to buy beaten down quality Alts...
focusing on ETH, SOL, and 2's that have usage... not simply clogging up the landscape of empty chains.
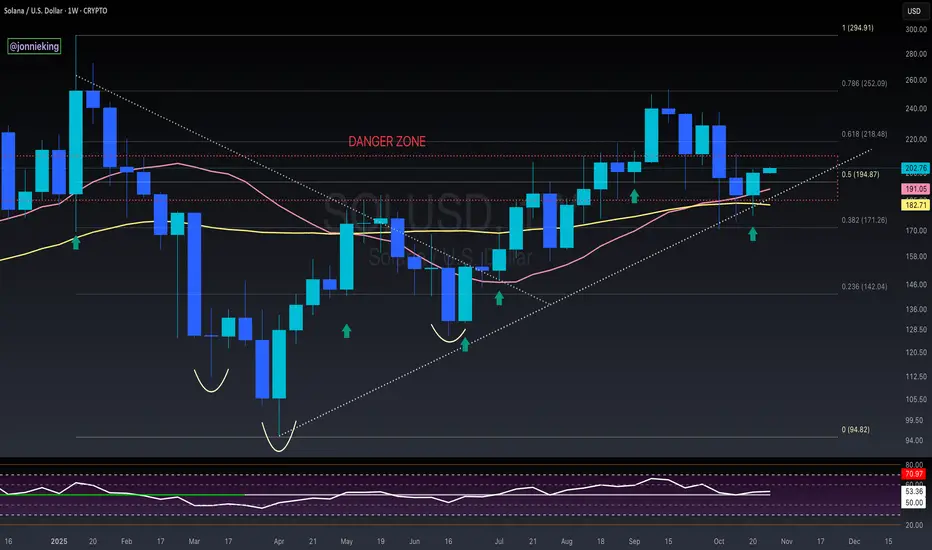
$SOL Bullish Engulfing Weekly CloseSolana is looking good here 👍🏽
Reclaimed the 50WMA and closed above the 50% Gann Level.
Note the Bullish Engulfing candle for the Weekly Close.
However CRYPTOCAP:SOL Still trading within the DANGER ZONE ⚠️
Need these next couple weeks to close outside of this POI.
You can see the Liberation Day lower trendline still remains intact for support and we had the Bullish Cross a few weeks ago on the 20 / 50 WMA 🤓
Salik Stock Reversal Alert-A Hidden Gem in Dubai’s Stock Market!Hello Traders!
Today’s analysis is on Salik Company PJSC (DFM), one of Dubai’s most watched stocks. UAE markets are full of hidden opportunities, and this chart highlights one of them. After forming a strong Rectangle Pattern for months, the stock finally gave a clean Breakout , followed by a Bullish Engulfing retest candle , a classic sign of buyers returning with strength.
Why this setup is special?
Rectangle pattern breakout after long consolidation shows trend resumption potential.
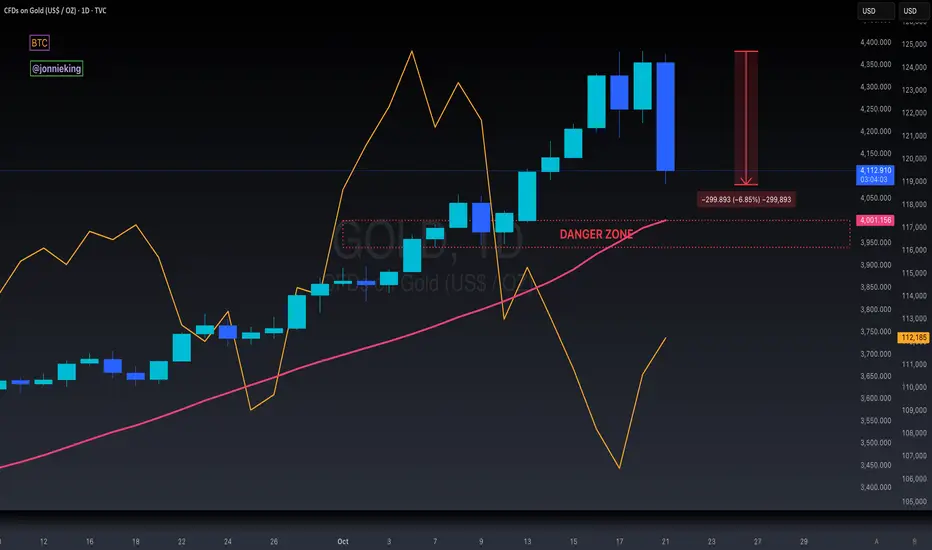
$GOLD Bearish Engulfing on Daily - Rotation to $BTC Incoming!MASSIVE BEARISH ENGULFING FORMING ON THE TVC:GOLD DAILY CHART.
Down ~7% just on the day alone.
~$2 TRILLION has been wiped out on its market cap,
the equivalent of Bitcoin’s entire MC.
We can see the rotation into CRYPTOCAP:BTC in real-time here.
If GOLD Closes below the DANGER ZONE,
it’s game-over for everyone’s favorite pet rock 🪙
Ep. 4 - BTC Prediction By Channels, Secret Fib & Unique Gann FanBitcoin Price Prediction Using Channels, Fibonacci & Gann Fan | Signal & Structure Episode 4
In this concise yet powerful episode, we combine three advanced technical analysis tools to identify high-probability support zones for Bitcoin's current correction. This multi-confluence approach demonstrates how stacked logarithmic channels, Fibonacci retracements, and Gann fans work together to pinpoint critical price levels.
Techniques Demonstrated:
1. Channel Validation Theory
- Proves that any t
ETH Elliott wave analysis 13/10 /2025In my view, ETH has not yet completed its upside cycle, and the recent decline is simply part of wave (c) within wave (IV).
I believe we are currently in wave (5), specifically within wave 3 of that structure. The reason is that if waves 1 and 3 were corrective ABC structures, then wave C should not exceed 138.2% of wave A, otherwise it would invalidate the b-failure flat pattern—and this limit has already been exceeded, confirming the impulsive nature of the current move.
The Shark harmonic p
Continuation of the previous idea based on the Harmonious EnergyThe consolidation phase is coming to an end. The market structure is gradually moving into the next stage of the energy cycle, where a new flow direction is forming.
At the moment, I am observing a continuation of the energy movement with a noticeable manifestation of buyer strength. The key focus is on price behaviour near the resistance level — this is where it will become clear whether buyers will be able to maintain control and continue the upward momentum, or whether the market will enter