Long
Long
Peter Thiel Sells Entire Stake in Eth Treasury Firm ETHZillaBillionaire investor Peter Thiel and affiliated Founders Fund entities have fully exited their position in Ethereum treasury firm ETHZilla, according to a 13G filing with the US Securities and Exchange Commission.
The filing shows zero ownership in the company as of Dec. 31, 2025, down from a 7.5% stake disclosed in August 2025. The move marks a full reversal of what was once seen as a major institutional endorsement of corporate Ethereum treasury strategies.
Thiel’s investment was initially revealed when ETHZilla rebranded from biotech company 180 Life Sciences and shifted to a digital asset treasury model. The disclosure pushed the stock up more than 90% in a single trading session at the time.
Following news of the full exit, ETHZilla shares fell nearly 7% in premarket trading to around $3.20. The stock now trades roughly 97% below its peak of over $107 reached last August.
ETHZilla Cuts Ether Holdings and Changes Strategy
ETHZilla launched its Ethereum treasury strategy on Aug. 18, 2025, after raising $565 million from more than 60 investors, including Electric Capital, Polychain Capital, and GSR.
The company aimed to become an Ethereum-focused accumulation vehicle that would hold ETH and generate yield through staking. At its peak, the company held more than 100,000 Ether.
However, the firm began reducing its holdings as market conditions weakened and debt obligations increased. In October, ETHZilla sold about $40 million worth of Ether to fund a $250 million stock repurchase program.
In December, the company sold an additional 24,291 ETH valued at $74.5 million to redeem senior secured convertible notes.
The company currently holds 69,802 ETH, valued at roughly $139 million to $140 million at current market prices. The position ranks ETHZilla as the sixth-largest corporate holder of Ethereum.
The firm said its future value will be driven by revenue and cash flow from real-world asset tokenization rather than direct crypto accumulation.
Pivot Toward Tokenization and New Revenue Streams
ETHZilla has shifted its focus toward tokenization initiatives. On Feb. 5, the company acquired a portfolio of 95 manufactured and modular home loans for about $4.7 million, which it plans to tokenize on an Ethereum Layer 2 network with an expected annualized yield of 10.36%.
The firm also purchased two CFM56-7B24 aircraft engines for tokenization through the Liquidity.io platform, an SEC-regulated alternative trading system. It recently launched a tokenized aviation product offering equity exposure to leased jet engines.
 Short
Short
Harvard Among Top 20 Holders of iShares Bitcoin TrustHarvard University has made a striking move in its investment strategy. The university’s endowment now holds a bigger position in Bitcoin ETFs than in any individual stock. Specifically, Harvard tripled its stake in the iShares Bitcoin Trust ( NASDAQ:IBIT ), making it the largest publicly disclosed U.S. equity holding for the endowment.Harvard University’s Bitcoin ETFs Outweigh Traditional Stocks
According to recent SEC filings, Harvard now holds approximately $442.8 million in Bitcoin ETFs. By comparison, the university’s position in Alphabet Inc. stock is around $114 million. Harvard also holds $235.1 million in SPDR Gold Trust ( AMEX:GLD ). These figures show that Bitcoin is now taking a key role in one of the world’s most prestigious endowment portfolios.
The endowment owns 6.8 million shares of NASDAQ:IBIT , which places Harvard among the top 20 largest investors in the fund. This move signals that institutional investors are increasingly willing to treat Bitcoin as a core component of diversified portfolios.
Broader Institutional Bitcoin Adoption
Harvard is not alone in this trend. Other university endowments, such as Brown and Emory, have also started adding Bitcoin-related investments to their holdings. These actions suggest that even traditionally conservative investors are becoming more comfortable with digital assets.
By expanding its Bitcoin ETF stake, Harvard is demonstrating confidence in the long-term potential of cryptocurrency. It also reflects a shift in thinking, where digital assets are viewed as part of a balanced investment strategy alongside traditional equities and commodities like gold.
Implications for Investors
This disclosure may influence other institutional and individual investors. If Harvard and similar endowments continue to increase crypto exposure, more conservative investors might feel encouraged to explore Bitcoin and related ETFs. Additionally, the move highlights how ETFs can provide a regulated, transparent way to invest in digital assets without directly holding cryptocurrencies.
Finally, Harvard’s strategy underscores the growing role of cryptocurrency in mainstream finance. Bitcoin ETFs are now not just speculative instruments but significant tools for portfolio diversification. As more institutions adopt crypto, the trend may continue to reshape investment strategies worldwide.  Short
Short
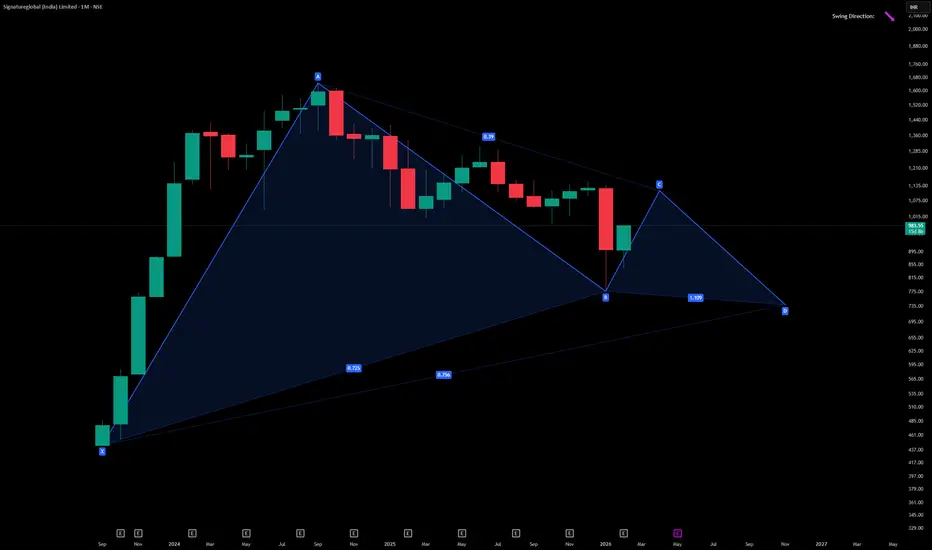
SIGNATURE GLOBALSignature Global (India) Ltd is a mid‑cap real estate developer incorporated in 2014. It focuses on affordable and mid‑segment housing projects, primarily in Gurugram and the Delhi NCR region, and has steadily expanded into plotted developments, commercial spaces, and lifestyle communities.
Promoter: The founding team continues to lead the company, positioning Signature Global as a trusted brand in affordable housing with government policy tailwinds.
FY22–FY25 Snapshot
Sales – ₹2,420 Cr → ₹2,890 Cr → ₹3,310 Cr → ₹3,780 Cr
Net Profit – ₹165 Cr → ₹210 Cr → ₹245 Cr → ₹285 Cr
Operating Performance – Moderate → Strong → Very Strong → Excellent
Dividend Yield – Nil (company reinvests earnings into growth)
Equity Capital – ₹146 Cr (post‑IPO listing in FY23)
Total Debt – ₹1,020 Cr → ₹940 Cr → ₹880 Cr → ₹810 Cr (steady deleveraging)
Fixed Assets – ₹1,850 Cr → ₹1,910 Cr → ₹1,980 Cr → ₹2,050 Cr
EPS – ₹11.3 → ₹13.5 → ₹15.8 → ₹18.4
Institutional Interest & Ownership Trends
Promoter holding: ~69%, reflecting strong family control.
FIIs/DIIs: Rising interest post‑IPO, with DIIs adding exposure to India’s affordable housing growth story.
Public float: ~31%, with delivery volumes showing accumulation by long‑term investors.
Strategic Moves & Innovations
Expansion in affordable housing projects under PMAY and Haryana Affordable Housing Policy.
Diversification into mid‑segment and premium plotted developments.
Focus on sustainable construction and green certifications.
Aggressive land acquisition strategy in Gurugram and NCR.
Digital transformation in sales and customer engagement.
Cash Flow & Balance Sheet Strength
Operating cash flows strengthened in FY25, supported by higher project deliveries.
Free cash flow positive, reinvested into land bank expansion and construction.
Debt reduced steadily, improving balance sheet resilience.
Strong asset base with projects across Gurugram, Sohna, and NCR.
Risk Factors
Dependence on NCR housing demand cycles.
Regulatory risks in real estate approvals and RERA compliance.
Margin sensitivity to raw material costs and construction delays.
Competition from other affordable housing developers.
Investor Takeaway
Signature Global Ltd. demonstrates steady revenue growth, margin expansion, and deleveraging, supported by its leadership in affordable housing and expansion into mid‑segment projects. With strong institutional interest post‑IPO and government policy support, it is well‑positioned for sustained growth, though investors should monitor regulatory and demand‑cycle risks.  Long
Long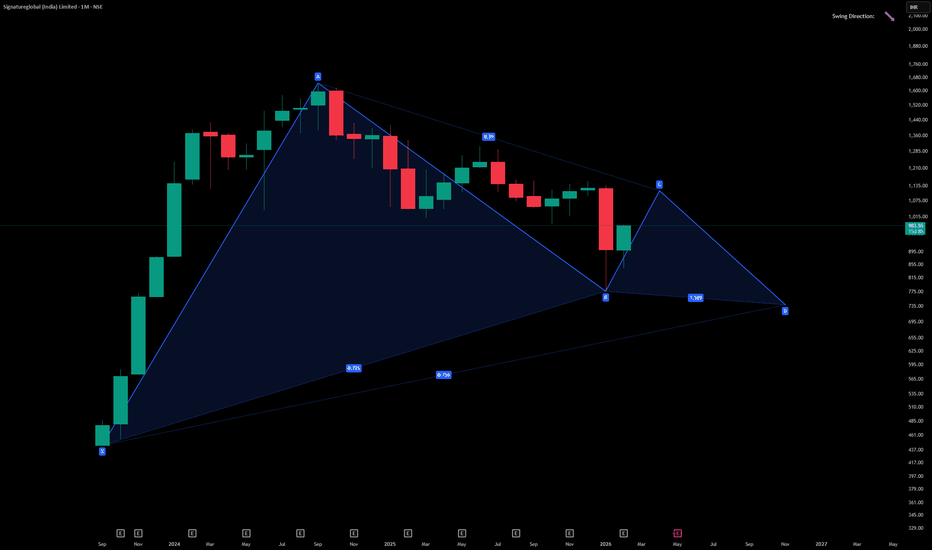
 Short
Short
 Long
Long
Bullish Gartley — Bajaj Finserv📐 Pattern Geometry & Ratios
AB = 0.683 of XA → Within Gartley range (0.618–0.786)
BC = 1.046 of AB → Acceptable retracement
CD = 1.458 of BC → Valid extension
AD extension = 1.113–1.618 of XA → Textbook completion zone
📊 Technical Context
Point D (PRZ) between ₹1,933.70 and ₹1,850.05 — strong reversal zone
Price has bounced from PRZ, now trading above ₹2,020
Moving average shows trend stabilizing post‑correction
RSI (Daily = 54.2, Weekly = 53.85) → Neutral, supportive of bullish continuation
Swing direction arrow flat, but price action suggests early bullish momentum
✅ Verdict:
Bajaj Finserv has completed a Bullish Gartley harmonic pattern, with Point D aligning near the 0.786–0.886 XA retracement zone. The bounce from ₹1,850–₹1,933 confirms the reversal.
Bias: Long positions favored above ₹1,950
Stop: Below ₹1,850 (pattern invalidation)
Target Zone: ₹2,080–₹2,150 in the short term  Long
Long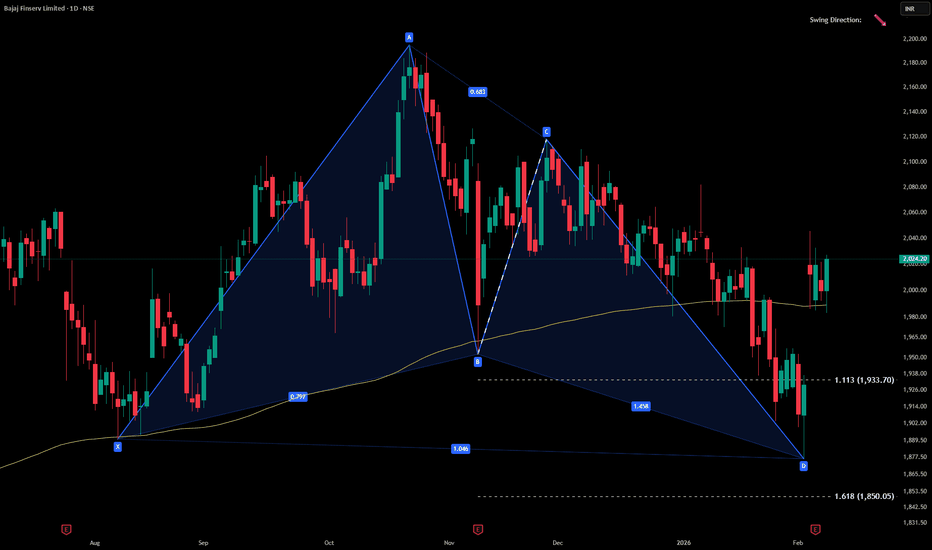
 Long
Long
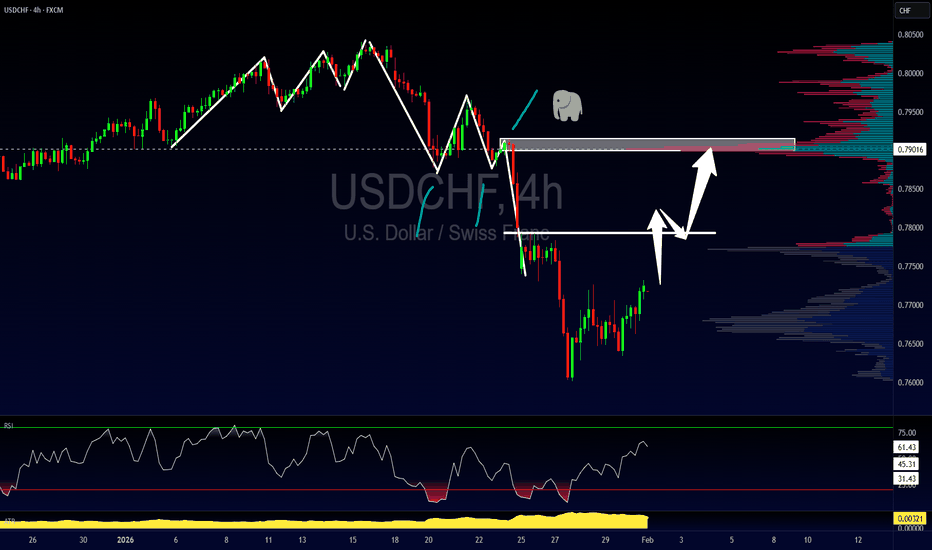
USDJPY - 4H - ShortWhen changing the structure to the Daily frame, the price left a large GAP, which is a magnet for the price. On the weekly time frame, we have several reasons for the price to fall in a downward direction, namely the presence of a Gartley pattern, as well as the creation of many equilibrium levels in a downward direction and in the range of 148-151 price levels. On the H4, we have a nice impulse candle whose Take Profit coincides perfectly with the POC zone, as well as demand at a price of 152,800. So, we can expect a downward movement in the price before continuing the target to 157,400. We expect the price to continue in a downward direction in the first days of the new week and then to head towards higher peaks up to 157 dollars per yen.
Elloit wave DXY 1/31/2026In my view, the DXY is likely to experience one final impulsive move toward the 127 level before entering a broader bearish phase. This outlook is supported by three main reasons.
1. Macro Elliott Wave Structure
From a long-term perspective, DXY completed wave Ⓐ at the end of 1992 and is currently in wave Ⓑ.
Zooming into wave Ⓑ, we can see that wave (b) retraced approximately 101%–123.6% of wave (a). As a result, this suggests that wave (c) should extend to around 101%–161.8% of wave (a) in order to complete wave Ⓑ.
2. Harmonic Confirmation (Alternate Bat Pattern)
The alternate Bat harmonic pattern further supports this view, indicating that wave (c) could reach approximately 113% of wave Ⓐ, which corresponds to a DXY level near 127, before the larger macro wave Ⓒ begins.
3. Triangle Formation in Wave (c)
In my view, wave (c) of wave Ⓑ is forming a triangle pattern. As shown on the chart, the market appears to be nearing the end of wave (D). This structure implies that a final wave (E) is still required to complete the triangle before the next major move.
Micro Perspective
On a lower time frame, when zooming into wave (D), DXY appears to be in wave c of wave (D). A bearish Gartley harmonic pattern suggests a potential 1.5% pullback.
Additionally, the micro wave count implies that one more minor wave 5 is needed to complete this structure  Long
Long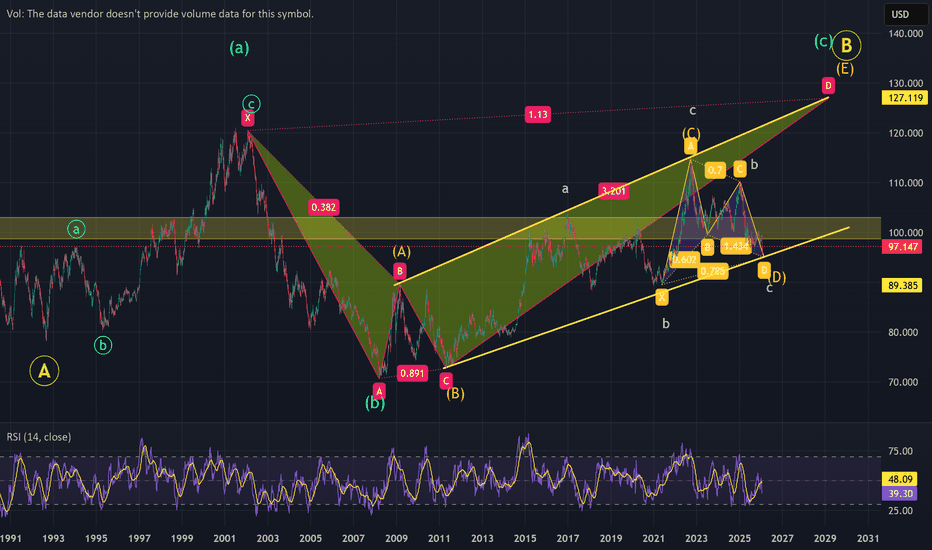
Harmonics in Godrej PropertiesThe monthly chart of Godrej Properties Ltd is currently forming a well‑defined bullish Bat harmonic pattern, indicating a potential long‑term reversal zone near ₹1,476.80. The structure follows the classic Bat geometry, with each leg aligning closely to ideal Fibonacci ratios: the AB leg retraces approximately 62.6% of the XA move, the BC leg retraces 40.3% of AB, and the CD leg extends 170.2% of BC while retracing 80.3% of XA. These ratios confirm the integrity of the Bat pattern.
Point D, where the pattern completes, coincides with the current price zone, suggesting that the stock may be entering its Potential Reversal Zone (PRZ). This area is critical for bullish confirmation. The recent sharp decline of ₹427.60 (−21.33%) has brought the price into this harmonic completion zone, making it a high‑probability setup for reversal if supported by momentum indicators and price action.
RSI readings across multiple timeframes show mixed signals: while the 30‑day and 60‑day RSIs are above 50, the daily and weekly RSIs are deeply oversold, indicating short‑term weakness but potential for recovery. The monthly RSI at 38.66 suggests the stock is approaching a long‑term support zone.
Three upside targets are projected from the PRZ:
Target 1: ₹2,958.00
Target 2: ₹3,360.80
Target 3: ₹3,873.90
These levels correspond to Fibonacci retracements and extensions of the AD leg and represent potential profit zones if the reversal plays out.
In summary, the Godrej Properties chart is signaling a potential bullish reversal through a textbook Bat pattern. The current price zone near ₹1,576.80 is the make‑or‑break level: if defended by buyers and confirmed by bullish candles and volume, the stock could begin a multi‑month uptrend toward the projected targets. If broken decisively, the pattern fails and further downside may follow. This setup offers a disciplined framework for entry, risk management, and profit booking based purely on harmonic analysis.  Long
Long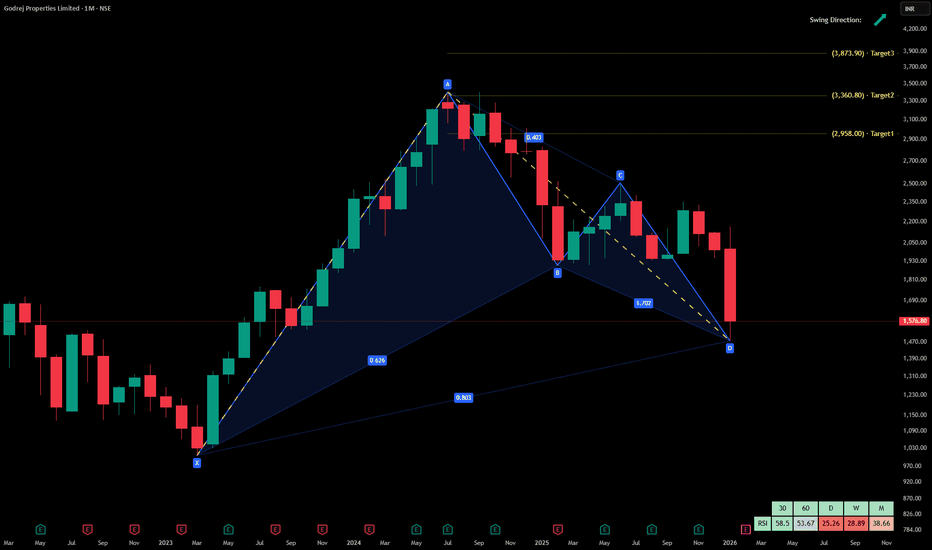
Long 
Long 
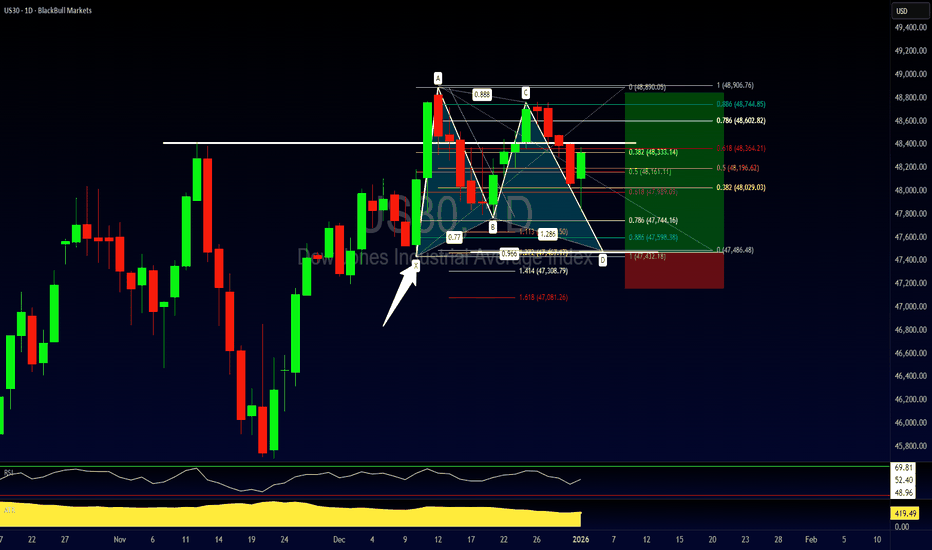
Dow Jones Trend Continuation: Advanced Pattern, Simple TradeWe’re on the Dow, and the trend is bullish. You don’t need indicators to see it—just look at price. We recently had a breaking close above the previous high, followed by consolidation. That matters, because advanced patterns tend to form during pauses in the market, not during explosive moves.
Inside this consolidation, we can map out a potential bullish Gartley pattern. Because this pattern is forming within an uptrend, it can also be used as a trend continuation setup as well.
3 Ways to Trade It
1) Trade it as a standalone Gartley
2) Trade it as a pullback in a bullish trend
3) Or combine both—partial profits on the Gartley, runners for continuation
Entries are clear, stops sit below structure, and whether you’re targeting a retest of highs or new highs, the risk-to-reward is excellent.
If you have any questions or comments please let me know & I look forward to giving you guys more videos throughout the year.
Akil Long
Long 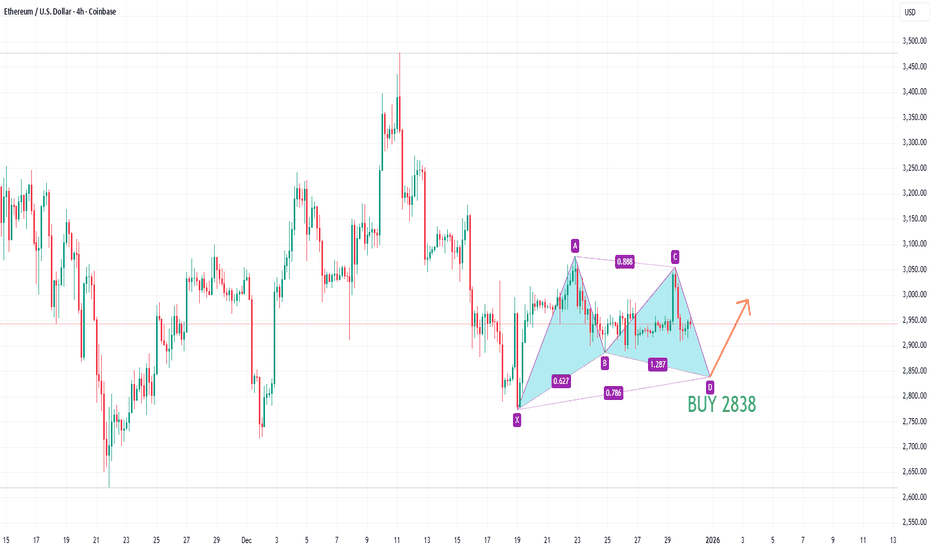
What is Harmonic XABCD Pattern and How to Identify It Easily
In the today's article, we will discuss the absolute basics of harmonic trading: I will explain to you what is harmonic ABCD pattern and how to recognize it, using fibonacci ratios.
The foundation of harmonic trading is impulse leg.
Impulse leg is a strong, directional bullish or bearish movement.
Harmonic traders perceive a price chart like a combination of impulse legs.
Here are the impulse legs on AUDUSD on a daily time frame. All these impulses are significant bullish or bearish movements.
In harmonic pattern trading, the impulse leg will also be called the XA leg.
XABCD pattern is based on 4 consequent price movements.
XA leg will be a fundamental component of each harmonic XABCD pattern and the first price movement within the pattern.
The direction of the XA leg will determine the bias of the pattern:
Bullish XA will be a foundation of a bullish harmonic pattern,
while, a bearish XA leg will be a foundation for a bearish harmonic pattern.
Above, the examples of a bullish and bearish impulse legs.
After identification of XA leg, a harmonic trader should analyse a consequent price action.
AB leg will be the next movement after a completion of XA leg.
BC leg will be the movement after a completion of AB leg.
CD leg will be the movement after a completion of BC leg.
CD leg will be a completion point of a harmonic pattern.
In a bullish harmonic pattern, a bullish movement will be anticipated from D point.
Above is a structure of a bearish harmonic XABCD pattern.
There are a lot of different types of harmonic XABCD patterns: bullish/bearish Gartley, Bat, Cypher, etc...
The type of the pattern will depend on the fibonacci ratios of B, C, D points of the pattern.
B, C, D points should have very specific ratios to make a pattern harmonic.
First, a harmonic trader should measure the fibonacci retracement level of B point in XA leg.
In the example below, B point is lying between 618 and 786 retracements of XA leg.
Then, if a C point is lying beyond the range of the XA impulse, one should measure its fibonacci extension level.
If a C is lying within XA, its retracement level should be measured.
Below, we can see that C point of the pattern is lying between 618 and 786 retracements of AB.
Depending on the type of the pattern, a D point will either be based on a certain fibonacci retracement of XA leg or extension of AB leg.
In our example, the criteria for a bullish harmonic Gartley pattern are met.
The completion point of the pattern - D point will be based on 786 retracement of XA leg.
From that retracement level, a bullish movement will be anticipated.
Your task as a harmonic trader is to learn the specific rations of each harmonic pattern. With experience, you will learn to identify impulse legs and trade them profitable.
❤️Please, support my work with like, thank you!❤️
I am part of Trade Nation's Influencer program and receive a monthly fee for using their TradingView charts in my analysis.
 Education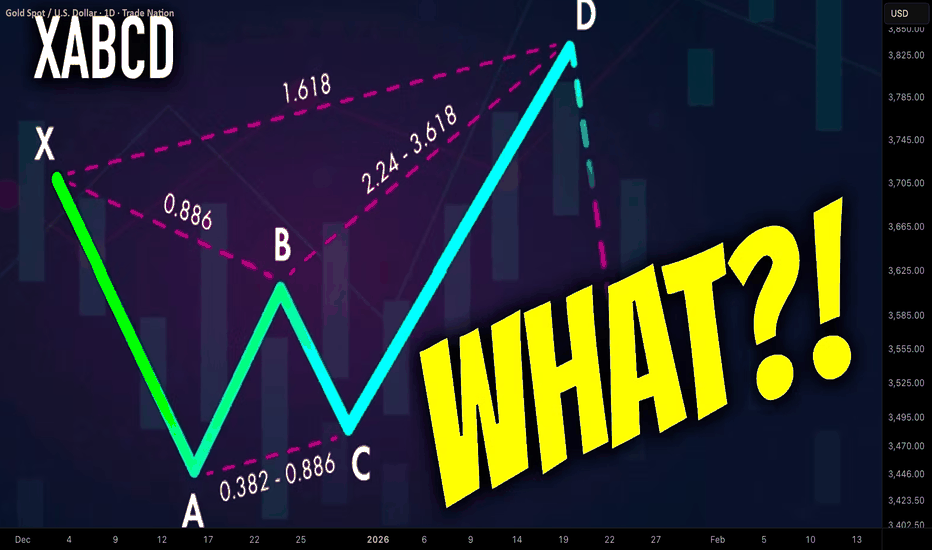

 Long
Long