Short
Short
Long 
MESM June 10: Bearish below neckline, gap retest possibleMESM analysis for Wednesday, June 10
MESM already broke the neckline, and that keeps the broader structure bearish for me. Price is trading around 7326, and I think the market may still have downside pressure unless buyers can reclaim key levels.
On the 4H chart, I’m watching the fair value gap inside the green zone as a possible bounce area. Price may retest that zone before deciding whether to continue lower.
The key bearish invalidation level for me is 7492. If we get a 4H close above yesterday’s high, then I think the tone may shift from bearish back to bullish.
On the downside, I’m watching 7247 as the first key downside target, with 7200 as a broader bearish objective later this week if weakness continues.
On the 1H chart, the fair value gap / cluster zone starts around 7406, which makes that a major reaction level for today.
On the 15M chart, I’m still watching 7400 as the key reclaim area and 7247 as the key downside target.
Key levels
7400 / 7406 = reclaim area / gap reaction zone
7247 = downside target / yesterday low
7492 = bearish invalidation on 4H
7200 = broader downside objective
Green zone = fair value gap retest area
Plan for today
Respect bearish structure after neckline break
Watch for bounce into the gap first
If price reclaims 7400–7406, watch for continuation into the green zone
If price stays weak, watch 7247 next
If 4H closes above 7492, reassess bearish bias
Not financial advice. No confirmation, no trade. CME_MINI:MESM2026  Short
Short
Pidilite Industries – Weekly Inverse Head & Shoulders Setup🎯 Pidilite Industries – Weekly Inverse Head & Shoulders Setup
📊 CMP: ₹1,518
🛑 Stop Loss: ₹1,427
🎯 Targets: ₹1,572 | ₹1,617 | ₹1,685 | ₹1,766
Technical View
Pidilite Industries is showing a potential Inverse Head & Shoulders formation on the weekly chart, indicating a possible medium-to-long-term trend reversal.
Adding further strength to the setup, the right shoulder is developing within a box consolidation pattern, creating a classic "pattern within a pattern" structure. Such formations often lead to strong directional moves once the breakout occurs.
A sustained breakout and close above ₹1,530 can confirm the bullish setup and may trigger a fresh upside rally toward the mentioned targets.
Key Observations
✅ Weekly Inverse Head & Shoulders under formation
✅ Right Shoulder forming a box consolidation
✅ Pattern within pattern setup
✅ Breakout trigger above ₹1,530
✅ Favorable risk-reward for positional traders
✅ Positive global market environment can support the move
Trading Strategy
Accumulate only on confirmation above ₹1,530.
Maintain a strict stop loss at ₹1,427.
Follow proper position sizing and risk management.
Be patient and allow the pattern to play out over time.
A sustained breakout above the neckline can unlock significant upside potential in the coming weeks.
⚠️ Clarification:
This is an independent analysis based purely on technical and market study. No part of Religare is involved in this view or recommendation.
📝 Important:
I am not responsible for any loss or profit incurred. I am not taking any fees for these views – just sharing my analysis for educational and informational purposes.
📉 Disclaimer: Not SEBI-registered. Please do your own research or consult a financial advisor before taking any investment decision.  Long
Long
 Long
Long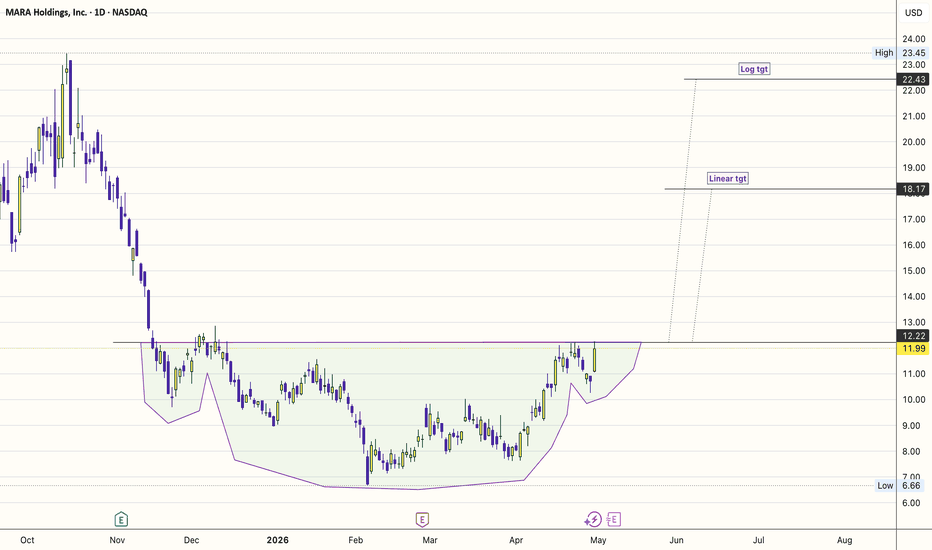
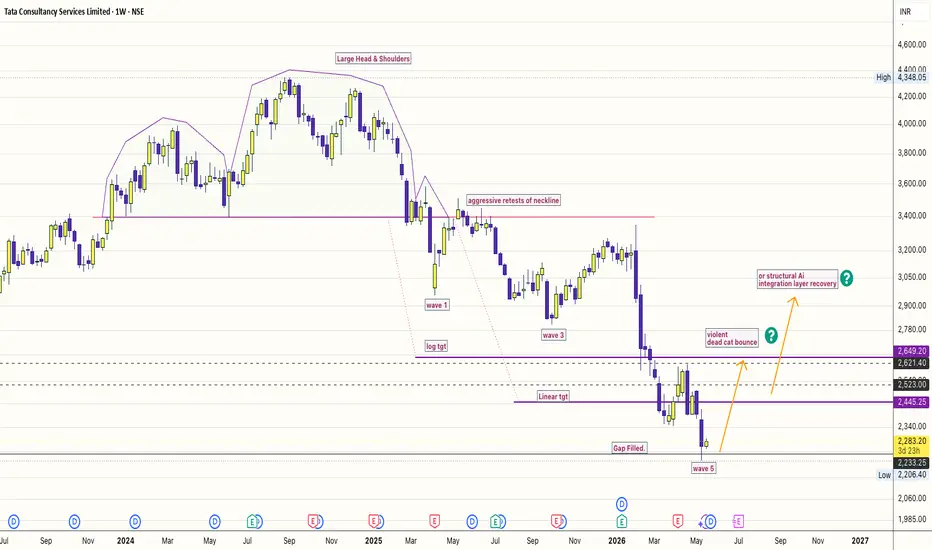
TCS & The AI Integration Layer: Global Token Cost Arbitrage.💻 💻 💻
🎯 The Macro Catalyst: The Cost of a Token & Nvidia’s Shadow
With Nvidia reporting its highly anticipated Q1 earnings this Wednesday, the entire global market is hyper-focused on the AI Infrastructure Layer (Hardware, GPUs, and Hyperscaler compute).
However, smart capital is starting to ask a critical question: Once the hardware is built, who actually implements it for global enterprises?
Building and querying raw frontier LLMs has hit an operational budget wall due to the immense energy and token costs.
Global Fortune 500 companies cannot simply plug a raw model into their legacy enterprise data—the token consumption is too expensive, and hallucinations introduce critical compliance risks.
Enter the AI Integration Layer.
🛡️ The Macro Thesis: Why Indian IT Could win the Next Phase of AI
Enterprise AI is not a software product problem; it is an integration, engineering, and data-cleansing problem.
The Integration Runway: To make AI cost-effective, enterprises must prune models, deploy specialised open-source architectures, build customised vector databases (RAG), and clean messy legacy data.
The Scale Advantage: Tata Consultancy Services (TCS) sits at the epicenter of this shift.
Instead of burning capital trying to build competing hardware or proprietary foundation models, TCS has rapidly up-skilled over 350,000 engineers to become the global army of AI implementation specialists.
Sticky Enterprise Moat: The complex operational cost of data and tokens ensures that automated software cannot easily displace human implementation teams yet.
This gives TCS a massive, multi-year revenue runway to act as the primary tollbooth for real-world corporate AI deployments.
📊
The Moving Average Engine: The underlying trend structure remains firmly bullish, coiling tightly right before a potential massive volatility injection from the upcoming global tech tape catalyst on Thursday.
The Target Framework:
Target 1 (Immediate Resistance Node): ₹2,306
Target 2 (Mid-Channel Cluster): ₹2,344
Target 3 (Structural Cycle High): ₹2,414
⚙️ Risk Management & Execution Strategy
To exploit this structural narrative with strict mathematical risk management, we use the key pivot levels defined on the chart:
The Invalidation Level: A clean daily/weekly close below the main lower support channel invalidates the immediate breakout momentum.
The Compounder Play: For derivative traders, utilising the near-the-money or slightly out-of-the-money May calls (such as the 2280, 2300, or 2320 strikes) allows for high-velocity exposure to the Thursday Mumbai opening session if the global narrative shifts violently into risk-on mode.
Disclaimer: This analysis is shared purely for educational and tracking purposes.
Options and equity trading carry significant risk.
Always size your positions appropriately to protect your trading capital.
#TCS, #NiftyIT, #AI, #Nvidia, #Breakout
 Long
Long
$ANGELONE: F&O Powerhouse Transitioning to a Wealth SupermarketWhile the casual trading crowd focuses purely on headline active user counts—crowding into platforms like #Groww—serious capital looks at unit economics, monetisation, and operating leverage.
If you are tracking the massive 2-year Inverted Head & Shoulders bottoming structure developing on the weekly chart, the fundamentals explain exactly why this coil is ready to spring.
Let's break down why Angel One (#ANGELONE) holds a fundamental edge that its purely digital peers can't easily replicate.1
. The Monetisation Moat: Volatility-Proof F&O Volume Headline client numbers are great for venture capital pitch decks, but Average Revenue Per User (ARPU) is what funds aggressive corporate compounding.
The Reality: A massive portion of competitor user bases consists of passive, low-ticket equity SIP investors who generate minimal transactional fees.
The Angel One Edge: Angel One has strategically cultivated a high-velocity user base geared heavily toward the Futures & Options (F&O) and intraday segments.
Broking drives the vast majority of their income, with F&O brokerage acting as the primary anchor.
The Dynamic: When the Nifty gets choppy or encounters regulatory speedbumps, passive investors pause. Active derivative traders, however, ramp up their volume to trade the volatility. Angel One acts as a transaction-fee sponge, generating revenue regardless of whether the weekly candle flips red or green.
2. The Structural Pivot: Cross-Selling to 37M+ Captive ClientsDoes Angel One need to be the #1 broker by pure active client count to hit our macro targets?
Absolutely not. The alpha lies in their structural transition from a transactional broker into a diversified financial supermarket.
The company is aggressively rolling out its non-broking ecosystem to capitalise on India's secular financialization wave:
Wealth Management Expansion: Angel One has built out a dedicated wealth management arm to capture High-Net-Worth Individuals (HNIs).
Asset Distribution: They are rapidly scaling the cross-selling of mutual funds, insurance, bonds, and consumer lending products across their rapidly growing base of over 37 million clients.
The Result: This shifts the company's valuation framework from a cyclical "high-beta broker" to a sticky, recurring "asset-gatherer"
model.3. "Phygital" Distribution vs. Bleeding CACPurely digital apps rely almost entirely on expensive, cyclical online ad spend to buy growth. Angel One uses a highly efficient, asset-light hybrid model.
By utilising a massive network of thousands of "Authorised Persons" (franchisees) across Tier-2, Tier-3, and deeper geographical regions, they onboard high-value clients with highly competitive Customer Acquisition Costs (CAC).
This structural distribution network takes decades to replicate.
The Technical Confluence: Look back at the weekly chart structure.
The horizontal neckline resistance between 332.60 and 338.60 is the definitive battleground. The market has spent months digesting regulatory transitions and shifts in margin requirements.
As the technical micro bull flag tightens right under the macro neckline, the fundamental engine is primed to back up the breakout toward the linear target of 489.10 and the macro log target of 609.20.
Risk Management Note: Keep a close eye on the volume signatures at the neckline breakout. Real structural moves require institutional volume validation.
Friday's #RBI policy meeting delivered exactly what a macro-focused trader needs to see: stability over speed.
In the face of intense global headwinds—specifically the ongoing West Asia conflict, fluctuating energy prices, and threat of an El Niño monsoon—the MPC unanimously voted to hold the repo rate flat at 5.25% and maintained its "neutral" stance.
The headline data point that gave the market a quick pause was the slight upward revision of the FY27 inflation projection to 5.1% and a downward calibration of GDP growth to 6.6%.
However, looking past the surface numbers reveals how this policy acts as a long-term engine for the Nifty and plays directly into Angel One’s compounding playbook.
1. The Impact on Nifty: Protecting the Floor Initially, a lowered GDP forecast (6.6% from 6.9%) looks like a hindrance. But the market already knew global conditions were fluid. The real benefit to the #Nifty came from the structural financial defensive plays introduced by Governor Sanjay Malhotra: Forex and Rupee Defense: The RBI aggressively opened the taps to defend the currency by liberalising Foreign Portfolio Investment (FPI) norms for government bonds and expanding equity limits for NRIs.
The immediate 50-paise spike in the Rupee (to 95.24/$ after the policy) proves it worked.
Macro Stability Wins: By ensuring deep liquidity in the banking system and aggressively trying to cushion against global supply-side shocks, the RBI is building a hard floor under corporate India.
The index might not shoot up in a vertical line tomorrow, but it reduces the risk of an aggressive, unhedged breakdown.
2. The Impact on Angel One: The Ultimate Beneficiary? A flat interest rate environment paired with volatile, headline-driven macro data is arguably the best possible operational sandbox for a high-volume broker.
🟢 The Benefits:The Volatility Multiplier: Because the RBI explicitly called out supply-side uncertainties and geopolitical tensions, individual sectors are going to rotate rapidly.
To an active F&O trader, this constant macro headline flux is pure oxygen. It triggers continuous volume hedging, index trading, and high-frequency execution.
As long as the tape keeps moving to digest these news cycles, Angel One collects its transaction flat fees.
The Capital Inflow Funnel: The RBI's explicit goal to ease investment limits for NRIs and OCIs into domestic equities directly expands Angel One’s prospective target audience for its newly funded Wealth Management arm.
🔴 The Hindrances (The Speedbumps):Retail Growth Cap: A projected bump in food inflation or a sub-normal monsoon means the average Tier-2/Tier-3 retail investor might have slightly less discretionary income for casual market speculation.
However, since Angel One doesn't rely heavily on casual investors for the bulk of its revenue, this hit is heavily mitigated by their institutional and heavy F&O derivatives desk.
🎯 Bringing it Back to the Chart Structure
The market has spent Friday digesting the RBI's hawkish caution.
This is exactly why the stock is coiling in that tiny micro bull flag right underneath the 332.60 - 338.60 neckline.
The RBI didn't give the market an aggressive reason to crash, nor did they give an emergency rate cut to send it parabolic. Instead, they provided orderly stability.
This gives the Inverted Head & Shoulders pattern the perfect, calculated baseline it needs to build a genuine, volume-supported breakout over the neckline, rather than a fake-out pumped on hot money.
Keep your eyes on the volume bars over the next few sessions—the fundamental script is written, now the tape just needs to execute
💬 Let's Open the Tape:Markets are a battle of perspectives.
Are you positioned for the structural wealth pivot, or do you think regulatory headwinds keep the capita markets sector capped?
Drop your thoughts, targets, or counter-thesis below.
If you want to follow the compounding journey on this setup, hit the Follow button for live updates!  Long
Long
Why Is HYPE Demand Suddenly Accelerating?Hyperliquid is gaining strong attention as liquidity expands across crypto derivatives markets. Traders now track momentum more closely as btc usd volatility continues shaping overall sentiment. In this environment, HYPE coin is becoming more relevant as buyback activity strengthens ecosystem confidence. Many investors now view HYPE coin as a direct reflection of platform performance.
The rise in activity signals deeper engagement across trading pairs and perpetual markets. This shift positions Hyperliquid as more than a niche DeFi protocol. The consistent movement in btc usd also influences how traders position around HYPE coin exposure. As volatility rises, participation increases across leveraged products and trading strategies. This keeps both btc usd and HYPE coin tightly connected in market behavior.
Why Buybacks Are Drawing Heavy Market Attention
Hyperliquid is reportedly handling a large share of crypto buybacks in 2025, which changes how investors view DeFi revenue models. The growing influence of HYPE coin reflects how buybacks reduce circulating supply and build scarcity. This creates stronger support conditions during high-demand phases. Traders often compare this structure to corporate buybacks in traditional equity markets.
The broader btc usd environment also plays a major role in this cycle. When volatility increases, derivatives trading activity rises sharply. That surge directly supports higher fee generation and stronger buyback capacity. This mechanism continues to strengthen HYPE coin demand across market cycles. As trading intensity increases, buyback pressure becomes more visible and more impactful.
Hyperliquid Revenue And The Strength Behind Buybacks
Hyperliquid revenue growth now sits at the core of its expansion story. Higher trading activity generates stronger fee income, which directly supports buyback programs. This makes HYPE coin closely tied to real usage rather than speculation alone. Investors increasingly track revenue as a leading indicator of token strength.
The rising importance of btc usd trading also fuels platform activity. As traders react to volatility, they engage more with perpetual contracts and liquidity pools. This increases trading depth and strengthens ecosystem efficiency. In turn, HYPE coin benefits from consistent engagement and stronger demand cycles.
The buyback system creates a reinforcing loop between usage and value. Higher activity leads to higher revenue, which supports stronger buybacks. This reduces supply pressure on HYPE coin over time. Meanwhile, btc usd volatility ensures that trading demand remains active across different market conditions.
Why GETTEX:HYPE Is Becoming A Cycle-Focused Token
GETTEX:HYPE is now positioned at the center of Hyperliquid’s economic structure. Its performance depends heavily on HYPE coin buybacks and platform revenue growth. This creates strong alignment between user activity and token value. Many traders now treat it as a cycle-sensitive asset with strong momentum characteristics.
The influence of btc usd remains critical in this structure. Large price swings often trigger liquidity shifts across derivatives markets. This increases trading participation and improves fee generation for the platform. As a result, HYPE coin benefits indirectly from macro volatility cycles.
What Traders Are Watching Next
Market participants are now focused on whether Hyperliquid can maintain its buyback dominance. Continued revenue growth remains essential for long-term HYPE coin strength. If trading activity continues rising, buybacks may expand further across future cycles. This could reinforce stronger demand for HYPE coin over time.
Volatility in btc usd will also remain a key driver of platform activity. Higher volatility usually increases trading volume and boosts fee generation. This directly supports stronger ecosystem fundamentals for HYPE coin. Traders are therefore watching both metrics closely for directional signals.  Short
Short
Compounder or Trap? Examining $Dixon Technologies’ Growth Runway5 Bullish Insights for ATH's
IT Hardware & Laptop PLI: Dixon isn't just a smartphone assembler anymore.
Their foray into IT hardware and laptops (under the latest PLI schemes) opens up a massive total addressable market (TAM) that is significantly larger than their legacy mobile business. This is a "new leg" of growth the market hasn't fully digested.
Vertical Integration (The "Value Chain" Moat): They are aggressively moving from simple sub-assembly to "Full Box Build" manufacturing.
By doing more of the heavy lifting (PCBA to final assembly), they capture more value per unit, which structurally improves their long-term operating margins.
Non-Linear Client Acquisition: They are moving beyond simple volume assembly for one or two brands.
By locking in marquee global brands (Samsung, Xiaomi, Motorola, etc.) for multiple product categories (TVs, ACs, Washing Machines), they have created a "lock-in" effect where these brands cannot easily switch without massive disruption to their supply chain.
"Make in India" Export Hub: The goal is no longer just domestic consumption.
Dixon is increasingly positioning its facilities as an export base for Southeast Asia, Africa, and the Middle East.
If they successfully turn into a global export powerhouse, the CAGR shifts from a "domestic play" to a "global manufacturing play."
Operating Leverage on Fixed Costs: Most of Dixon's capital expenditure (Capex) has already been deployed.
As revenue scales, their incremental operating costs drop.
This creates a "hockey stick" effect on profitability—where revenue grows at 20-30%, but net profit can potentially grow even faster because the heavy lifting in infrastructure is already done.
The "New High" Reality Check
To sustain new highs, Dixon has to prove that the margin profile is expanding as they add these new, complex products.
If the revenue grows but the margins stay flat, the market will eventually cap the valuation multiple.
Dixon has carved out a textbook Inverse Head & Shoulders on the daily, signaling a transition from the accumulation phase back into trend continuation.
The Setup: The right shoulder has formed with decreasing volume, a classic sign of exhaustion in selling pressure.
The Trigger: A clean breakout above the neckline confirmed by a volume spike.
The Risk Management: The stop-loss is placed strictly below the right shoulder consolidation. If this fails, the pattern is void.
The Target: 14,628. Let the price action get us there, but keep the stop tight.
#DixonTech #EMS #IndiaGrowth #NIFTY #NSEINDIA XAUUSD – Gold Holds Above OB 4344Gold Holds Above OB 4344, Buyers May Prepare for a Recovery Move
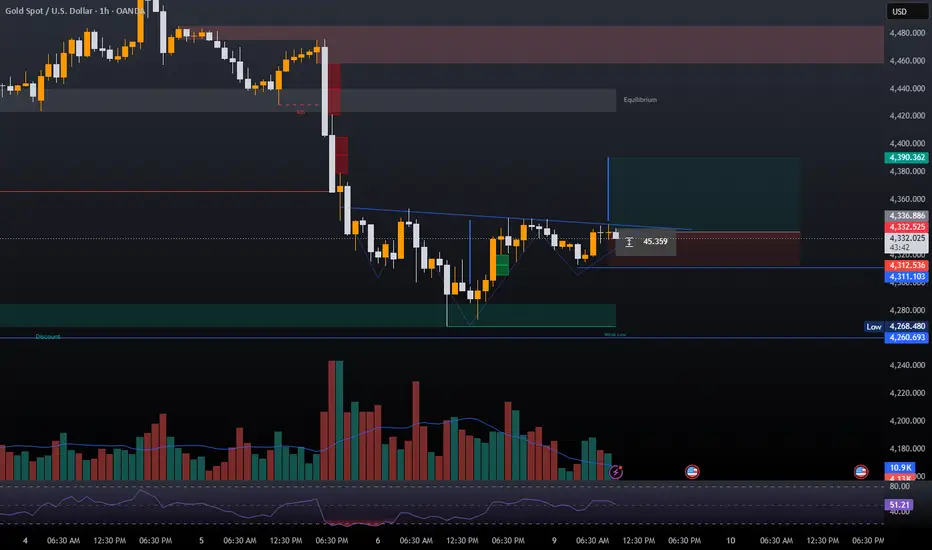
Gold is showing signs of short-term recovery after the strong sell-off from the previous high. On the H1 chart, price has created a clear reaction around the lower liquidity area and is now holding above the important OB zone near 4344. As long as this zone continues to act as support, the intraday bias can lean toward a corrective bullish move.
Fundamental Analysis
Gold is still moving inside a sensitive market environment where traders are watching USD strength, bond yields, and upcoming US data. After a sharp decline, the market may need a technical recovery before choosing the next larger direction. This is why chasing late shorts at the current price may carry more risk, especially when price is already reacting near a demand and liquidity zone.
Technical Analysis
The main structure on H1 shows that gold dropped aggressively after breaking the previous structure, leaving several imbalance zones and FVG areas above. These unfilled areas may become magnets if buyers continue to defend the current base.
The most important point on today’s chart is the OB around 4344. Price is currently trading above this zone, and the reaction shows that buyers are trying to build a short-term base. If gold continues to hold above 4344, the next move may target the liquidity area near 4365–4370 first, then extend toward the higher imbalance and OB zones around 4400–4460.
There is also a visible inverse head and shoulders structure forming on the chart. The left shoulder was created near the 4310–4320 area, the head formed deeper around 4265–4275, and the right shoulder has formed near 4315–4325. This structure suggests that sellers may be losing pressure after the deeper sweep. A confirmed break above the neckline/liquidity area near 4365–4370 would strengthen the bullish recovery scenario.
Key Price Zones
Support / Buy reaction zone: 4331–4340
Key OB support: 4344
Neckline / liquidity zone: 4365–4370
First upside target: 4385–4400
Higher target zone: 4458–4470
Invalidation area: below 4331, especially if price closes below 4325
Trading Plan
Primary Scenario – Buy Setup
Entry: 4340–4345, only if price holds above the OB and shows bullish confirmation
Stop Loss: below 4331 or below the right-shoulder low
Take Profit 1: 4365–4370
Take Profit 2: 4385–4400
Take Profit 3: 4458–4470
Entry Conditions
Price must stay above OB 4344.
A bullish reaction candle or lower-timeframe CHOCH is preferred.
The inverse head and shoulders neckline around 4365–4370 should be watched carefully.
A clean break and retest above the neckline would make the bullish setup stronger.
Alternative Scenario
If gold fails to hold above 4331–4340 and breaks below the right-shoulder area, the bullish structure becomes weaker. In that case, price may return to test the lower liquidity zone around 4315–4300 before any new recovery attempt.
Sell Conditions
Selling is only more reasonable if price breaks below 4331 and fails to reclaim 4344. A clean H1 close below this area may invalidate the buy setup and open the way for a deeper liquidity sweep.
Overall View
For today, the priority is to look for buy opportunities while gold remains above the OB 4344. The inverse head and shoulders structure supports the idea of a possible recovery move, but confirmation is still required. The key level to watch is 4365–4370. If buyers break this area, gold may continue higher toward the next imbalance zones.
Do you think gold can confirm the inverse head and shoulders breakout today?  Long
Long
Long 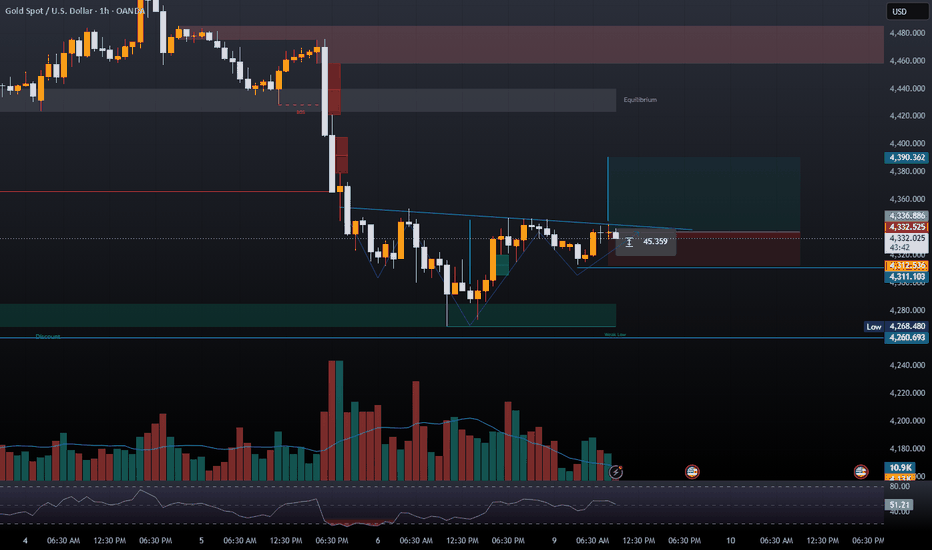
Long 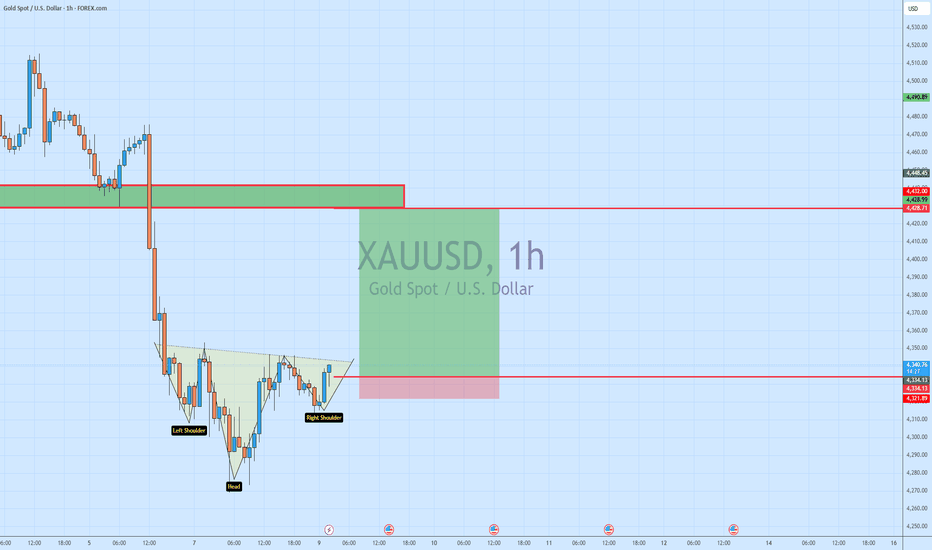
Long 
 Short
Short
 Long
Long
 Long
Long
MESM June 8: Bounce watch 7473, then 7533MESM analysis for Monday, June 8
MESM is trying to bounce after last week’s sell-off, and for me today is more of a station-by-station session than a day to be aggressively bullish or bearish.
On the 4H chart, I’m watching 7473 as the first bounce target. If bulls can keep pushing after that, then the next upside level for me is 7533.
On the downside, I’m still watching the overnight low / liquidity around 7355.
On the 1H chart, the structure remains similar, and 7386 is the key support level for me. If we get a 1H close below 7386, then I think price could continue lower toward 7355.
On the 15M chart, the same higher-time-frame levels are still in play, with 7473 and 7533 as the upside stations.
Key levels
7473 = first bounce target
7533 = second upside target
7386 = key support
7355 = downside liquidity
Plan for today
Stay patient and trade it station by station
Watch 7473 first on the bounce
If bulls stay strong, watch 7533 next
If price loses 7386, watch for downside toward 7355
Not financial advice. No confirmation, no trade. CME_MINI:MESM2026 Long