Two Valid Scenarios Remain | Elliott Wave AnalysisBitcoin (BTC/USD): Two Valid Scenarios Remain | Elliott Wave Analysis
In this analysis, both the conservative and aggressive scenarios remain valid. Until the market completes its structure, neither scenario has a decisive advantage over the other.
Under the conservative scenario, there is a possibility that the larger-degree Wave (IV) has already been completed, and the market is now developing Wave (1) of Wave (V). If this wave count is correct, the current correction may complete Wave (2) as a Double Zigzag, allowing the market to resume what could become the largest impulsive phase of Wave (V).
From this perspective, price action is the key factor. If the market begins to develop a strong Impulse or even a series of Nested 1-2, 1-2, 1-2 formations, it would significantly strengthen the probability that a new impulsive advance has already begun.
On the other hand, the aggressive scenario still suggests that the recent decline was only the first stage of a much larger corrective structure. In this case, the current rally may simply be another corrective phase, whether as a Simple Zigzag, Double Zigzag, Triple Zigzag, or any other valid corrective pattern. Once that structure is complete, another decline would be expected.
If this scenario unfolds, the larger corrective targets remain in the $30,000–$40,000 region. Furthermore, if the market is still developing the larger-degree Wave (IV), a deeper correction toward the Wave (4) of Wave (5) region, near $15,000, cannot be ruled out and remains a valid structural possibility.
At this stage, the most important question is not where price will ultimately trade, but whether the current advance marks the beginning of a new bullish trend or is simply a corrective rally before the next decline.
As with every Elliott Wave analysis, this is a structural interpretation of the market—not a price prediction. As long as the rules and guidelines of the Elliott Wave Principle continue to support these wave counts, both scenarios remain valid. Ultimately, the market itself will determine which structure unfolds.
We do not predict price—we follow the structure the market builds.
— Mr. Nobody
Independent Elliott Wave Principle Researcher
"Patterns whisper. I listen." 📊🎧
Bitcoin
Jun 2
BTCUSD 4H | The Geometry of Patience: Price, Time & the Triple Z
Bitcoin
May 22
BTCUSD — The Macro Structural Cycle (2026–2030)
Bitcoin Futures
6 days ago
Wave (IV) May Be Preparing the Next Bullish Cycle
Bitcoin
5 days ago
Bitcoin (BTC/USD): Simple Zigzag Remains the Preferred Structure
 Long
Long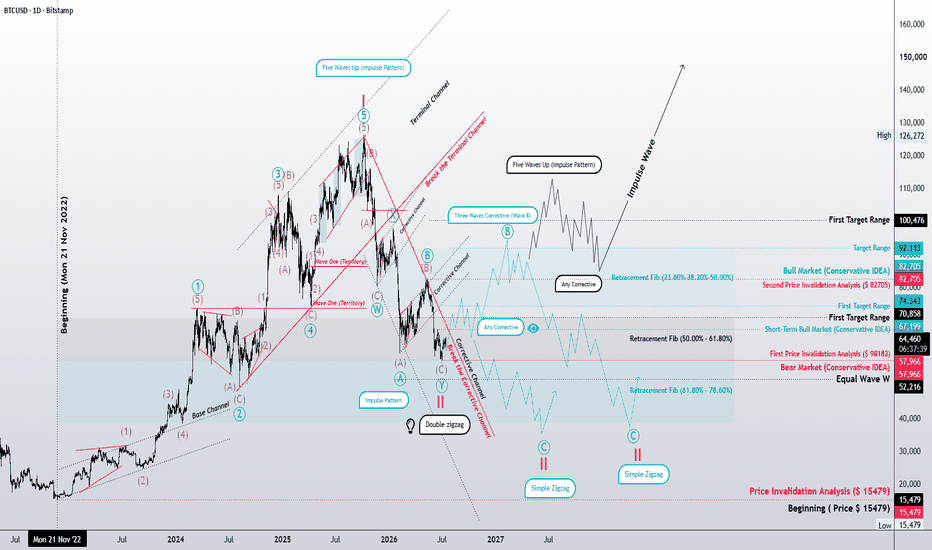
Impulse, Diagonal, or a Larger Correction?Crude Oil (USOIL)Crude Oil (USOIL) – 4H Elliott Wave Update
Impulse, Diagonal, or a Larger Correction?
The recent decline may have completed either Wave II of a developing bullish cycle or Wave b within a larger corrective structure. At this stage, both interpretations remain valid, and the market has not yet provided enough structural evidence to confirm either scenario.
If the bullish count is correct, the next advance could unfold in more than one form.
The most straightforward scenario is a classic five-wave Impulse. However, Elliott Wave Principle also allows another possibility that deserves careful attention: Wave III itself may develop as a Diagonal.
Depending on how the structure evolves, this diagonal could appear as:
A Leading Diagonal, particularly if it marks the beginning of a larger fifth wave.
An Ending Diagonal if the market gradually loses momentum.
An Extended Ending Diagonal.
A Contracting Ending Diagonal, which currently appears to be the more probable diagonal variation.
In each of these diagonal structures, the internal subdivision would follow the familiar 3-3-3-3-3 sequence rather than the traditional impulsive subdivision.
On the other hand, if geopolitical conditions, supply disruptions, or market psychology suddenly intensify, the advance may instead develop into a powerful classic Impulse, producing a much stronger acceleration than a diagonal would normally suggest.
The projected path shown on this chart represents only a schematic illustration of a possible bullish sequence. It should not be interpreted as the exact path price must follow. As the structure develops, each wave may become more complex and subdivide into additional internal degrees.
For now, the primary objective is much simpler.
The market should first reach the initial target zone and successfully break above the previous Wave B, currently labeled as Wave III on this count. Only after that structural confirmation will higher Fibonacci objectives become increasingly reliable.
Alternative Corrective Interpretation
Another possibility is that the correction is not developing as a Zigzag at all.
Instead, it may be forming a Flat Correction—possibly even an Expanded Flat.
One reason this scenario deserves consideration is that Wave A retraced nearly 90%, behavior that remains consistent with several Flat variations. Although the structure currently appears somewhat irregular, Elliott Wave guidelines recognize that Flats can often develop with a relatively "messy" internal appearance.
If this interpretation proves correct, the equality relationships between corrective waves may become more reliable than extended Fibonacci projections during the early stages of the new advance. Until the market clearly reveals the character of the next motive structure, these proportional relationships deserve close attention.
The Conservative Scenario Remains on the Table
Despite the increasing probability of a bullish reversal, the conservative scenario shared in my previous long-term analysis remains completely valid.
Under that interpretation, the entire decline may still represent only Wave (II) of a larger degree, unfolding as a Classic Zigzag before the next long-term bullish cycle begins.
For those interested in the broader context, I encourage reviewing my previous long-term Crude Oil analysis, where this conservative roadmap is discussed in greater detail.
Final Thoughts
At this stage, the objective is not to predict the exact path of the market.
It is to recognize the structures that remain valid, identify the levels that confirm or invalidate each scenario, and allow price action to reveal the true character of the developing trend.
Sometimes the market advances through a clean Impulse.
Sometimes it progresses through a slow and overlapping Diagonal.
The difference is not only in price—it is in the character of the wave.
Patterns whisper. I listen.
— Mr. Nobody  Long
Long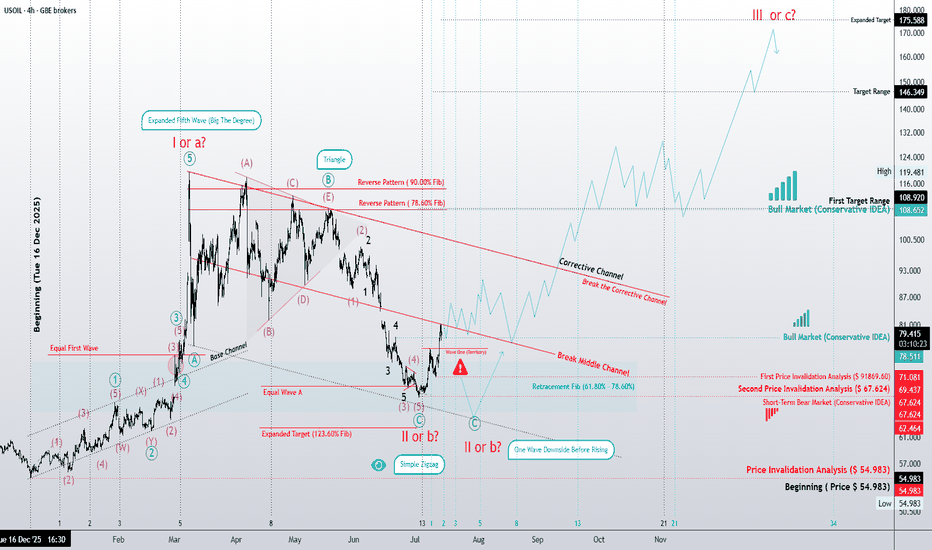
Reading the Character of the Next Market CycleCrude Oil: Impulse or Diagonal? Reading the Character of the Next Market Cycle
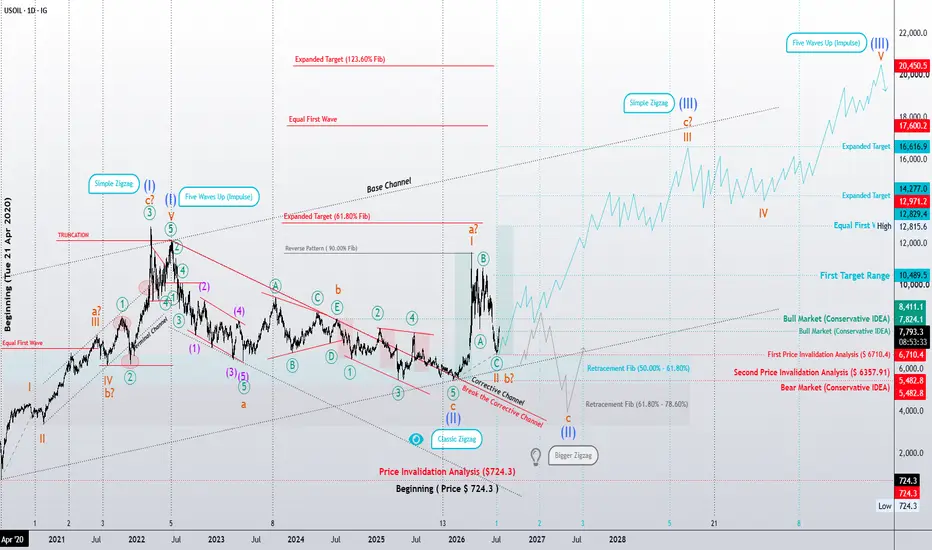
In my previous long-term analysis, the primary expectation was that crude oil was developing the final fifth wave of the largest degree as a classic Impulse. If that interpretation proves correct, the long-term bullish outlook remains valid and significantly higher price objectives could still become achievable over the coming years.
However, as the market structure continues to evolve, another equally valid Elliott Wave scenario deserves serious consideration.
Rather than unfolding as a traditional impulse, the final advance may develop as a Diagonal. At this stage, the structure could take the form of an Ending Diagonal, an Extended Diagonal, or—most likely—a Contracting Diagonal (wedge).
If this scenario unfolds, the long-term bullish outlook remains intact. The difference lies not in the direction of the trend, but in its character. Instead of a fast, decisive advance, price may continue to climb through an overlapping, grinding, and increasingly exhausting structure—behavior that is typical of terminal diagonals.
At the same time, the conservative scenario remains fully valid.
Under this interpretation, the decline from the previous major high represents only Wave A of a larger corrective structure. The following rally retraced more than 90% of that decline and reached approximately 11,555.4, a behavior that remains consistent with several corrective formations.
As a result, the current decline could be developing as an impulsive Wave C of a Classic Zigzag (A-B-C). Alternatively, it may become part of a larger Double Zigzag correction.
Another possibility that should not be overlooked is the development of a Flat correction—either a Regular Flat or an Expanded Flat. In such a case, Wave C could itself unfold as an Expanding Ending Diagonal. Although less common, this structure is fully consistent with Elliott Wave guidelines and is often characterized by increasing volatility, broadening price swings, and persistent overlap between waves.
At this stage, no single scenario has been confirmed. The evolution of price structure—and respect for key invalidation levels—will ultimately determine which path the market chooses.
Beyond Price: Studying the Character of Waves
Over the years, my research has gradually moved beyond simply counting waves or projecting price targets.
One question continues to capture my attention:
Can market structure reveal not only where price may go, but also the character of the environment in which future market cycles will unfold?
This is why I spend as much time studying the character of waves as I do their labels.
Many traders assume that every impulse must resemble the textbook ideal. My observations suggest otherwise. Every market has its own personality. Some trends unfold with exceptional strength and clarity, while others advance through prolonged overlap, hesitation, and exhaustion.
Perhaps these differences are not random.
Financial markets do not exist in isolation. They constantly interact with one another. Sometimes they move together through positive correlation. Sometimes they move in opposite directions. At other times, these relationships strengthen, weaken, or even reverse as global economic conditions evolve.
Understanding these relationships is far more complex than identifying a wave count, and I believe there is still much to discover.
In the case of crude oil, for example, a prolonged period of geopolitical tension, recurring disruptions to strategic energy routes, political conflicts, or a sustained war of attrition could create market conditions that are more consistent with the personality of an Ending Diagonal than with a clean, explosive impulse.
Conversely, an abrupt and severe supply shock could produce the kind of powerful momentum more commonly associated with a classic Impulse.
This is not an attempt to predict geopolitical events.
Rather, it is an attempt to understand whether market structure may reflect changes in collective psychology before those changes become fully visible through headlines and economic data.
This remains an ongoing personal research project rather than a definitive conclusion. My objective is not simply to forecast price, but to better understand the relationship between wave structure, crowd psychology, intermarket behavior, and the broader forces shaping future market cycles.
Perhaps markets do more than anticipate price.
Perhaps they also whisper something about the future itself.
Patterns whisper. I listen.
— Mr. Nobody
CFDs on Brent Crude Oil
Jun 6
Crude Oil: The Long-Term Elliott Wave Projection
CFDs on Crude Oil (WTI)
7 days ago
US Oil (WTI) – 4H Elliott Wave Update
Long 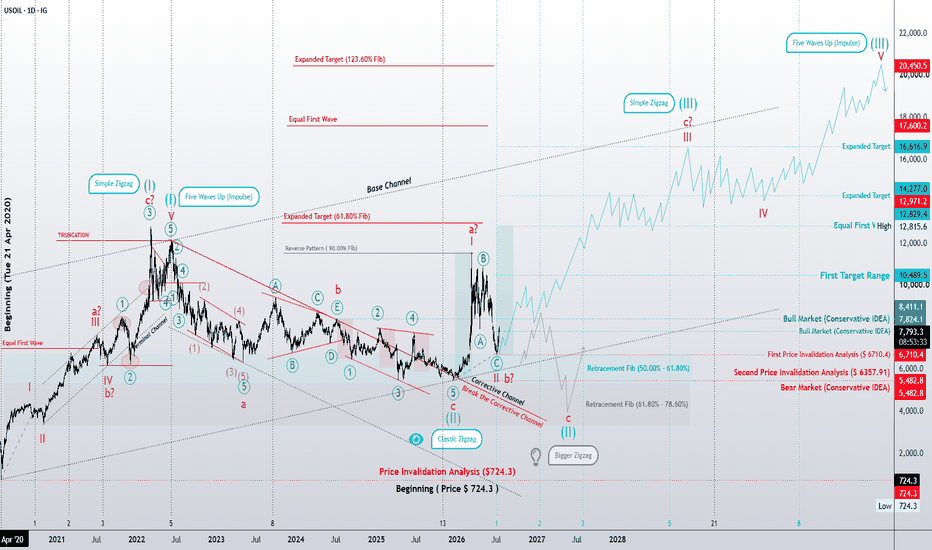
 Short
Short
Short 
Why I Believe Bitcoin Is Heading Toward the $34,000–$27,000 An Elliott Wave, Volume Profile, and Time-Based Analysis
Bitcoin has been remarkably resilient despite persistent selling pressure. While many market participants are expecting the next leg toward new all-time highs, my current Elliott Wave count suggests that the market may still have one significant corrective phase left before the next major bull cycle begins.
This article explains why I believe Bitcoin has a high probability of declining into the $34,000–$27,000 region, and why this isn't a bearish long-term thesis, but rather the completion of a larger corrective structure.
The Bigger Picture: Wave 1 Is Complete
The foundation of this analysis begins on the higher timeframe.
My current interpretation is that Bitcoin has already completed its Primary Wave 1 from the 2022 bear market low to the recent all-time high. What we are seeing today is not the beginning of another impulsive bull leg, but rather the development of Primary Wave 2 .
Wave 2 corrections often convince the majority of participants that the bull market has ended. Ironically, they serve the opposite purpose. They prepare the market for the much larger Wave 3 advance.
At present, I believe Wave 2 is unfolding as a Zigzag (A-B-C) correction.
Zooming Into the Daily Chart
Looking at the daily timeframe, the corrective structure becomes much clearer.
Wave A appears to have completed, followed by a corrective Wave B. The market is now developing Wave C , which itself subdivides into a five-wave impulsive structure.
Within that structure, Bitcoin is currently positioned in what I believe is Wave ii of Wave C .
If this count is correct, the market still needs to complete:
- Wave ii
- Wave iii
- Wave iv
- Wave v
before the entire Wave 2 correction can be considered complete.
This is the primary reason why I remain bearish over the medium term despite occasional bullish rallies.
Why $34,000–$27,000?
This projection isn't based on a single indicator.
Instead, it comes from several independent tools that all point toward the same area.
When multiple methodologies converge on one price region, the probability of that region acting as a significant reversal zone increases considerably.
1. Elliott Wave Projection
Using standard Elliott Wave Fibonacci projections, the measured target for Wave 5 of Wave C falls within approximately:
$34,000 down to $27,000
This is the natural termination zone if the current impulse completes normally.
Rather than selecting an arbitrary price target, the projection comes directly from the proportional relationship between Waves 1, 3, and 5.
2. Weekly Fibonacci Retracement
The second layer of confirmation comes from the weekly chart.
If we measure the entirety of Primary Wave 1 and project the expected retracement for Primary Wave 2, classical Elliott Wave theory suggests that Wave 2 frequently retraces somewhere between:
- 50%
- 61.8%
- 78.6%
of Wave 1.
Remarkably, this retracement region overlaps almost perfectly with the lower-timeframe Wave C projections.
Whenever higher-timeframe Fibonacci retracements align with lower-timeframe wave projections, the level deserves much greater attention.
3. Parallel Channel Structure
Price has also been respecting a well-defined descending parallel channel throughout the correction.
Rather than moving randomly, Bitcoin has consistently reacted to the channel boundaries.
As long as price continues respecting this channel, the path toward the lower boundary remains the highest-probability scenario.
Channels are often overlooked in Elliott Wave analysis, yet they frequently provide the roadmap for corrective movements.
The fact that the projected Wave v terminates near the lower boundary of the channel adds another layer of technical confluence.
4. Fixed Range Volume Profile
Perhaps one of the strongest confirmations comes from market profile analysis.
Using a Fixed Range Volume Profile across the entire advance, the Point of Control (POC) is located near $27,850 .
The POC represents the price where the highest amount of trading activity has occurred.
Markets naturally tend to revisit these high-volume acceptance areas because they represent regions where buyers and sellers previously agreed on value.
Interestingly, this level also coincides with the projected Elliott Wave completion.
5. The Breakaway Gap
Adding further confidence is the presence of a historical breakaway gap in roughly the same region.
Breakaway gaps often become important reference points during future corrections.
When a gap aligns with:
- Elliott Wave projections
- Fibonacci retracements
- Volume Profile POC
- Channel support
it becomes increasingly difficult to dismiss that area as coincidence.
Multiple Independent Confluences
This is why the $34,000–$27,000 region stands out.
It isn't because one indicator says so.
It's because multiple independent methodologies all arrive at nearly the same destination.
The current thesis is supported by:
- Elliott Wave projections
- Higher timeframe Fibonacci retracement
- Descending parallel channel
- Fixed Range Volume Profile POC
- Historical breakaway gap
The more independent tools that agree, the stronger the probability becomes.
The Remaining Question:
When Could Bitcoin Reach Its Bottom?
Price targets are only half the equation.
Timing is often the more difficult variable.
For this, I use one of the lesser-known concepts introduced by Glenn Neely in Mastering Elliott Wave .
Unlike traditional Elliott Wave analysis, Neely places significant emphasis on time relationships , not just price relationships.
His core principle is remarkably simple:
"No three adjacent waves of the same degree should be simultaneously equal in duration."
In corrective structures, two common relationships frequently appear:
Scenario 1
A + B = C
This means Waves A and B consume similar amounts of time, while Wave C becomes the longest and extends beyond both.
Scenario 2
A + C = B
Here, Waves A and C require roughly the same amount of time, while Wave B becomes the longest segment.
These time relationships help determine whether a correction is likely complete—or whether another leg is still developing.
If three adjacent waves all consume nearly identical amounts of time, Neely argues that the wave labeling is likely incorrect or that one portion of the correction remains unfinished.
In other words, time acts as a validation tool for wave structure , not merely an observation after the fact.
Applying Neely's Method to Bitcoin
Applying this framework to Bitcoin produces an interesting result.
From the charts:
- Wave A lasted approximately 123 days.
- Wave B lasted approximately 89 days.
- The projected Wave C is estimated to last roughly 212 days.
Notice something interesting:
123 + 89 = 212
This closely follows Neely's A + B = C relationship, where the duration of Wave C is approximately equal to the combined duration of Waves A and B.
This provides an additional layer of confidence, not because time predicts price, but because the correction is developing in a manner that is consistent with one of Neely's most common corrective time relationships.
Projecting that duration forward places the potential completion of Wave C around early December 2026 , which also aligns with the projected Elliott Wave completion in the $34,000–$27,000 confluence zone.
Coincidentally, this timing also aligns with the projected completion of the Elliott Wave structure near the $34,000–$27,000 confluence zone.
Looking at Previous Market Cycles
The timing becomes even more interesting when we compare it with Bitcoin's historical market cycles.
The previous major bear market bottom occurred in November 2022 , approximately two years after the May 2020 Bitcoin halving . Historically, Bitcoin has often formed major cyclical lows around this point in the post-halving cycle before beginning its next impulsive advance.
The most recent Bitcoin halving took place in April 2024 . As we are now more than two years beyond that event, the current market is entering the same historical window in which Bitcoin has previously established significant long-term bottoms.
This historical timing closely aligns with the time-based projection derived from Neely's methodology. While historical cycles never guarantee future outcomes, the convergence between Elliott Wave structure, Fibonacci retracement levels, channel support, volume profile, and Neely's time analysis suggests that early December represents a reasonable window for Bitcoin to establish a potential cycle low .
Final Thoughts
No analysis is guaranteed, and markets are under no obligation to follow any single model. Elliott Wave, Fibonacci retracements, volume profile, channel analysis, and time relationships are all probabilistic tools—not certainties.
However, when multiple independent methodologies begin pointing toward the same price and time window, the probability of that scenario naturally increases.
In Bitcoin's case, the evidence currently suggests that the ongoing Wave 2 correction could complete within the $34,000–$27,000 region , with early December 2026 emerging as a potential timeframe for the cycle bottom. Should this outlook play out, it would mark the completion of a higher-degree Wave 2 correction and potentially set the stage for the beginning of Primary Wave 3 , which is typically the strongest and most explosive phase of an Elliott Wave cycle.
Short 
 Short
Short
 Long
Long
Long
 Short
Short
XAU/USD 14 July 2026 Intraday AnalysisH4 Analysis:
-> Swing: Bullish.
-> Internal: Bearish.
Bias and analysis to remain the same as analysis dated 30 June 2026.
Price did not print bullish CHoCH to indicate bullish pullback phase initiation. Price instead printed a new low followed by a bullish CHoCH
Price is currently trading within and established internal range, however, I will continue to monitor price with respect to depth of pullback.
Intraday expectation:
Price to trade up to either premium of internal 50% EQ, or H4 demand zone before targeting weak internal low, currently priced at 3,942.100.
Note:
Gold remains volatile as tensions between the US, Israel, and Iran keep safe‑haven demand elevated.
Markets are reacting quickly to every headline, while uncertainty around the Fed’s easing path and shifting U.S. policy under President Trump, especially tariffs continues to fuel choppy price action.
For newer traders, the key is simple, stay flexible and manage risk carefully, as fast spikes and sudden reversals are a normal part of the current XAU/USD environment.
H4 Chart:
M15 Analysis:
-> Swing: Bearish.
-> Internal: Bearish.
Price has printed according to yesterday's analysis dated 14 July 2026 where I mentioned in alternative scenario that due to H4 internal structure being bearish, price could potentially target strong internal low and print a bearish iBOS.
Price subsequently printed a bearish iBOS and bullish CHoCH to indicate bullish pullback phase initiation.
Price is currently trading within a established internal range, however, I shall monitor price action with regards to depth of pullback.
Intraday expectation:
Price to trade up to either premium of internal 50% EQ, or M15 demand zone before targeting weak internal low, priced at 3,983.545.
Note:
Gold remains highly reactive on M15 as geopolitical risk continues to drive quick, headline‑led moves.
The tension between the US, Israel, and Iran is keeping safe‑haven demand elevated, with markets still sensitive to any sign of escalation.
At the same time, shifting US tariff policy under President Trump is adding extra uncertainty, fuelling sharp intraday swings and increasing the likelihood of sudden sentiment flips. Liquidity pockets and whipsaws remain common, making disciplined risk management essential.
Gold’s geopolitical premium is still firmly in place, and until tensions ease, short‑term volatility is likely to stay front‑loaded.
M15 Chart:
Long 

 Short
Short