WIFUSDT Bulls Are Running Out of TimeYello, Paradisers! Are WIF bulls about to get trapped before the next sharp move lower? WIF is currently trading around $0.2133, and despite the recent intraday recovery, the broader structure is still giving us several reasons to remain cautious.
💎The most important area to watch is the 1H resistance around $0.2200–$0.2220. Price has already shown repeated difficulty breaking through this zone, while the 1W, 1D, and 1H structures remain bearish. The 4H structure is still bullish, which means we are dealing with conflicting timeframes and should not force a directional trade without proper confirmation.
💎Before any larger move lower, WIF could still push into the nearby 1H Fair Value Gap around $0.2140–$0.2170 and attempt another liquidity grab toward the resistance above. This is exactly the type of area where inexperienced traders can easily become bullish too early, only to get trapped if price rejects again.
💎At the same time, momentum is showing signs of weakness. The bearish divergence visible on the chart suggests that price has been making stronger attempts higher while momentum has failed to confirm them. By itself, divergence is never enough to enter a trade, but combined with the resistance structure and bearish higher-timeframe conditions, it adds another warning signal.
💎If WIF fails to reclaim the resistance and starts losing the 1H support around $0.2070, the probability of a deeper correction increases significantly. The next major downside area sits around the 4H support between approximately $0.1935 and $0.1960, where we would expect a much stronger reaction if price reaches it.
💎Our bearish scenario becomes invalid if WIF can achieve a convincing candle close above the 1H resistance around $0.2220 and then successfully hold that area as support. Until that happens, chasing longs directly below resistance offers an unattractive risk-to-reward setup.
The market does not reward traders for predicting every move. It rewards those who wait until price reaches the right level and gives proper confirmation. Stay patient, protect your capital, and never allow FOMO to turn a structured trading plan into a gamble.
MyCryptoParadise
iFeel the success🌴  Short
Short
XAUUSDXAU/USD 4H — Break & Retest Plan
Current price: ~4,402
Key resistance / breakout area: 4,415–4,425
This is where your descending trendline and horizontal 4H structure are converging.
BUY setup
Wait for a 4H candle to break above the descending trendline.
Ideally, the candle should close above 4,420, not merely wick above it.
Do NOT buy the first breakout candle.
Wait for price to come back and retest 4,410–4,425.
Look for bullish rejection/confirmation on the retest.
Enter long after confirmation.
Important
If price breaks the trendline but fails to close above 4,420, don't chase it.
If it breaks above 4,420, then immediately falls back below the level and the retest fails, the bullish setup is invalid.
Your chart is essentially giving you this sequence:
BREAK ↑ → RETEST ↓ → BULLISH CONFIRMATION → BUY ↑ → 4,520 TARGET
The 4,510–4,525 area is particularly important because it is the larger 4H resistance zone marked on your chart.  Long
Long
 Short
Short
Short 
XAUUSD: Reclaiming Intraday Structure, 4,473 Remains the targetAfter yesterday's bearish move, buyers stepped in aggressively from the lows and reclaimed short-term structure.
Price is now pushing back into the 4,405–4,412 resistance area, which is the first decision point. This level previously acted as support before breaking lower, making it a logical area to watch for acceptance or rejection.
Bullish case
Price has recovered from the morning low with strong momentum.
Higher lows continue to develop.
Holding above the reclaimed intraday support keeps the move intact.
A successful break above 4,410 exposes 4,473, which is the next major resistance/liquidity level on my chart.
Bearish case
If buyers fail to secure acceptance above 4,410, I expect another rotation back toward the gray support area before any continuation.
Losing that support would invalidate the current bullish idea.
Trade Plan
📍 Entry: Current pullback/confirmation
🛑 Invalidation: Below today's recovery low
🎯 TP1: 4,410
🎯 TP2: 4,473
I'm not chasing the breakout—I'm looking for price to confirm acceptance above resistance before targeting the next liquidity level. Long 
XAU/USD 09 September 2026 Intraday AnalysisH4 Analysis:
-> Swing: Bullish.
-> Internal: Bearish.
Bias and analysis to remain the same as analysis dated 30 June 2026.
Price did not print bullish CHoCH to indicate bullish pullback phase initiation. Price instead printed a new low followed by a bullish CHoCH
Price is currently trading within and established internal range, however, I will continue to monitor price with respect to depth of pullback.
Intraday expectation:
Price to trade up to either premium of internal 50% EQ, or H4 demand zone before targeting weak internal low, currently priced at 3,942.100.
Note:
Gold remains volatile as tensions between the US, Israel, and Iran keep safe‑haven demand elevated.
Markets are reacting quickly to every headline, while uncertainty around the Fed’s easing path and shifting U.S. policy under President Trump, especially tariffs continues to fuel choppy price action.
For newer traders, the key is simple, stay flexible and manage risk carefully, as fast spikes and sudden reversals are a normal part of the current XAU/USD environment.
H4 Chart:
M15 Analysis:
-> Swing: Bearish.
-> Internal: Bullish.
Bias and analysis to remain the same as analysis dated 02 September 2026.
Price has printed according to analysis dated 25 August 2026 whereby I mentioned, in alternative scenario, that it would be entirety feasible if price was to target strong internal low and print a bearish iBOS, given the internal structure of H4 is bearish.
This is exactly how price printed. Price has subsequently printed a bullish CHoCH to indicate bullish pullback phase initiation.
Price is currently trading within an established internal range. I shall continue to monitor price with respect to depth of pullback.
Intraday expectation:
Price to trade up to either premium of internal 50% EQ, or M15 demand zone before targeting weak internal high, currently priced at 4,282.625.
Note:
Gold remains highly reactive on M15 as geopolitical risk continues to drive quick, headline‑led moves.
The tension between the US, Israel, and Iran is keeping safe‑haven demand elevated, with markets still sensitive to any sign of escalation.
At the same time, shifting US tariff policy under President Trump is adding extra uncertainty, fuelling sharp intraday swings and increasing the likelihood of sudden sentiment flips. Liquidity pockets and whipsaws remain common, making disciplined risk management essential.
Gold’s geopolitical premium is still firmly in place, and until tensions ease, short‑term volatility is likely to stay front‑loaded.
M15 Chart:
BTCUSDT: Buyers need a breakout above 79,485In the previous update, we noted that sellers needed to break below 78,660 for the correction to continue.
On the daily BTCUSDT chart, price has now moved below 78,660. The September 8 candle printed the highest volume of the past several days, while around 50% of that volume was traded below this level. This created a new key daily level at 79,485. It now becomes the nearest point for evaluating buyer strength.
If buyers can close back above 79,485, it would signal a reclaim of this level and bring the long scenario back into focus, with 82,850 as the main target — the upper boundary of the daily range.
If price fails to recover above 79,485 and continues to hold below 78,660, seller pressure will remain relevant. The next important daily level below is 75,545.67.
On the hourly timeframe, a sideways range has formed around 78,660, with its upper boundary also at 79,485. The nearest buyer target inside this structure is 78,994, which price is now approaching.
For the upside scenario to develop, we need to see a breakout above 79,485 followed by a successful defense of that breakout. In that case, the long scenario toward the upper boundary of the daily range at 82,850 becomes relevant again.
Profitable trades!
This analysis is based on the Initiative Analysis (IA) method. Why an alt season remains unlikely - September 2026
And why the worst may be yet to come….
The worse as in the market does well over the weeks maybe months ahead, leading most into a false sense of “new bull market”. That’s the danger. The truth however, is never straight forward. Both short and long term outlooks are described in this post, use that to plan your exit.
Around the same time last year Ww published the idea
“ Is Alt season dead? - June 2025 ”.
Since that time the majority of alt tokens have printed double digit corrections.
Why?
For the same reasons provided in the June 2025 idea:
In January 2017 there was 8885 tokens.
June 2020, still on 19,500 tokens.
Fast forward to June 2025 and we have 17.45 million tokens.
Today, September 2026, that number has exploded to over 59 million tokens.
Compare that value with the 55,000 to 60,000 publicly listed stocks globally traded across official stock exchanges with far greater liquidity. Now imagine a market with next to no liquidity and millions and millions of players. You see the problem, yes?
Even though many crypto tokens are ghosts / meme coins, they still extract liquidity from the market via dilution. A dilution that will continue until the entire asset class becomes a giant gelatinous puddle of worthless gloop.
Dilution as a tool to disguise fraud
“There’s only ever 21,000,000 Bitcoins”,
The irony is hard to miss. "Hard cap scarcity" is the pitch often used by creators of random tokens, but "infinite token creation" is the reality that defines the market. Akin to lifting the bucket while you're standing in it.
New investors are shown the mathematical elegance of Bitcoin, a fixed supply of 21 million coins that no central bank, government, or corporation can ever inflate. It sounds like the ultimate defence against monetary dilution. They then enter the broader alt-coin market and encounter a structural contradiction:
Micro-level scarcity vs. Macro-level hyperinflation: An individual token may claim to be scarce (e.g., "there will only ever be 1 billion of Token X"). But when anyone can deploy 1,000 new, functionally identical tokens in a single afternoon for a few dollars in network gas, aggregate supply across the asset class is effectively infinite.
The illusion of choice: Instead of inflating the supply of one currency (like fiat money printing), the crypto ecosystem inflates the supply of tokens themselves. It creates thousands of new "digital islands" every day, diluting investor attention and fragmenting capital into smaller and smaller buckets. Typical Ww inbox request “Ww can you check out this token? Has a really great team….”, he checks to find a token with the same market cap as a half-eaten kebab. 70 cents if I'm generous, 2 cents in total 24-hour liquidity, and an insider wallet holding 98% of the supply ready to dump on the first person who buys 40 cents worth on belief they've bought their lottery ticket.
Now hold that thought..
The pitch shift: The core marketing pitch subtly shifts depending on what's being sold. Bitcoin is sold as digital gold and a store of value precisely because of its fixed 21 million limit. Alt-coins and meme coins, on the other hand, are sold on asymmetric upside, promising rapid 100x gains that mask the fact that 99% of them are short-lived liquidity extraction tools.
Side note: If you want that 100x, then that’s what the Ww site is all about.
Rebalance your high probability positions often and you’ll acheive that 100x long before a single position ever does. Best part, we’re not even trading.
Ghost tokens on the other hand often appear to "vanish" from human interest, however the capital deployed into them does not disappear into thin air. Instead, it gets systematically extracted from everyday market participants through three primary drains:
1. Developer and creator liquidity pulls
The vast majority of ghost tokens are designed as short-lived extraction vehicles. Founders or early-insider wallets typically buy up a massive percentage of the supply at launch, hype the token to attract external retail capital, and then dump their holdings onto the liquidity pool. The Trump meme coin for example, a presidential rug pull. Supporters YOLO’d in with the grandparents inheritance on the promise of a big win. In reality, Grandpa’s life long earnings of blood, sweat, and tears was used to provide a billionaire with exit liquidity.
“ Trump reports over $1.4 billion in income from crypto ventures ”
Fraud used to result in a custodial sentence, now it's an accolade.
2. Infrastructure & Protocol Tolls
Even when a token fails completely and leaves investors with worthless digital bags, the platforms facilitating the deployment collect real, non-refundable fees:
Launchpad Platforms: Platforms like Pump.fun generate hundreds of millions, cumulatively over $1.2 billion in platform revenues almost entirely off micro-cap and ghost token deployments.
Bot & router fees: Telegram trading bots, DEX aggregators, and front-running/MEV (Maximal Extractable Value) bots extract trading fees on every buy and sell, regardless of whether the token survives.
Network Gas: Millions of dollars in native gas fees ( CRYPTOCAP:SOL , CRYPTOCAP:ETH , TSX:BASE ) are permanently paid to network validators to deploy and trade these ephemeral tokens. Brilliant.
Is there hope for the *long term* alt token market?
Absolutely not. Sorry. The trajectory is clear. 10 years of trajectory. A trajectory written with facts of the chart. Facts which can be fully ignored by some good old pig headed stubbornness. A card many retail traders are going with, “But Ww this team is really good, a friend of a friend told me… “
The facts are that with each market cycle the liquidity thins over a greater number of tokens resulting in diminishing returns. It’s that simple. No amount of bluff or bluster is going to change that.
Using the above chart (OTHERS, Crypto Total Market Cap Excluding Top 10, really it’s the top 100 or so, but the point is where liquidity is going or not going), we see:
That between Halvings the size of return in the top 100 tokens falls as the number of tokens increase. A statistic that made all the more remarkable when you consider the total crypto market capital has grown from $5billion to $2.7trillion. OTHERS would be 6.7x more or $1.44 trillion if it followed that same growth.
Like watching the hour hand of a clock the green arrows rotate clockwise with each cycle as the same amount of butter used to scrap over an ever larger slice of toast. Eventually it becomes a dry slice nobody wants to touch.
Is there a *Near term * positive future of alt tokens?
Yes and no. In the near future market participants will become excited as their dormant bags of 6+ years begin to breath life. (Litecoin holders know of what I speak). The result of this performance over the next 10-12 weeks will cause the comment section to blow up with:
“Wrong”
and less we forget:
“XRP to replace SWIFT” nonsense,
that’s your signal to get out once and for all. Retail traders will never change.
A higher low (the last hope)
Notice the “Higher low” remark on the chart?
Now if you follow my work you should know the first questions we always ask ourselves, what is the answer to questions 1 and 2? If you know you know. In short the questions are designed to establish acknowledgment of:
Support or resistance
The trend
The answer to both is currently positive despite the big picture view. Confusing huh?
In addition to that there’s the market resistance at $367Billion. Not just any resistance, Thor’s hammer resistance. It’ll be the 3rd test, which is interesting in of itself. Do you know why?
If Price action breaks through that resistance it’ll result in a huge upswing for alt tokens. If it’s resistance confirmed for the third time, it’ll be an epic meltdown. Which is it?
Now you know my position, until that $367b area, the market is highly positive for alt token speculators. Make the most of it. Afterwards is a mystery until confirmation. Always wait for confirmation.
Conclusions :
Two timeframes. Two opposite answers. Both correct.
Near term the higher low is real, support holds, and there is roughly 73% between here and $367 billion. Trade it. Then leave.
Why the third test matters, since I asked: every test consumes the sellers defending the level. Two rejections have already used them up. Third tests do not bounce politely, they resolve. So:
• Confirmed monthly close above $390 billion and the bearish structure is void. I will say so. So kind of him.. Karma.
• Third rejection at $367 billion and the decade-long top completes. RSI has leaned that way since 2021. Lower high. Lower lower high, currently 51 and falling.
Scale out into strength as $367 billion approaches. When the comments fill with “wrong”, insults etc, that is not validation. That's the bell.
The danger in the coming weeks is not the drawdown. It is the rally, a market that rises just enough, for just long enough, to convince you six years of structure has been repealed by a good quarter. It has not. Use the strength, but don’t marry it.
Good luck.
Ww
Type: Macro / crypto market structure | Timeframe: Near term 10–12 weeks, structural 2–5 years
=========================================
Disclaimer : This idea is for educational and informational purposes only. It is not financial advice nor is not a recommendation to buy, sell or hold any digital asset. The analysis concerns the aggregate market capitalisation of the alt-coin sector and makes no assessment of any individual token, project or team. Commentary regarding named individuals, ventures or platforms is opinion drawn from publicly reported sources, linked where cited, and no
allegation of unlawful conduct by any named party is made or intended.
Token counts and market capitalisation figures are taken from publicly available data at the date of publication and may be revised. Crypto assets are highly volatile, largely unregulated in most jurisdictions and carry a risk of total capital loss, with low-liquidity tokens carrying the additional risk that a position cannot be exited at any price. Always do your own research. XAUUSD: Gold Is Still Bearish — But the Market ...XAUUSD: Gold Is Still Bearish — But the Market Has Not Chosen Its Next Direction Yet
Gold has been unusually quiet today.
After the important news released on Friday, the market has not given us a clean directional move yet.
At this stage, it is difficult to confidently say that the next major move will be bullish or bearish.
For now, however, the technical structure remains bearish on the short-term horizon.
The interesting part is that the higher timeframe is also giving us something worth watching.
Current Technical Structure
On the H1 chart, price has already experienced a strong rejection from the 4466 area and broken the previous short-term bullish structure.
Since then, price has been moving inside a corrective structure rather than producing a strong bullish continuation.
This leaves an important resistance zone above the current price:
Resistance / Pullback Zone: 4430–4440
I am more interested in seeing price return to this area than chasing the market at current levels.
The ideal scenario would be a pullback into the zone followed by a bearish price-action confirmation — such as rejection, a liquidity sweep, or a lower-timeframe structure break.
In that case, the short-term bearish setup becomes much more attractive.
Trade Setup
XAUUSD — H1
Bias: Bearish
Sell / Pullback Zone: 4430–4440
Invalidation: 4466
Day-Trading Target: 4346
Short-Term Target: 4240
The idea is simple:
Pullback → Confirmation → Short
Not: Price is falling → Chase the move.
The Higher-Timeframe Picture
There is another reason I am not rushing this setup.
On the 4H timeframe, a potentially clear Head and Shoulders structure is developing .
I will publish a separate idea about this pattern tomorrow because the higher-timeframe structure could become much more important if the neckline and surrounding levels confirm the bearish scenario.
However, there is an important condition.
If the 4466 invalidation level is broken and price accepts above it, I would no longer treat the current bearish setup as valid.
In that situation, the market could take another step higher and force us to reassess the entire structure.
That is exactly why I prefer working with invalidation rather than predictions.
My Current View
For now, I remain short-term bearish.
But I am not convinced enough to chase the market.
Friday's news created uncertainty, and today's lack of directional movement is another reason to remain patient.
The market does not have to move simply because we have an idea.
If price gives us the pullback into 4430–4440 and confirms the bearish structure, the setup becomes interesting.
If 4466 breaks, the bearish idea is invalidated and I will look for the next opportunity instead.
We don't need to predict every move. We only need to be prepared when the market gives us a setup with clearly defined risk.
Setup Summary
🔴 Bias: Bearish
📍 Pullback Zone: 4430–4440
❌ Invalidation: 4466
🎯 Target 1: 4346
🎯 Target 2: 4240
The 4H Head & Shoulders structure will be discussed in tomorrow's analysis.
Risk Warning: This analysis is for educational purposes only and is not financial advice. Gold can experience sharp moves, especially around economic news. Always define your risk before entering a leveraged position and never risk more than you can afford to lose. Short 
SOLANA: BREAKOUT OR TRAP?Yello Paradisers, Are you prepared for SOL to shake out impatient traders before potentially launching toward the $108-$113 region?
💎SOLUSDT is currently trading around $103.33, and the structure is becoming increasingly interesting. While the higher timeframes remain bullish, the 1H chart is still bearish and price continues to trade inside a descending channel. This short-term weakness is exactly why patience matters here.
💎The broader picture remains constructive. The weekly, daily, and 4H structures are bullish, while only the 1H structure remains bearish. In other words, the current decline can still be treated as a lower-timeframe correction unless SOL starts losing the major support structure below.
💎Our key area is the 4H support zone around $100.00-$102.00. Price is approaching this region while simultaneously compressing beneath the descending 1H resistance. This creates an important decision point: buyers either defend the support and eventually break the descending structure, or SOL loses the zone and forces us to reassess the bullish scenario.
💎We have also already seen evidence of sellers being absorbed around the psychological $100 region. That does not guarantee an immediate reversal, but it shows that buyers have previously been willing to step in aggressively around these prices.
💎For bullish confirmation, we want to see SOL reclaim and break above the descending 1H resistance with convincing price action. If that happens while the 4H support continues to hold, the first significant upside objective sits around the $108 4H resistance.
💎Above that, the much more important target is the daily resistance zone around $112-$113. A clean continuation into this area would confirm that buyers have regained considerably more control.
💎However, Paradisers, this is not a place to blindly chase longs simply because the higher timeframes are bullish. SOL remains trapped below short-term descending resistance, meaning another liquidity sweep or deeper reaction into support is still completely possible before the stronger move develops.
💎Our bullish outlook becomes substantially weaker if price starts closing below the marked invalidation region around $98.00. Until that happens, the higher-timeframe bullish structure remains the dominant factor, while the current 1H weakness should be treated as the correction we need to monitor carefully.
💎The important part now is not predicting every candle. It is waiting for confirmation at the right levels. If buyers successfully defend $100-$102 and SOL breaks its descending structure, the road toward $108 and potentially $112-$113 becomes considerably cleaner.
Strive for consistency, not quick profits. Treat the market as a businessman, not as a gambler. The traders who remain patient around these decision zones will always have an advantage over those chasing every small move. Trade smart, Paradisers, and wait for the highest-probability confirmation before putting your capital at risk.
MyCryptoParadise
iFeel the success🌴  Long
Long
Cheniere Energy: Next Structural Move? — 3M | 1M | 1W | 1D | 4HCheniere Energy: Decoding the Multi-Degree Structural Architecture on the Threshold of the Next Major Move
Integrated Structural, Time, and Price Analysis Across the 3M, 1M, 1W, 1D, and 4H Timeframes
────────────────────────────────────────────────
1. Structural Hypothesis
Cheniere Energy is currently at a sensitive stage of its long-term structural development. Price has moved toward the upper regions of the broader structure, while the final identity of the higher-degree structure remains unresolved.
At the Cycle degree, only the initial point, , can currently be regarded as structurally confirmed. The opposing endpoint, , has not yet been determined, and therefore the final endpoint of the current long-term structure remains an open structural variable.
As a result, the current condition cannot be reduced to a predetermined price target or reversal point. Instead, the market is moving toward a Time–Price decision zone; an area in which several plausible structural scenarios remain active.
In the 3M timeframe, the primary time windows are 2.618, 3.618, and 5.0, measured relative to .
Along the price axis, the structure has so far moved through the 75%, 78.6%, and 100% levels, while the 127.2%, 150%, 161.8%, 200%, and 261.8% levels may still act as potential areas for continued structural extension or completion.
Therefore, the primary question is not simply whether Cheniere Energy will continue its upward movement; rather, the central question is:
To which structural degree does the current upward movement ultimately belong?
At the higher degree, two primary possibilities remain: Is the market completing (N.1), or is it developing toward ?
At the monthly degree, the question is whether the current sequence completes as a five-phase structure or extends into a seven-phase development.
The 1W, 1D, and 4H structures are used not as independent forecasts, but as evidence from lower degrees to progressively clarify the unresolved structure at the higher degree.
Accordingly, Cheniere Energy should currently be regarded as a conditional structural transition; meaning that the market itself must determine which of the higher-degree scenarios ultimately remains valid.
Figure 1 — Long-Term Structural Origin in the 3M Timeframe
────────────────────────────────────────────────
2. Structural Hierarchy
The analysis progresses through a hierarchical sequence:
3M | 4 | Cycle | ➔
1M | 3 | Primary | → → → →
1W | 2 | Intermediate | (N.1) ➔ (L.1) ➔ (N.2)
1D | 1 | Minor | α ➔ β ➔ γ ➔ δ ➔ ω
4H | 0 | Minute | P.a ➔ v.β ➔ P/Pc.c
The purpose of moving across these degrees is not to treat every movement in a lower timeframe as an independent confirmation.
A movement at a lower degree can provide evidence for the development of a higher-degree structure, but completion of a lower-degree structure alone cannot prove completion of the higher-degree structure. This distinction is particularly important in the current market condition because the higher-degree structure remains only partially resolved.
────────────────────────────────────────────────
3. Long-Term Structural Architecture — 3M Timeframe
The 3M timeframe defines the primary long-term framework of the current model.
The model begins from the historical reference identified as , recorded at April 1979 / $85.50, and the corresponding Alpha point identified at October 2002 / $0.40.
This reference serves as the time and price origin for measuring the current structure at the Cycle degree. Following this, the upward movement developed into a broad and multi-phase extension.
However, this point is not regarded merely as an ordinary price low; rather, it establishes the reference against which the subsequent long-term development is evaluated.
At the current stage, at the Cycle degree, only this initial structural point is regarded as confirmed. Its opposing point, , remains unresolved.
Therefore, two possibilities at the higher degree remain open:
(N.1)?
or
?
The question mark does not merely indicate uncertainty regarding the direction of movement. Rather, it indicates uncertainty regarding the structural identity of the future endpoint of the movement.
Therefore, this distinction is highly important. The current rise may represent the completion of a (N.1) structure at the Primary degree, or it may represent the continued development of Degree 4, namely .
Thus, the existing ambiguity is structural, rather than merely directional.
────────────────────────────────────────────────
4. Structural Boundaries and Time–Price Zones in the 3M Timeframe
The long-term price structure remains within a broad upward structural channel, while Fibonacci extension levels define the primary price boundaries.
Price levels already surpassed: 75% ← 78.6% ← 100%
The remaining extension levels are: 127.2% ← 150% ← 161.8% ← 200% ← 261.8%
These levels define the remaining price range within which the current structure may continue its extension or ultimately reach completion.
The time dimension creates a second set of structural boundaries:
2.618 → 3.618 → 5.0
Both dimensions, time and price, are measured relative to the origin .
The significance of this is that the completion of a structure in time becomes more analytically meaningful when time and price converge within a common zone, rather than when price merely reaches an individual Fibonacci level.
Therefore, the current condition in the 3M timeframe remains a multi-scenario Time–Price field, rather than a predetermined endpoint.
Figure 2 — 3M Time–Price Scenario Map for
────────────────────────────────────────────────
5. — Current Scenario Field
Three primary time windows remain active for the potential development or completion of :
Window 1 — 2.618 Window 2 — 3.618 Window 3 — 5.0
These time windows interact with the remaining price boundaries:
127.20% 150% 161.80% 200% 261.80%
The resulting structure is better regarded as a Time–Price search field within which the future may reach maturity.
As the market approaches one of these time and price zones, the corresponding structural scenario gains or loses significance according to price behavior within that zone. The market itself must gradually eliminate or reinforce the competing probabilities.
Therefore, the analysis intentionally preserves multiple scenarios until the interaction between price and time becomes sufficiently constraining to allow the identification of the endpoint of the higher-degree structure.
────────────────────────────────────────────────
6. Monthly Structural Decomposition — 1M Timeframe
The monthly timeframe decomposes the long-term upward movement into its internal structure at the Primary degree:
→ → → →
At the current position, two primary structural paths remain open.
Scenario A —
In this scenario, the current five-phase structure terminates with .
This completion raises the question of whether this movement simultaneously completes the higher-degree structure, namely (N.1), or whether it functions as an endpoint associated with .
Scenario B —
In this scenario, the current structure moves beyond and enters the following sequence:
← ←
After that, the remaining final phase also develops eventually.
This condition indicates that the structure at the Primary degree remains incomplete and requires further development before the endpoint at the higher degree can be determined.
This distinction makes the monthly structure one of the principal decision-making layers in the entire model.
The distinction between these two scenarios cannot be resolved solely through the monthly structure. The purpose of the monthly structure is to identify the competing structural paths that the lower degrees must subsequently decompose and resolve.
Figure 3 — Monthly Five-Phase Structure
────────────────────────────────────────────────
7. Monthly Seven-Phase Scenario
To examine the extension hypothesis, a secondary seven-phase scenario is retained in the monthly timeframe.
The purpose of this scenario is not to impose a seven-phase interpretation on the market, but to examine whether the current movement requires development beyond the standard five-phase completion.
Under this scenario, the continuation of the movement would proceed through the following sequence:
→ →
Under this scenario, each phase develops within its own approximate Time–Price range.
The most important temporal implication of this scenario is that, if the seven-phase structure remains valid, its completion could approach the 3.618 time boundary.
In such a case, the endpoint of the higher degree, , could also occur within the same time zone.
This convergence is analytically important because it connects the seven-phase scenario at the lower degree to a potential completion window at the higher degree.
Therefore, the seven-phase interpretation remains a conditional structural branch that becomes active only if the market fails to complete the current five-phase scenario and continues to develop further.
Figure 4 — Monthly Seven-Phase Scenario
────────────────────────────────────────────────
8. Continuous Double Corrective Structure — 1W Timeframe
In this section, the 1W timeframe examines Degree 2 of the structural hierarchy, and the analysis focuses on the current final branch, which begins from the completion of .
itself is the fourth phase of either a five-phase neutral structure or a seven-phase symmetrical structure previously identified and examined in the monthly timeframe.
Therefore, in the 1W timeframe, the analysis focuses on the fifth branch in order to determine what this branch is, how far it has developed, and whether the structure has reached completion or remains incomplete.
The identification and evaluation of the structural status of this branch constitute the primary focus of the analysis in this timeframe.
The active weekly sequence is identified as follows:
(N.1) → (L.1) → (N.2)
This configuration forms a continuous double corrective structure, in which (N.1) forms the initial component of the structure and has a seven-phase symmetrical character; (L.1) functions as the connecting structure and itself forms a five-phase neutral structure; and (N.2) is the current active branch, extending toward higher price levels.
This branch is currently incomplete and will be examined in greater detail through a zoomed analysis in the daily timeframe.
As shown in the chart inserted below, the potential area of further expansion and development in both time and price has been marked hypothetically.
At the current stage, from a price perspective, (N.2) is positioned at the 0.5 Fibonacci ratio, measured relative to (N.1).
More precisely, the current price is positioned at 50% of the price of (N.1).
Figure 5 — Weekly Continuous Double Corrective Structure
────────────────────────────────────────────────
9. Daily Structural Development — 1D Timeframe
In this section, the 1D timeframe examines Degree 1 of the structural hierarchy, with the analysis focused on the third component of the corrective double structure, namely (N.2).
The current sequence of this structure is identified as:
α → β → γ → δ → ω
The primary focus of the analysis is the active structure (N.2).
Within this branch, the market is developing a standard five-phase neutral structure and is currently still in phase γ, meaning the third phase of a five-phase structure.
Since γ has not yet been completed, the daily structure has not yet reached its terminal sequence.
To complete this structure, following the completion of γ, the next two phases, δ and ω, must develop sequentially.
Consequently, the continued development of γ, followed by the formation of δ and ω, is important for resolving the weekly structure (N.2) and may ultimately contribute to the identification and evaluation of structural scenarios at the monthly timeframe.
In the image below, hypothetical Time–Price zones for γ, δ, and ω have been drawn.
These zones are by no means certain or predetermined, nor have they been drawn randomly. Rather, they have been designed on the basis of structural proportions and the potential relationships that a standard five-phase structure may produce under its structural rules and principles, so that the potential development ranges of each branch can be visualized in both the time and price dimensions.
Accordingly, the current purpose of this image is simply to serve as a roadmap. The actual path of structural development must be confirmed or rejected on the basis of future market behavior and structural evidence.
In the next timeframe, the analysis will focus on this same branch ω. Its internal structure will then be examined in greater detail to determine what structural form it has, how far it may potentially develop, and whether it has reached completion or remains incomplete.
Figure 6 — Daily Five-Phase Structural Development
────────────────────────────────────────────────
10. Decomposition of the Third Branch of the Daily Structure — 4H Timeframe
In this section, the 4H timeframe provides the nearest structural decomposition relative to the current market price, with the analysis focused on the third branch of the daily structure.
This branch, identified as γ in the daily timeframe, is decomposed at this degree in greater detail to determine its internal architecture and degree of development.
The current sequence in the 4H timeframe is identified as:
P.a → v.β → P/Pc.c
Within this structure, the active branch is divided into three primary components:
First branch: a structure consistent with a standard impulse structure, forming the initial component of the sequence.
Second branch: a corrective structure displaying the characteristics of a standard five-phase neutral structure.
Third branch: the current active and developing component, which at present represents the last unresolved portion of the structure.
Based on this configuration, the primary question at this degree is whether these three components, taken together, can form a larger corrective structure of the zigzag type.
This interpretation is currently conditional and is not accepted merely on the basis of visual similarity. Rather, its validity must be determined through the internal development of the third branch and its interaction with the defined price, structural, and time boundaries.
Therefore, the third branch is the determining component of this structure.
Its completion will determine whether the entire three-part sequence can ultimately be classified as a valid zigzag, or whether, as new evidence emerges, the structure will require reassessment and reclassification.
Figure 7 — Four-Hour Three-Branch Structural Architecture
In the current condition, the 4H structure provides a conditional zigzag scenario whose validity has not yet been finalized.
The determination of this scenario depends on the development of the third branch and the extent to which it conforms to the constraints defined by price, structure, and time.
Consequently, the continuation of this structure will be determined through the development of the third branch and the testing of its validation conditions, which are examined independently in the following section.
Figure 8 — Conditional 4H Zigzag Scenario
────────────────────────────────────────────────
11. Zigzag Validation Conditions — 4H Timeframe
The validity of the zigzag structure at this degree is directly dependent on the development of the third branch.
This branch can remain structurally valid within the current scenario only if it simultaneously respects the defined price constraints, structural boundaries, and time range.
Price Condition:
The defined price threshold for the third branch is:
$250.77
The third branch must develop above $250.77 while at the same time remaining below the primary resistance boundary identified on the chart.
If price reaches or breaks through the prohibited resistance before reaching the corresponding time boundary, the current zigzag scenario becomes invalid and the structure must be reassessed and, if necessary, reclassified.
Time Condition:
From a temporal perspective, the third branch has two structural constraints.
The minimum time required for its development is defined by the 1.0 time ratio, corresponding to the duration of the first branch.
In contrast, the maximum permitted duration is determined by the combined duration of the previous two branches.
Therefore, the third branch not only requires a minimum amount of time to reach structural maturity, but must also determine its structural outcome before crossing the maximum temporal boundary.
As a result, the validation framework for the zigzag at this degree rests on four primary components:
Price condition + Structural boundary + Minimum time + Maximum time
Only when these conditions remain simultaneously satisfied will the current interpretation be maintained as a valid zigzag.
Otherwise, if market behavior changes or any of the defined boundaries is violated, the validity of the scenario will be called into question and the structure must be reassessed.
Figure 9 — 4H Zigzag Validation
────────────────────────────────────────────────
12. Integrated Structural Assessment
The current multi-degree structure, from the 3M timeframe through the 4H timeframe, presents a continuous and interconnected structural hierarchy in which, at each degree, the higher-degree structure is decomposed and constrained in greater detail.
At the Cycle degree, the identity of the opposing endpoint, namely , remains unresolved. Therefore, the 3M structure remains within a Time–Price scenario field, with the time windows 2.618, 3.618, and 5.0 and the price range from 127.20% to 261.80% serving as the principal boundaries for potential development.
At the Primary degree, this broader field is reduced to two principal structural paths: completion of the five-phase structure or continued development in the form of a seven-phase structure.
The weekly structure transfers this ambiguity one degree lower and connects the current movement to (N.2) within a continuous double corrective structure.
The daily timeframe then decomposes this same branch into a standard five-phase neutral structure, which is currently at γ and has not yet reached its terminal sequence.
At the lowest degree examined, the 4H timeframe decomposes the γ structure into a three-part sequence which, based on its current architecture, allows a conditional interpretation as a zigzag.
However, this classification will only be maintained if the third branch can simultaneously satisfy the requirements of price, structure, and time.
Therefore, the validity of this interpretation remains dependent on the future behavior of this same branch and its passage through the defined boundaries.
Overall, the evidence obtained from the lower degrees does not yet prove completion of the higher-degree structure. Rather, by progressively constraining the probabilistic space, it enables a more precise assessment of the remaining scenarios.
From this perspective, the model does not provide a fixed price target or predetermined endpoint. Instead, it follows a process of structural identification, validation, and, when necessary, reclassification, in which each degree provides the information required to progressively resolve the higher degree.
────────────────────────────────────────────────
13. Forward Structural Roadmap
The current structural roadmap can be viewed as a hierarchical sequence that begins at the Cycle degree and, by moving toward the lower degrees, progressively decomposes and constrains the unresolved structure:
3M
→ Endpoint of the higher-degree structure remains unresolved
↓
1M
→ or continued development toward →
↓
1W
(N.1) → (L.1) → (N.2)
↓
1D
α → β → γ → δ → ω
↓
4H
Three-branch development → Conditional zigzag scenario
↓
Validation
$250.77 + Resistance boundary + Minimum and maximum time
This roadmap does not represent a predetermined path for future market movement. Rather, it illustrates the current sequence through which the structure is being resolved across the different degrees.
At each stage, the lower-degree structure must provide the evidence required to evaluate the higher-degree structure, without completion of a lower-degree structure alone implying completion of the higher-degree structure.
Therefore, the significance of the current market condition cannot be reduced to a simple directional forecast.
The central question is whether structural development across the lower degrees can, while preserving the constraints of time, price, and structure, progressively narrow the space of competing scenarios and provide sufficient evidence to identify and validate the higher-degree structure or not.
Within this framework, each new movement is evaluated not merely as a continuation or reversal in price, but as evidence for maintaining, strengthening, weakening, or reclassifying the structural scenario.
────────────────────────────────────────────────
14. Final Structural Conclusion
Cheniere Energy is currently approaching a structural decision point; a point at which time, price, and the internal development of structures must interact with one another so that the identity of the higher-degree structure can be established with greater confidence.
In the 3M timeframe, remains unconstrained to a single final location, and multiple Time–Price zones remain as potential areas for structural development or completion.
In the monthly timeframe, two primary paths remain valid: completion of the five-phase structure or continued development in the form of a seven-phase structure.
In the weekly timeframe, this ambiguity is transferred into a continuous double corrective structure and linked to (N.2).
In the daily timeframe, this same branch is developing as a standard five-phase neutral structure and remains in phase γ.
Finally, the 4H timeframe represents the nearest structural layer to the current market price and provides the opportunity to directly examine the internal architecture of the third branch and test the conditional zigzag hypothesis.
Accordingly, the current condition cannot be classified as a confirmed completion of the higher-degree structure.
What is currently developing is a conditional structural transition, in which evidence from the lower degrees must progressively constrain the space of competing scenarios.
At the lowest degree examined, the validity of the zigzag scenario depends on the development of the third branch and its simultaneous adherence to the price condition, structural boundary, and temporal constraints.
A move above $250.77, provided that price remains below the defined resistance boundary and respects the required time range, may strengthen this interpretation. Conversely, violation of any of these conditions at any degree reduces the validity of the scenario at the corresponding degree and creates the need for reassessment or reclassification of the structure at the degree in which the violation occurs.
The same principle applies at the higher degrees.
Evidence obtained from the lower timeframes must not predetermine the endpoint of the structure; rather, it must determine whether the current movement ultimately leads to the completion of (N.1), forms , or requires further structural development before its final identity can be established.
Therefore, the final conclusion of this analysis is not a fixed price target or predetermined reversal point. Rather, it is a progressive process of structural identification, validation, and, when necessary, reclassification.
Within this framework, each timeframe provides part of the evidence required to resolve the higher degree, and the final structural identity can only be approached when time, price, and structural behavior converge sufficiently within a common area.
────────────────────────────────────────────────
 Long
Long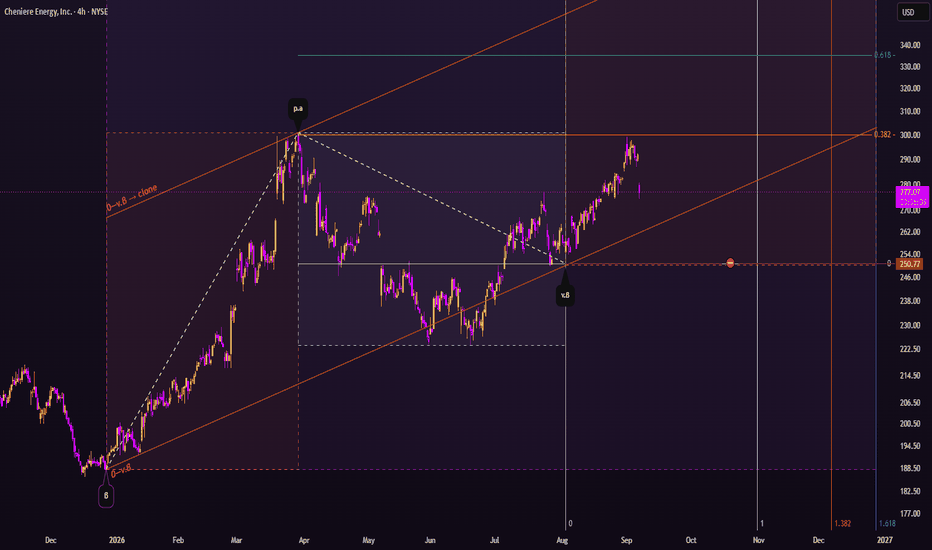
XAU/USD 08 September 2026 Intraday AnalysisH4 Analysis:
-> Swing: Bullish.
-> Internal: Bearish.
Bias and analysis to remain the same as analysis dated 30 June 2026.
Price did not print bullish CHoCH to indicate bullish pullback phase initiation. Price instead printed a new low followed by a bullish CHoCH
Price is currently trading within and established internal range, however, I will continue to monitor price with respect to depth of pullback.
Intraday expectation:
Price to trade up to either premium of internal 50% EQ, or H4 demand zone before targeting weak internal low, currently priced at 3,942.100.
Note:
Gold remains volatile as tensions between the US, Israel, and Iran keep safe‑haven demand elevated.
Markets are reacting quickly to every headline, while uncertainty around the Fed’s easing path and shifting U.S. policy under President Trump, especially tariffs continues to fuel choppy price action.
For newer traders, the key is simple, stay flexible and manage risk carefully, as fast spikes and sudden reversals are a normal part of the current XAU/USD environment.
H4 Chart:
M15 Analysis:
-> Swing: Bearish.
-> Internal: Bullish.
Bias and analysis to remain the same as analysis dated 02 September 2026.
Price has printed according to analysis dated 25 August 2026 whereby I mentioned, in alternative scenario, that it would be entirety feasible if price was to target strong internal low and print a bearish iBOS, given the internal structure of H4 is bearish.
This is exactly how price printed. Price has subsequently printed a bullish CHoCH to indicate bullish pullback phase initiation.
Price is currently trading within an established internal range. I shall continue to monitor price with respect to depth of pullback.
Intraday expectation:
Price to trade up to either premium of internal 50% EQ, or M15 demand zone before targeting weak internal high, currently priced at 4,282.625.
Note:
Gold remains highly reactive on M15 as geopolitical risk continues to drive quick, headline‑led moves.
The tension between the US, Israel, and Iran is keeping safe‑haven demand elevated, with markets still sensitive to any sign of escalation.
At the same time, shifting US tariff policy under President Trump is adding extra uncertainty, fuelling sharp intraday swings and increasing the likelihood of sudden sentiment flips. Liquidity pockets and whipsaws remain common, making disciplined risk management essential.
Gold’s geopolitical premium is still firmly in place, and until tensions ease, short‑term volatility is likely to stay front‑loaded.
M15 Chart: GBPUSD | Daily Demand Emerges Before the Extreme ZoneIn my previous FX:GBPUSD analysis, my expectation was for the 4H bearish structure to continue lower until price reached the extreme Daily Demand Zone below. That was the primary Daily Demand area I had identified at the time, and my expectation was that this area could provide the bullish reaction needed to shift the market higher.
However, while reviewing the chart yesterday, I identified another Daily Demand Zone above the extreme zone. This zone was not identified in my original analysis.
Price has now reacted from this newly identified Daily Demand, and the resulting bullish movement is currently pushing toward the 4H Lower-High. The 4H structure itself remains bearish for now.
Therefore, I am not treating the current bullish reaction as an automatic 4H reversal.
Instead, I am watching whether this Daily Demand can generate enough bullish momentum to break the 4H Lower-High.
Current narrative:
New Daily Demand → Bullish Reaction → 4H Buy-Side Liquidity → Break = Bullish Confirmation
If the 4H Lower-High breaks, it would suggest that this Daily Demand is successfully challenging the existing 4H bearish structure and could open the door for further upside continuation.
If the High holds and the 4H bearish structure remains intact, the original downside narrative remains relevant, with the extreme Daily Demand still acting as the deeper area of interest.
This is an important part of maintaining a market narrative:
The original analysis doesn't need to be abandoned simply because new information appears. Instead, the new information should be incorporated into the analysis and allowed to change the probabilities.
The market is constantly providing new information.
Don't force the original forecast. Update the narrative when the structure changes.
DAIFX Market Lesson
Analysis is a process, not a prediction that must remain unchanged. The original analysis identified the extreme Daily Demand. A new Daily Demand has now appeared as an area of reaction.
The next confirmation point is the 4H Lower-High.
If that high breaks, the new Daily Demand has demonstrated strength.
If it fails, the 4H bearish structure remains valid.
Let price prove which narrative is developing.
DAIFX | Precision • Discipline • Consistency.

 Long
Long
BTC/USD Daily Supply Zone Rejection & Bearish Divergence ShortThe daily BTC/USD chart shows a clear, technically aligned short setup driven by several confluence factors.
Technical Setup Breakdown
Supply Zone Rejection: Price swept liquidity near $83,923 before printing a daily lower high around $82,544 right at the proximal border of the HTF supply zone.
Volume & RSI Divergence : While price pushed upward into the high, both on-balance volume bars and the RSI (14) printed lower highs, confirming exhaustion and institutional distribution at resistance.
Fibonacci & Target Mapping: Target Price ($73,163) sits right below the $0.382 Fibonacci retracement level ($74,639), targeting the dynamic liquidity pool sitting before the $0.5 ($72,266) and $0.618 ($69,893) levels.
Break-Even Rules: Once price hits the first local pivot low (~$77,000), lock in partial profits or move SL to EP to protect capital against sudden volatility spikes.
Invalidation: A daily candle close above $82,544 invalidates the bearish bias and signals potential continuation toward $85,000+.
#BTCUSD #Forex #TechnicalAnalysis #PriceAction #BearishDivergence #RSIDivergence #Fibonacci #Resistance #ShortSetup #TradingSetup #ForexTrading #Sarmaaya.pk  Short
Short
LINKUSDT BREAKOUT INCOMING?Yello, Paradisers! Are LINK traders about to get caught on the wrong side just as the market is preparing for a much stronger move?
💎LINKUSDT is currently trading directly inside an important 15-minute support zone around $12.65–$12.78, and this is where things are starting to get interesting. Despite the short-term weakness, the broader structure remains constructive, with the weekly, daily, and 4H timeframes still bullish, while the 1H remains bearish.
💎Price has been compressing inside a falling wedge, and we are now seeing LINK testing the lower part of this structure while buyers continue defending the nearby support. Falling wedges are generally considered bullish reversal structures, but confirmation is everything. We do not want to anticipate the breakout before the market proves it.
💎More importantly, momentum is beginning to tell a different story than price. While LINK has been making lower lows, the MACD is forming a bullish divergence, showing that bearish momentum is gradually weakening. This does not guarantee an immediate reversal, but combined with the support zone and falling-wedge structure, it creates an increasingly interesting bullish setup.
💎The first major confirmation would come from a sustained breakout above the descending resistance of the wedge. From there, LINK could begin targeting the nearby liquidity areas before challenging the important 1H resistance around $13.10.
💎If buyers successfully reclaim that level, the probability of continuation toward the major daily resistance around $13.63–$13.72 would increase significantly. That is the area where we would expect another serious battle between buyers and sellers.
💎However, there is one level that cannot be ignored. A confirmed candle close below approximately $12.45 would invalidate this bullish scenario and tell us that sellers remain firmly in control. Until that happens, the current support structure deserves close attention.
💎This is exactly the kind of situation where patience matters more than prediction. The setup is developing, but professional traders wait for confirmation instead of gambling on what they hope the market will do.
Strive for consistency, not quick profits. Treat the market as a businessman, not as a gambler. Discipline, patience, and proper risk management are what keep you inside the winner circle.
MyCryptoParadise
iFeel the success🌴  Long
Long
FETUSDT Bulls Are Taking Control, Is the Next Breakout Coming?Yello, Paradisers! could FETUSDT be preparing for its next bullish expansion before most traders notice what is happening?
💎FETUSDT is currently showing a bullish structure, supported by a P-shaped profile on the Fixed Range Volume Profile. At the same time, the price action on the 1H timeframe can also be interpreted as a potential bull flag, which strengthens the bullish scenario.
💎Looking at the higher timeframes, the weekly, daily, and 4H structures remain bullish. However, on the 1H timeframe, we are still waiting for a confirmed bullish CHoCH. That confirmation would significantly increase the probability of continuation and give us a cleaner signal that buyers are taking control again.
💎On the MACD, we can also identify a potential hidden bullish divergence between price and momentum. This supports the broader bullish outlook, but in the short term, a pullback is still possible.
💎Ideally, we want to see price retrace toward the daily resistance become support zone. If buyers successfully defend it and price confirms acceptance above the level, the probability of a bounce and continuation toward the liquidity above will increase.
💎For the upside targets, the main areas of interest are the liquidity levels sitting above the current price, together with the daily and weekly resistance zones around $0.1904 and $0.2118.
💎For invalidation, the setup becomes significantly weaker if price closes below the main support zone. With a reasonable buffer, the invalidation level can be placed around $0.1395. A candle close below this level would be required before considering the bullish scenario invalidated.
The current structure looks good, but there is no reason to rush. The best opportunities come when the higher-timeframe direction, lower-timeframe confirmation, and key support levels all align. Stay disciplined, wait for confirmation, and let the market prove the setup before taking unnecessary risk.
MyCryptoParadise
iFeel the success🌴  Short
Short


