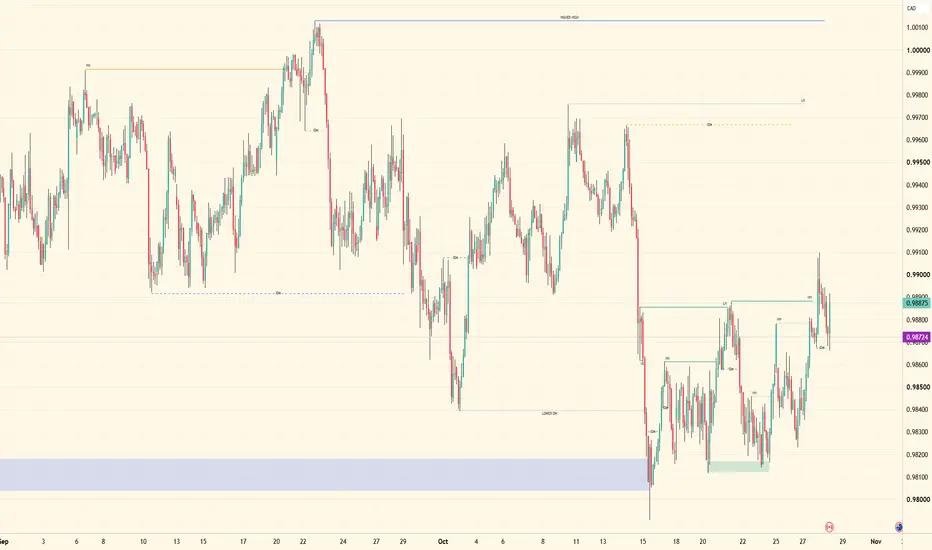
**CADJPY — Tracking the Footprints 🇨🇦**
Price continues to deliver toward the midterm highs, keeping the bullish continuation in focus.
I’m tracking a potential continuation add-on after the lower-timeframe internal inducement is taken to confirm the minor structure high, followed by a corrective move into the thin green lower-timeframe zone beneath price.
Until that distribution develops, I’m sitting on my hands and letting price come to me.
Once price reaches the zone, I’ll look for a candle-range shift and a lower-timeframe mar
Multiple Time Frame Analysis
GBPAUD 4H | FSSM Type 1 | Bullish SetupGBPAUD is presenting a potential Fiblance Swing Structure Model (FSSM) Type 1 bullish setup.
Following a bullish 4H structural break, price is retracing towards the marked 50% level, presenting a potential continuation opportunity supported by the higher-timeframe AOI.
Bias: Bullish Primary Model: FSSM Type 1 Entry Zone: 1.9050–1.9060 Target: 1.9373 region Invalidation: Sustained acceptance below the marked bullish AOI (1.8890).
No confirmation = No trade.
PLAN YOUR TRADE | TRADE YOUR PLAN
NOW | Stock | Oct -Q4 2026 | Day ChartServiceNow, Inc. | "engages in the provision of an end-to-end workflow automation platform for digital businesses. Its Now Platform is a cloud-based solution embedded with artificial intelligence (AI)"
Is this stock "in play"?
Rel Vol (1w) .85 we're .6 the way through the week at close today so .85 / .6 = 1.4 approx Rel vol at close on Fridee.
Is stock profitable? EPS dil TTM = $1.60
Is stock under/over valued? P/E = - forward P/E estimates are around 30.5
With $4.43 FCF per share TTM and
Underwhelming Bitcoin rally to $115 - 118k, October 2025SYMBOL: COINBASE:BTCUSD | DIRECTION: LONG NEAR TERM, SHORT THEREAFTER | TIMEFRAME: 12-Day
Published: October 2026
Yes, underwhelming. With all serenity, a 42% move in a raging bull market is background noise. Equivalent to the noise a mouse expels on its last breath having caught that unlucky third wheel while positioned between the Fiat 500 Trike’s oncoming headlights.
42% is a return collected multiple times over the past few months on selected Ww stock positions, yet few raised an eye
GBPJPY LONGMarket structure bullish on HTFs DH
Entry at both Weekly and Daily AOi
Weekly Rejection at AOi
Daily Rejection at AOi
Previous Structure point Daily
Around Psychological Level 210.000
H4 Candlestick rejection
Rejection from Previous structure
TP: WHO KNOWS!
Entry 95%
REMEMBER : Trading is a Game Of Probability
: Manage Your Risk
: Be Patient
: Every Moment Is Unique
: Rinse, Wash, Repeat!
: Christ is King
US Midterm Elections: A Potential Turning for the Bull MarketThe US midterm elections will take place on November 3, 2026. As the election approaches, uncertainty is building in financial markets, particularly around AI-related companies, semiconductor manufacturers and rising US Treasury yields.
Market sentiment has deteriorated in recent weeks. The CNN Fear & Greed Index recently fell to 21, signalling extreme fear, while the AAII Investor Sentiment Survey shows an elevated share of bearish investors. Historically, periods of extreme pessimism have som
Brent Crude Oil | Three Nested 1–2 Structures or a Leading Diago⏱️ Reading time: Approximately 3 minutes
The 4-hour Brent crude oil chart presents two structural interpretations, each outlining a distinct path for the market's next move. The difference lies in the wave count and the nature of the price action that follows.
Bullish Case — Three Nested 1–2 Structures
In the bullish count, the market is developing three nested 1–2 structures across different wave degrees. If this formation completes as counted, it sets the stage for a powerful impulsive adva
DEO - Cup in a Cup (Multi-timeframe)Now we just wait for the final LTF handle (as part of the current HTF handle that's being completed).
One of the best setups out there as it's essentially just creating buy-side liquidity at different levels/different time frames.
Not rushing to jump in as volume is extremely low right now - Going to wait to see some buyers step in or at least proof of seller failure with them unable to push lower. Ideal entry for me is around $90
Happy Trading :)
CEG - Too good to buyWith the news of a $5 Billion government contract signed, this is set up to easily break to ATH's - When it's ready.
But the market works in mysterious ways and we will likely see some shakeouts and upside failures before the real take-off.
With earnings approaching and likely to be a very positive report, I'm waiting for a better opportunity here - ideally only after we've taken out LTF liquidity below $245 and reclaimed $250 again.
In my world, definitely better to wait here than jump the g
AUDCAD | Published Idea
Price action is getting interesting here, and I can see how this structure could be tricky to read at first glance. I’ve been tracking the footprints and monitoring how price has been developing within the broader range.
Higher-timeframe structure remains bullish. However, after the intraday range was violated through a break of its major higher low, price began reaching for deeper higher-timeframe liquidity. With the dotted blue liquidity level to the left already taken, my attention shifted
EURJPY | Published Idea
Higher-timeframe structure remains bullish. Price mitigated the remaining wick area within the higher-timeframe range, allowing me to refine the area of interest and get a clearer read on the intermediate structural picture.
From here, I’m waiting for the key midterm lower high to be broken with a decisive candle close. That would confirm bullish intent and help re-establish bullish structure from the midterm perspective.
Until that break occurs, I’m letting price develop without forcing a di
GBPNZD | Price Action Update
Price action has done some interesting things following the mitigation of the midterm order block, delivering aggressive bullish displacement. That move was sharp, and I’m still tracking the footprints to understand what price is building here.
Following that bullish displacement, price broke the lower-timeframe external lower high, confirming a shift in the lower-timeframe structure. Now I’m watching how price responds from here.
**Scenario 1 — Bullish continuation after a deeper pullback*
## GBPAUD | Focus Idea
Higher-timeframe structure remains bearish, with price respecting the dominant orange structural range. After mitigating the thin orange supply zone above, price delivered bearish price action, with lower\-timeframe setups continuing to support the bearish flow\.
Currently, both buy-side and sell-side liquidity remain within the dominant bearish range, leaving two areas of interest as price develops.
**Scenario 1 — Bearish continuation**
If bearish momentum continues to deliver price lowe
UBER - This could get excitingLast week we broke down below an important liquidity level and at the same time out of a multi-year trendline (on rising volume).
The bad news - that .
The good news - a reclaim of that would be an extremely bullish signal.
With earnings coming up, anything can happen, and it could/will happen quickly.
That $69 level is surely to be a factor in whichever way we go.
Let's hope to get some bullish confirmation before then!
Happy Trading :)
Brent Crude Oil: Is a New Supercycle Advance Taking Shape?Reading time: 3 minutes
Structure, Not Prediction
Global markets reflect the world we live in. Production, supply, demand, economic decisions, geopolitical tensions, and human behavior all contribute to the price movements we observe. Whether oil becomes more expensive or cheaper, the market must travel through a structure shaped by these forces.
Our task is not to predict the future with certainty, but to interpret the market’s language through the Elliott Wave Principle.
The Bullish Case:
USDCHF: Overbought Market & Pullback 🇺🇸🇨🇭
USDCHF reached a key horizontal resistance level.
I think that the price will likely retrace from it as the market turned too overbought.
Goal - 0.8295
❤️Please, support my work with like, thank you!❤️
I am part of Trade Nation's Influencer program and receive a monthly fee for using their TradingView charts in my analysis.
XAU/USD 28 October 2026 Intraday AnalysisH4 Analysis:
-> Swing: Bullish.
-> Internal: Bearish.
Bias and analysis to remain the same as analysis dated 30 June 2026.
Price did not print bullish CHoCH to indicate bullish pullback phase initiation. Price instead printed a new low followed by a bullish CHoCH
Price is currently trading within and established internal range, however, I will continue to monitor price with respect to depth of pullback.
Intraday expectation:
Price to trade up to either premium of internal 50% EQ, or
USDJPY 4H: Will This Fresh Supply Zone Hold Under Pressure?Market Structure: Drop–Base–Drop | Fresh Supply Zone
On the 4-hour (240M) chart, USDJPY is approaching a fresh supply zone formed by a Drop–Base–Drop (DBD) structure. This area is being observed because the preceding bearish move suggests a potential imbalance between buying and selling pressure.
🔍 Why Is This Zone Technically Significant?
A Drop–Base–Drop structure develops when price declines, consolidates briefly, and then continues lower. The base preceding the second decline can mark
**EURGBP — Tracking the Footprints 🇪🇺🇬🇧*
Bullish framework remains in focus.
Price has dug deeper into discount within the higher-timeframe range, prompting me to reposition the blue zone to capture the deeper wick coverage from a higher-timeframe perspective.
Now I’m waiting for confirmation. The focus is on the midterm/intermediate structure and a break of the lower high to signal a potential shift in direction.
Until that happens, I’m monitoring the tape, tracking the footprints, and allowing price to show its hand. The bullish
**EURUSD — Tracking the Footprints 🇪🇺**
Structure remains bearish here.
Price traded into the near-term order block, the ozone around the center bar, before delivering a lower-timeframe move all the way down toward the recent low.
I’m tracking the potential continuation and looking to catch the last bit of juice before price reaches for that low. Once that liquidity is taken, I’ll reassess the mapping and look for the next sequence.
For now, I’m watching buy-side liquidity and how price responds around the thin green lower-timefra
GBPJPY — Tracking the Footprints 🇬🇧🇯🇵
Midterm structure remains bullish. Price mitigated the origin of the blue zone on the left, and from there, we’ve been climbing and tracking the bullish footprints.
Last week, price broke the intermediate-structure lower high, reinforcing the bullish framework. Since then, price has distributed back into the range, taking out the internal leg and intermediate-structure liquidity before delivering into the current order zone.
With that zone now mitigated, I’m watching the lower-timeframe struc