Long
Long
 Long
Long
Gold Breaks the 200 SMA: Is a PRZ Reversal Coming Next?Gold ( OANDA:XAUUSD ) has finally broken above the Descending Channel and the 200_SMA(Daily), confirming an important technical breakout.
However, the price is now approaching the Potential Reversal Zone(PRZ) and the upper trendline of a potential Ascending Channel.
Can gold extend its rally, or is a corrective move about to begin?
Technical Analysis
Gold is currently trading near the Potential Reversal Zone(PRZ), where the upper trendline of the potential Ascending Channel could create additional selling pressure.
From an Elliott Wave perspective, gold appears to be completing main wave 5 inside the PRZ, suggesting that a corrective phase could begin soon.
💡 Educational Note: After the completion of a Five-Wave Impulsive Structure, Elliott Wave theory generally expects a corrective phase before the next major directional move.
A decline from this area could also act as a pullback toward the recently broken Descending Channel and the 200_SMA(Daily), allowing gold to retest these important breakout levels.
I expect gold to start declining from the PRZ and move at least toward $4,547.230.
Trade Setup
Take Profit(TP): $4,547.230
Stop Loss(SL): $4,727.000
Key Trading Level: $4,520
Do you think gold will start a correction from the PRZ?
🔴 Yes
🟢 No
📌 Gold Analysis(XAUUSD), 4-hour time frame
🛑 Always use proper risk management and set a Stop Loss(SL) for every position.
🚀 If this analysis helps your trading plan, a BOOST would help more traders discover it.  Short
Short
Bitcoin: Local Channel Under ObservationBitcoin price action is currently consolidating following its recent rally, with price trading within a defined local channel. Both the upper and lower boundaries have been tested on multiple occasions, suggesting that these levels are being closely observed by market participants.
At present, Bitcoin is trading around the middle of the channel and moving toward the lower boundary, which also represents a potential area of technical support. This region is important because a number of technical factors are converging around the same area. Rather than assuming a particular outcome, the reaction to this support could provide more information about the short-term structure.
A sustained bullish reaction from support could indicate that buyers remain active within the current range and may increase the possibility of a move back toward the middle or upper portion of the channel. However, this would still need to be confirmed through subsequent price action.
Conversely, a decisive move below channel support could weaken the current structure and suggest that the consolidation pattern is changing. Traders may therefore focus on how price behaves around this level rather than anticipating a specific direction.
For now, the key consideration remains whether support holds and how Bitcoin responds to this area of confluence.
-----------------------------------------------------------------------------------------------
Don't invest unless you're prepared to lose all the money you invest. This is a high-risk investment and you should not expect to be protected if something goes wrong. Take 2 mins to learn more: coinjar.com
The article is an opinion expressed by the author at a point in time and does not represent the views of CoinJar UK Limited or CoinJar Australia Pty Ltd. Take care to consider the date of this article and be aware that this opinion is based on circumstances at the time of publishing. No responsibility or liability is accepted for any errors of fact or omission expressed therein. Past performance is not a reliable indicator of future results.
This above article is not to be read as investment, legal or tax advice and it takes no account of particular personal or market circumstances; all readers should seek independent investment advice before investing in cryptocurrencies.
We recommend you obtain financial advice before making a decision to use your credit card to purchase cryptoassets or to invest in cryptoassets.In the UK, it's legal to buy, hold, and trade crypto, however cryptocurrency is not regulated in the UK. It's vital to understand that once your money is in the crypto ecosystem, there are no rules to protect it, unlike with regular investments.
You should not expect to be protected if something goes wrong. So, if you make any crypto-related investments, you're unlikely to have recourse to the Financial Services Compensation Scheme (FSCS) or the Financial Ombudsman Service (FOS) if something goes wrong.
----------------------------------------------------------------------------------------------  Long
Long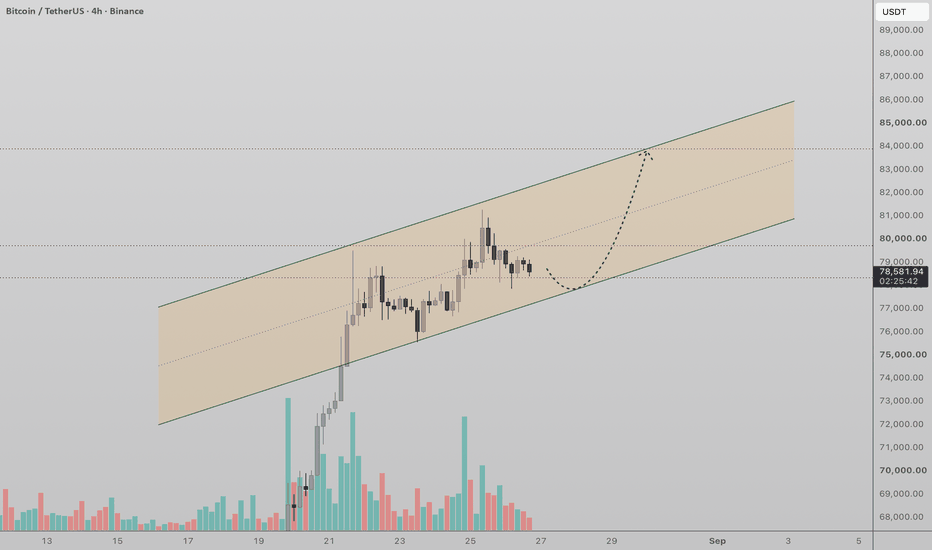
GOLD - Consolidation. The trend may continueICMARKETS:XAUUSD is correcting from its 15-week highs on Tuesday amid a stronger dollar and heightened geopolitical tensions. The local bullish trend remains intact
The Dollar Index is forming a counter-trend correction, which is putting some short-term pressure on gold. The correction appears temporary, supported by easing rate expectations and technical support. The market is waiting for new signals
Drivers:
Downside: conflict escalation, higher oil prices and a stronger dollar, hawkish Fed signals.
Upside: weaker dollar, easing geopolitical risks, lower yields, dip-buying
Resistance levels: 4,680, 4,700, 4,720
Support levels: 4,630, 4,600
The local trend remains bullish. Gold is undergoing a corrective phase to build momentum ahead of a potential continuation higher.
Areas of interest: 4,720–4,775
Consolidation above 4,630 could become a technical catalyst for further upside toward the stated targets
Best regards,
R. Linda. Long 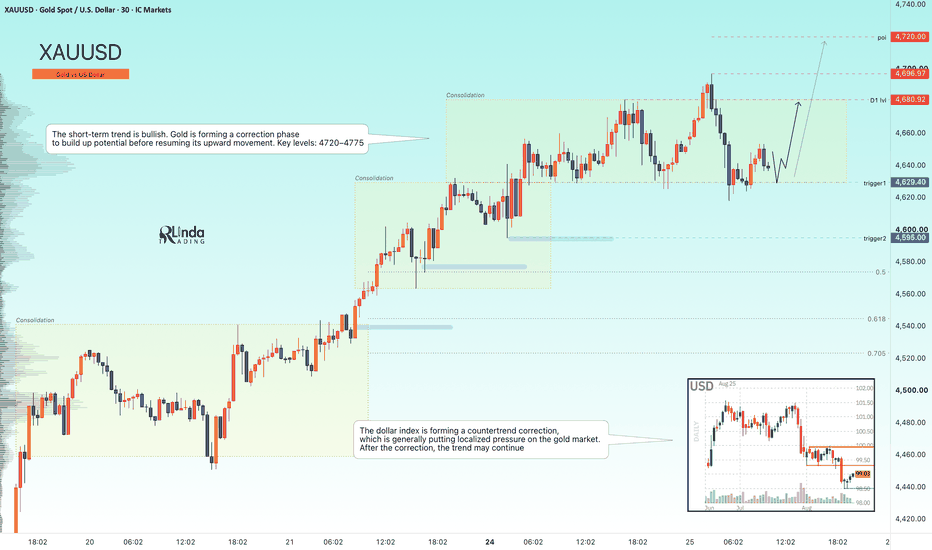
SNDK Pulled Back... Is the Next Stop New ATHs?First off, we see a descending parallel channel on the chart. This channel was broken to the upside on August 12, 2026. Furthermore, the 1.5 extension level of the parallel channel (marked with dotted lines above the channel) —which could have otherwise maintained the downtrend—was strongly broken on August 14, 2026. It was later tested on August 24, 2026, where the price held above without re-entering the channel and bounced upward. This zone also coincides with a key support level, which provided additional bullish reaction.
So, what’s next? Our first price target is the resistance zone between 1943 and 1830 , a region that has historically shown strong price reactions; we could close around 75% of our positions here. After that, we might see pullbacks down to the 1686 level. Beyond this point, depending on market catalysts, the price could test new ATHs , offering an ideal zone for profit-taking.
⭐️SNDK Pulled Back
⭐️Is the Next Stop New ATHs?🚀
ℹ️4h time frame
-icttrdr  Long
Long
 Long
Long
 Long
Long
BTCUSDT Short: 78,4K Rejection Keeps Short-Term Bearish ScenarioHello traders! Here’s my technical outlook based on the current BTCUSDT (4H) chart structure. BTCUSDT previously traded inside a descending structure before breaking above resistance and shifting bullish. Price then formed an ascending channel and moved toward the 78,400 Supply Zone, where sellers rejected the upside.
Currently, BTCUSDT is trading below 78,400 while holding above the 75,000 Demand Zone and channel support. The rejection suggests a possible short-term correction.
As long as BTCUSDT remains below the 78,400 Supply Zone and respects the current resistance structure, the bearish scenario remains valid. A rejection from current levels could push price toward the 75,000 Demand Zone (TP1). However, a breakout and close above 78,400 would weaken the bearish outlook and increase the possibility of further upside. Manage your risk! Short 
Long 
BTCUSDT Successful Support Retest Opens the Path Toward $79,500Hello traders! Here’s my technical outlook based on the current BTCUSDT (1H) chart structure. BTCUSDT previously traded inside a descending channel before breaking above the resistance line and shifting bullish. Price then formed a range and broke higher toward the 79,500 Seller Zone, where sellers may defend the upside. Currently, BTCUSDT is trading below the 79,500 Seller Zone while holding above the 76,200 Buyer Zone and rising trend line. The strong breakout and continued bullish structure suggest that buyers remain in control. As long as BTCUSDT remains above the 76,200 Buyer Zone and respects the rising trend line, the bullish scenario remains valid. A successful retest of support could push price toward the 79,500 Seller Zone (TP1). However, a breakdown and close below 76,200 would weaken the bullish outlook and increase the risk of a deeper correction. Please share this idea with your friends and click "Boost" 🚀 Long 
AMD Stock Analysis: $390, $600 and $770 Levels to WatchAMD's business is still growing quickly, while its long-term stock chart has entered a different phase. Revenue increased 50% year over year in the latest quarter, Data Center revenue more than doubled, and AMD is guiding for roughly 41% year-over-year revenue growth next quarter. The fundamental backdrop remains strong. On the chart, however, AMD has already broken a long-term structure that had guided the stock for years.
AMD's Long-Term Channel
AMD spent most of its advance from the 2015 lows inside a large rising channel. Price tested the lower side of that channel in 2022, although that break was difficult to treat as decisive. The move in 2025 was much clearer, with AMD falling below the lower boundary before recovering sharply.
The stock has since climbed back to new highs, but the old channel no longer provides the same support structure. That changes how I read the current AMD chart. The focus now shifts to the major price areas around the stock and to the structure of the recovery from the 2025 low.
The Weekly AMD Structure
The weekly chart shows the recent sequence in more detail. AMD peaked in 2024, fell into the 2025 low and then recovered strongly enough to move above the previous high. From an Elliott Wave perspective, that recovery can still develop further, although the stock is already trading much higher inside the current structure.
AMD is now approaching an area where the next large move should become easier to read. The current price is around $456, with an important upper area near $600 and a lower boundary near $390. Those two levels define the part of the chart I am watching most closely.
AMD Stock Analysis: $390 to $600
AMD is currently trading inside the $390-$600 area. Price has already reached as high as roughly $585, so the upper boundary has become relevant after the recent rally. A move through $600 would take AMD above the entire current price cluster and extend the recovery from the 2025 low.
The lower side of the same area sits around $390. AMD can move considerably inside this range without changing the larger structure. A sustained move outside either boundary would carry much more information than the smaller fluctuations taking place between them.
$600 — the main upper boundary of the current price cluster.
$390 — the lower boundary that keeps the current structure intact.
$770 — the next higher area from the current Elliott Wave relationships if AMD moves above $600 and holds there.
$190-$260 — the next major lower cluster if AMD falls below $390 and remains below it.
What Happens Above $600
If AMD makes another higher high, moves above $600 and stays above that area, the current wave structure leaves room for another leg higher. The next level I would watch is around $770. That area comes from the larger Elliott Wave relationships visible on the weekly chart.
The behavior after the breakout will matter as much as the initial move above $600. AMD has already shown large swings during the last several years, including sharp reversals after strong advances. Holding above the upper boundary would give the move considerably more weight.
What Happens Below $390
A break below $390 would change the current setup. The chart has relatively little major structure between that level and the next large price cluster around $190-$260. If AMD moves below $390 and remains there, that lower area becomes much more relevant.
This would also mark a significant change from the recovery that began at the 2025 low. Until then, $390 remains the lower boundary of the structure I am following.
AMD Levels to Watch
AMD currently sits between two major levels. The stock has recovered strongly from its 2025 low and reached a new all-time high, while the long-term channel that contained the earlier advance has already been broken. The next useful information should come from price behavior around $600 or $390.
Above $600, the current structure can extend toward the next major area around $770. Below $390, attention shifts toward the $190-$260 cluster. I will update the AMD analysis when price moves through one of these boundaries and shows that it can hold there.
 Long
Long

 Long
Long
Long 
The Linear Fit: Reading Trend Through Regression● 📐 The Conceptual Origin
- The practice of drawing a channel around price action traces its intellectual lineage back to the earliest attempts by technical analysts to impose statistical order on what appears, at first glance, to be chaotic movement. Long before computers could calculate regression coefficients in real time, chartists were already drawing trendlines by hand, connecting swing highs and swing lows in an effort to visualize the underlying drift of a market. The conceptual leap from a hand-drawn trendline to a statistically fitted regression channel represents a maturation of this instinct, replacing subjective eyeballing with an objective least-squares fit that minimizes the distance between a proposed line and the actual closing prices observed over a given window.
- At its philosophical core, this approach rests on a single, powerful assumption borrowed from classical statistics: that price, over a sufficiently constrained window of time, behaves as a linear function of time plus a random error term. The regression line is the trader's attempt to isolate that linear signal from the surrounding noise, while the dispersion of prices around that line, typically measured in standard deviations, becomes a proxy for the magnitude of the noise itself. This is not merely a charting convenience; it is an implicit adoption of the same logic used in econometrics when analysts attempt to decompose a time series into trend and residual components.
- The decision to bound the regression line with deviation bands introduces a second and equally important intellectual tradition, namely the concept of statistical confidence. A channel is not simply a line; it is a probabilistic envelope. By selecting a specific z-score multiplier, the architecture is making an implicit claim about how much of the observed price distribution should fall within the bounds under a normal or near-normal distribution assumption, echoing the same reasoning that governs confidence intervals in inferential statistics.
● 📊 Narrative Technical Analysis
- The technical mechanics of this concept begin with the identification of structural pivot points, which serve as the anchors from which a fresh regression attempt is launched. A pivot high or pivot low is, in essence, a local extremum validated by a symmetric lookback and lookforward window, and its role here is to mark the moment when the market's short-term character shifts enough to warrant a new structural regression milestone. Rather than fitting a single rigid line across the entire visible history, the underlying logic treats each pivot as a potential inflection point, a candidate origin for a brand-new best-fit segment that only becomes structurally valid once a minimum bar count and a minimum correlation strength have both been satisfied.
- Central to this narrative is the Pearson correlation coefficient, which functions as a real-time referendum on the quality of the linear fit. A coefficient close to unity in absolute value indicates that price has been moving with unusual discipline along a straight trajectory, while a coefficient closer to zero signals that the market has entered a phase of directional ambiguity where a linear model simply fails to capture what is happening. This creates an elegant self-diagnosing mechanism: the model does not merely draw a channel, it also reports on its own confidence in that channel, distinguishing a high-conviction structural trend from a weak, noise-dominated drift.
- Consolidation box mapping enters the narrative through the behavior of the channel during periods when the correlation coefficient degrades. When the linear fit weakens, the channel visually compresses into something resembling a horizontal container rather than a sloped corridor, and this transition itself becomes informative. A trader reading the narrative correctly understands that the flattening of a regression channel is often the technical fingerprint of accumulation or distribution, a pause in directional conviction that frequently precedes either a continuation breakout or a structural reversal.
- Volume profile anomalies, while not the primary axis of this framework, interact with it indirectly through the standard deviation envelope. A statistically tight envelope combined with an unusually elevated standard deviation on a handful of bars often points toward a volume-driven anomaly, a burst of participation that temporarily distorts the regression's residuals. Sophisticated readers of this kind of channel learn to treat such distortions not as noise to be ignored but as evidence of a shift in the underlying order flow that the linear model is passively recording.
- The optional adaptive smoothing of the underlying price source before the regression is calculated introduces a further layer of nuance. By allowing the input series itself to be pre-filtered through various smoothing philosophies, ranging from simple moving averages to more exotic adaptive constructs, the framework acknowledges that raw closing prices are themselves a noisy proxy for the market's true underlying value, and that a cleaner input can materially improve the quality of the subsequent linear fit.
- Finally, the mechanism by which one regression segment yields to the next, either through a clean truncation at the point of structural break or through a deliberate merger when two adjacent segments share a sufficiently similar slope and standard deviation, mirrors the way an experienced analyst manually redraws a trendline once it has clearly been violated, except that here the redrawing is governed by an explicit, repeatable statistical rule rather than by discretionary judgment.
● 🏛️ Institutional vs. Retail Perspective
- Institutional market participants tend to approach the concept of a statistically fitted channel as one tool among many within a broader quantitative toolkit, most often using it not as a standalone signal generator but as a contextual filter that informs position sizing, hedge ratios, or the timing of larger order execution. For a trading desk managing significant size, the correlation coefficient embedded in the channel is less interesting as a trade trigger and more valuable as a real-time measure of market regime, feeding into execution algorithms that slow down order placement during low-correlation, high-noise conditions and accelerate it during high-correlation, trending conditions where slippage costs are more predictable.
- Retail traders, by contrast, are far more likely to interpret the same channel visually and instinctively, treating the upper and lower bounds as literal buy and sell zones without necessarily internalizing the statistical assumptions that underpin their construction. This divergence in interpretation is itself a rich subject of behavioral finance, since the same mathematical object can be simultaneously a sophisticated regime-detection input for one class of participant and a simplistic support-and-resistance heuristic for another.
- The institutional lens also places far greater weight on the stability of the fit across multiple timeframes simultaneously, cross-referencing a daily regression channel against an intraday one to detect fractal alignment, whereas retail attention is often anchored to a single timeframe in isolation. This difference in analytical horizon explains why institutional desks are generally more skeptical of channel breakouts that occur without confirming structure on a higher timeframe, while retail participants frequently react to the breakout of a single-timeframe channel as if it were sufficient evidence on its own.
- There is also a meaningful difference in how each group treats the moment when the correlation coefficient weakens. Institutional risk management frameworks typically treat a degrading fit quality as an explicit signal to reduce exposure or widen stops, formalizing the uncertainty into a quantifiable risk parameter, whereas retail traders often ignore or fail to notice this degradation entirely, remaining committed to a directional thesis even as the statistical foundation supporting that thesis erodes beneath them.
● ⚙️ Strategic Variance
- In a trending market regime, this class of tool performs closest to its theoretical ideal. Persistent directional price movement produces long, stable pivot-to-pivot windows over which the linear regression achieves a high absolute correlation coefficient, and the resulting channel behaves almost as a self-fulfilling corridor, with pullbacks respecting the lower or upper deviation band and the slope itself confirming the prevailing bias. It is precisely in this regime that the statistical assumptions embedded in the model are best satisfied, since a genuinely linear drift with well-behaved residuals is the textbook condition under which ordinary least-squares fitting produces its most reliable output.
- In a ranging market regime, the framework's behavior changes character substantially. The absence of sustained directional drift causes the correlation coefficient to compress toward zero far more frequently, and the channel itself tends to flatten and widen, reflecting the fact that price is oscillating around a roughly constant mean rather than progressing along a meaningful trajectory. Traders who understand the underlying statistics recognize this flattening not as a failure of the tool but as an accurate diagnostic of a market that has, for the time being, abandoned trend in favor of mean-reverting behavior, and they adjust their strategic posture accordingly, favoring fade-based tactics over breakout-based ones.
- In a high-volatility regime, the standard deviation component of the channel expands rapidly, often outpacing the market's actual directional progress. This produces wide, loosely fitted channels that, while statistically valid, provide comparatively little practical utility for tight risk placement, since the deviation bands can widen to the point where a stop placed just beyond them exposes an unacceptably large amount of capital relative to the position's intended edge. High-volatility regimes therefore test the philosophical limits of any linear framework, since sudden regime shifts, gap risk, and non-normal return distributions all violate the underlying assumptions of ordinary least-squares fitting in ways that a purely mechanical model cannot fully anticipate.
- The transition between these regimes is itself a subject worthy of academic attention, since the moment of regime change, the instant when a market shifts from trending to ranging or from calm to volatile, is precisely when statistical tools of this nature are least reliable, exhibiting a natural lag between the change in underlying market character and the corresponding change in the calculated fit. This lag is not a flaw unique to any single implementation but an inherent property of any backward-looking statistical estimator, and it underscores why prudent practitioners treat such tools as descriptive rather than predictive instruments.
● 🧠 Psychological Architecture
- The trader's relationship with a statistically bounded channel is fraught with a particular cognitive tension between the desire for objective, quantified certainty and the underlying reality that markets remain fundamentally probabilistic. A channel with a numerically stated correlation coefficient carries an air of scientific authority that can lull a trader into treating a moderately strong fit, perhaps in the range of sixty to seventy percent, as functionally equivalent to certainty, when in fact a substantial portion of price variance remains unexplained by the linear model.
- Confirmation bias plays an outsized role once a trader has committed to a directional thesis based on a channel's slope. Having formed a bullish or bearish expectation, the trader becomes psychologically predisposed to notice subsequent price action that respects the channel boundaries while discounting or rationalizing price action that violates them, effectively cherry-picking evidence that supports the original thesis and undermining the very objectivity that drew them to a quantitative tool in the first place.
- The moment when fit quality deteriorates presents a particularly acute psychological challenge, since it requires the trader to voluntarily downgrade their own confidence in a position they may already hold, a form of cognitive dissonance that many find genuinely uncomfortable to resolve. The natural human tendency is to seek out reasons why the degrading correlation is a temporary anomaly rather than a genuine signal that the market's character has shifted, and this reluctance to update one's beliefs in light of new statistical evidence is one of the more persistent psychological hurdles in quantitative trading generally.
- There is also a distinct emotional dimension to the visual compression and expansion of the channel itself. A narrowing channel during a strong trend can produce a false sense of security, since the tight statistical fit is easily misread as an assurance of continued directional movement, when in reality tight channels are frequently the precursor to a volatility expansion precisely because low realized volatility tends to be mean-reverting over time. Conversely, a wide, loosely fitted channel during high volatility can trigger excessive caution or outright paralysis, even in situations where the underlying opportunity remains statistically sound once properly risk-adjusted.
● 🎲 Risk & Probability Sagas
- The mathematical philosophy underpinning any deviation-based channel is fundamentally an exercise in applied probability rather than deterministic forecasting. Selecting a particular number of standard deviations to bound the channel is equivalent to making an explicit statement about the probability mass one wishes to capture under an assumed distribution, and this choice inherently trades off between the frequency of boundary touches and the statistical significance of a genuine breakout beyond those bounds. A narrower deviation multiplier will flag more frequent excursions, many of which will prove to be noise, while a wider multiplier will flag fewer excursions but grant each surviving signal greater statistical weight.
- This tension between sensitivity and specificity lies at the heart of every probabilistic trading framework, and it cannot be resolved through parameter optimization alone, since the optimal balance is itself a function of the trader's risk tolerance, holding period, and the capital at stake in any given position. A probabilistic risk philosophy therefore demands that the trader think not in terms of whether a given breakout will succeed or fail, but in terms of the long-run expectancy generated across a large sample of similar statistical configurations, accepting that any individual instance carries irreducible uncertainty.
- The assumption of approximate normality in the underlying residuals, while a reasonable first approximation, is itself a simplification that sophisticated practitioners must hold loosely. Financial returns are well documented to exhibit fatter tails than a true normal distribution would predict, meaning that extreme deviations occur more frequently than a naive application of standard deviation bands would suggest. A rigorous probabilistic risk philosophy therefore treats the calculated standard deviation as a useful but imperfect proxy for true dispersion, building in additional margin for the fact that tail events are more common in practice than in theory.
- Ultimately, the deepest philosophical contribution of this style of framework is its reframing of trend and structure as continuous, measurable, and probabilistic properties rather than binary states that either exist or do not. A market is never simply trending or not trending; it exists somewhere along a spectrum of linear coherence, and the correlation coefficient gives that spectrum a numerical anchor. Internalizing this probabilistic worldview, rather than searching for false certainty in any single signal, is arguably the single most valuable intellectual habit a trader can extract from engaging with statistically fitted channel methodologies.
Based on the concepts previously discussed, the SmartFit Trend Channels indicator was developed to reflect the academic and technical principles outlined in this article.
⚠️ Risk Disclaimer
This article is intended for educational and informational purposes only and does not constitute financial, investment, or trading advice of any kind. All discussion of statistical methods, market regimes, and probabilistic reasoning reflects general analytical concepts and should not be interpreted as a recommendation to buy, sell, or hold any financial instrument. Trading and investing in financial markets involves substantial risk, including the potential loss of principal, and past price behavior or statistical patterns are no guarantee of future results. Readers should conduct their own independent research and consult a qualified financial professional before making any trading or investment decisions. Education 
GOLD Rejection from Resistance Could Trigger a Deeper CorrectionHello traders! Here’s my technical outlook based on the current XAUUSD (4H) chart structure. XAUUSD previously traded inside a descending channel before breaking above the resistance line and shifting bullish. Price then rallied toward the 4,640 Seller Zone, where strong selling pressure could appear. Currently, XAUUSD is trading near the 4,640 resistance level while holding above the 4,500 Buyer Zone and the rising support line. The current area may act as a key rejection zone if buyers fail to break and hold above resistance. As long as XAUUSD remains below the 4,640 Seller Zone and faces rejection from this area, the bearish scenario remains valid. A pullback from resistance could push price toward the 4,500 Buyer Zone (TP1). However, a strong breakout above 4,640 would weaken the bearish outlook and open the path for further upside. Please share this idea with your friends and click "Boost" 🚀 Short 
ETHUSDT - Consolidation could trigger further growthBINANCE:ETHUSDT.P remains relatively strong compared to Bitcoin. After a strong rally, the altcoin has entered consolidation near key resistance levels, which is a locally positive setup
Bitcoin is strengthening on the back of recent news and breaking out of its year-long bearish trend. Last week’s session closed favorably, and the lack of a deep correction increases the chances of further upside across the broader market.
After a strong rally and reaching a new high at 2,550, Ethereum has entered a consolidation phase, indicating strong buyer interest in further upside
Resistance levels: 2485, 2550
Support levels: 2423, 2356
Technically, the market could form a local long squeeze around the support zone before continuing higher. However, a breakout and close above 2,485 would open the way for a potential rally toward 2,550–2,620
Best regards,
R. Linda.  Long
Long