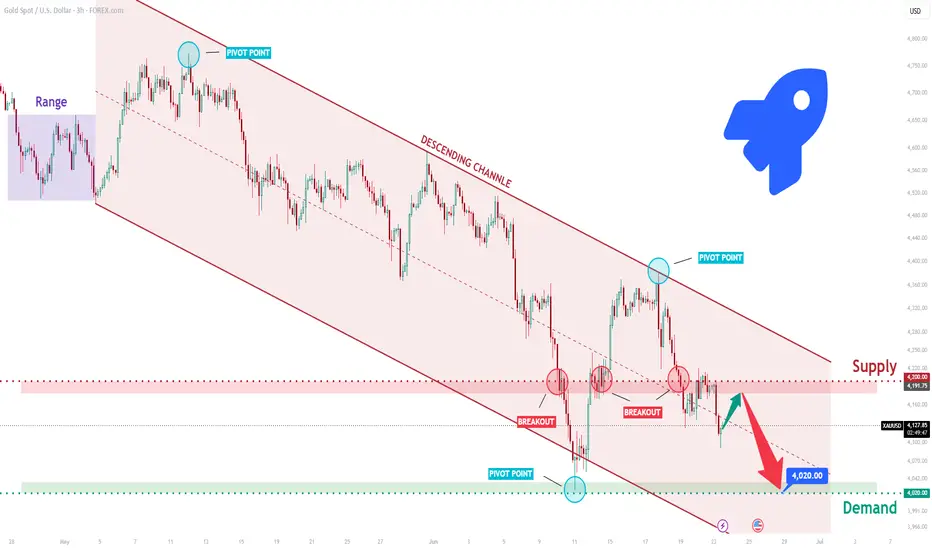
XAUUSD Short: Testing Supply Before Potential Drop to 4,020$Hello traders! Here’s my technical outlook based on the current XAUUSD (3H) chart structure. XAUUSD previously traded inside a well-defined descending channel, where sellers controlled the trend after a major pivot high. Following a bearish breakout below the channel, price dropped sharply and found support near the 4,020 Demand Zone, triggering a recovery phase.
Currently, XAUUSD is trading below the 4,200 Supply Zone after a recent breakdown sequence. Recent attempts to sustain momentum above this supply area have failed, showing that sellers remain active around resistance.
As long as XAUUSD remains below the 4,200 Supply Zone and the broader descending channel structure, the bearish scenario remains valid. A rejection from current levels could push price down toward the 4,020 Demand Zone (TP1). Manage your risk!  Short
Short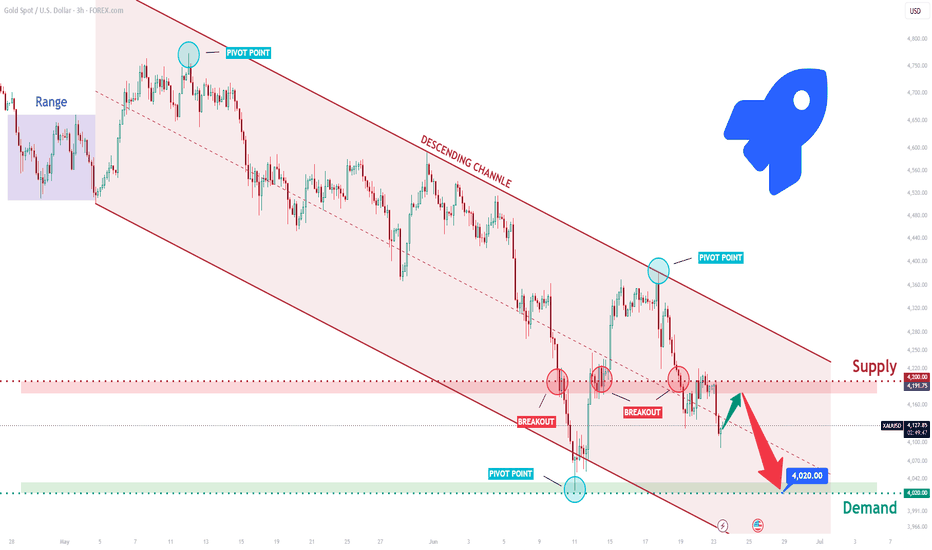
XAUUSD Bears Remain in Control Below Key Resistance, Aim 4,000$Hello traders! Here’s my technical outlook based on the current XAUUSD (1H) chart structure. XAUUSD previously traded inside a descending channel, where sellers maintained control after a strong rejection from the upper range. Following a breakdown below a key consolidation area, price extended its bearish move and continued forming lower highs and lower lows. Currently, XAUUSD is trading inside another descending channel while remaining below the 4,150 Seller Zone. Recent breakdowns from both the range and channel support confirmed persistent selling pressure, while the latest pullback appears corrective rather than a trend reversal. As long as XAUUSD remains below the 4,150 Seller Zone and continues to respect the descending channel structure, the bearish scenario remains valid. A continuation lower could push price toward the 4,000 Buyer Zone (TP1), where buyers may attempt to defend the market. Please share this idea with your friends and click “Boost” 🚀 Short 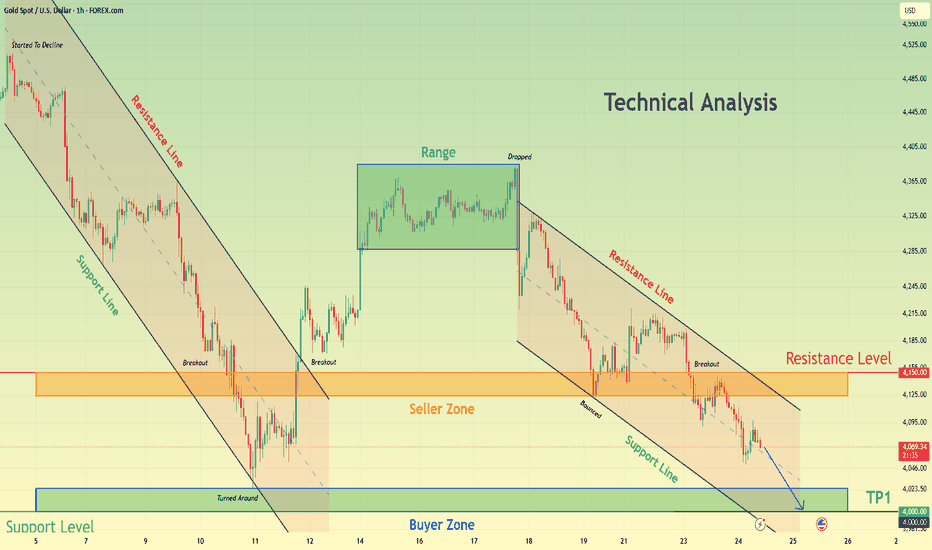
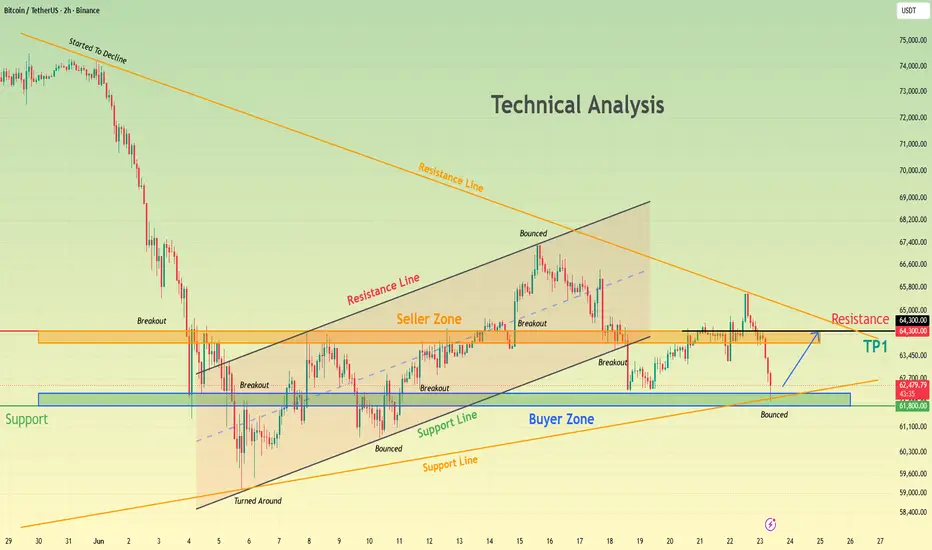
Bitcoin Buyers Step In at Support, Upside Target Remains ActiveHello traders! Here’s my technical outlook based on the current BTCUSDT (2H) chart structure. BTCUSDT experienced a strong bearish decline after breaking down from a major support area and remained under pressure beneath a long-term descending resistance line. After forming a local bottom, price recovered and traded inside an ascending channel, where buyers gradually regained control. Currently, BTCUSDT is trading above the 61,800 Buyer Zone while remaining below the 64,300 Seller Zone. The latest pullback found support inside the demand area, and price is now attempting to stabilize after rejecting lower levels. As long as BTCUSDT remains above the 61,800 Buyer Zone and continues to respect the rising support structure, the bullish scenario remains valid. A bounce from current levels could push price toward the 64,300 Resistance Zone (TP1), where sellers may become active again. Please share this idea with your friends and click “Boost” 🚀  Long
Long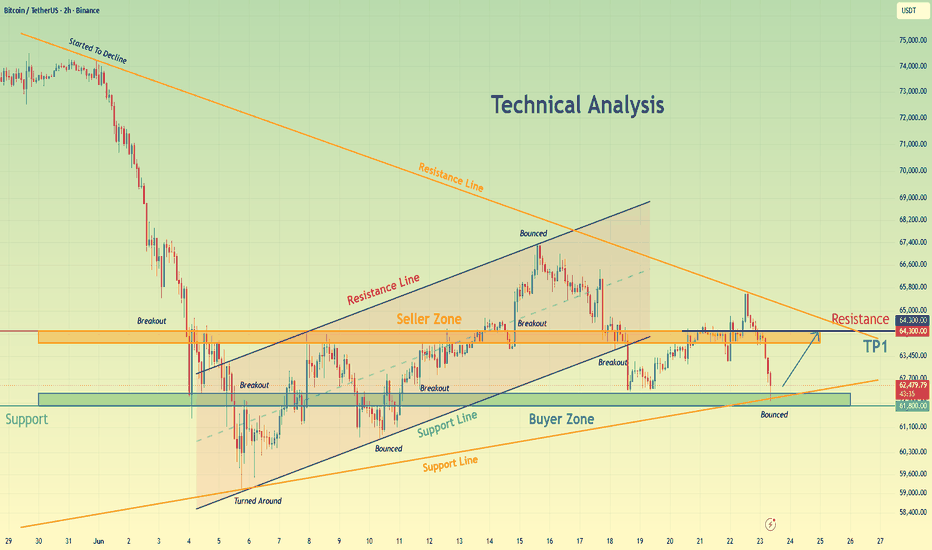
BITCOIN - Consolidation (correction) before the fallBINANCE:BTCUSDT.P remains under pressure. There is no meaningful fundamental support for the market, while the broader bearish trend continues to define the medium-term direction. There are still no clear signs of a market bottom forming
Globally, Bitcoin continues to maintain a bearish trend. Within this trend, the market remains in a consolidation phase with no indications of a reversal. Technically, the downtrend may continue in the medium term.
Fundamentally, the outlook remains weak. Cryptocurrency inflows to exchanges continue, while spot ETF outflows persist. Any attempts to rally are increasingly viewed as potential traps before another leg lower. A retest of 59800 followed by a close below this level would be a strong signal that the market is preparing to move toward 50K
Resistance levels: 63220, 63750
Support levels: 62230, 60750, 59800
Following the distribution phase and the long squeeze below the 62232 support level, a countertrend correction is developing, aimed at hunting liquidity. As part of this correction, Bitcoin may test the 63220–63750 area before resuming its decline. A short squeeze in this zone could trigger a further move lower toward 60800–59800
Best regards,
R. Linda Short 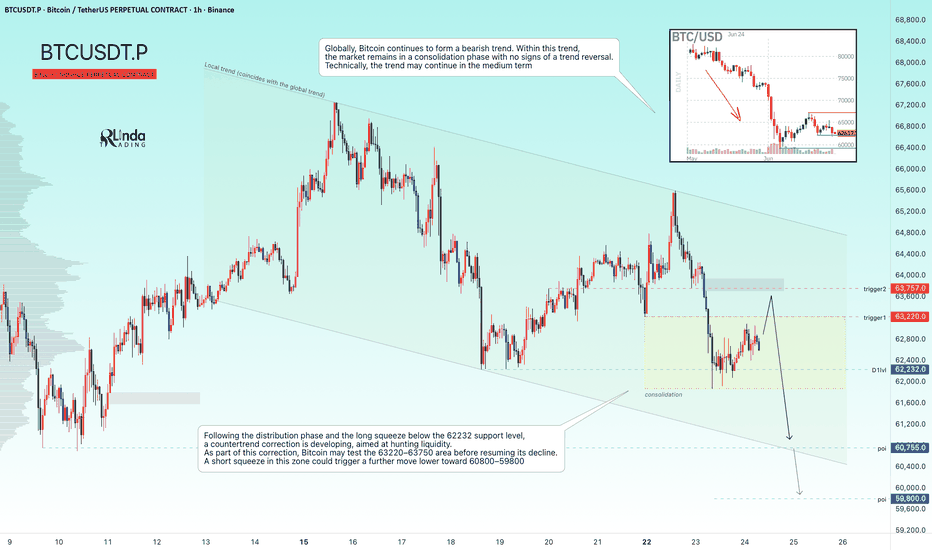
DXY at 125 Loading...DXY stands for Dollar strength, compared against a basket of 6 major currency of the world, of which weights of GBP & EUR when combined accounts for ~70%.
It essentially means when DXY rises, its rising against GBP, Euro.
Historically after most of the major financial events in the world, be it (2008 financial crisis, 2014 Russian financial crisis / Chinese Stock market selloff, 2020 covid-19 Crash). DXY was spotted nearing the support of Rising channel, each time as marked by Green arrows.
Point of attention
Currently DXY is at support of rising channel and getting ready for yet another probable peak by ~2029.
Effects of Rising DXY could be devastating in many ways, If we put is simply, it's like every single trading asset's that are quoted in USD will loose it's value (Gold, Silver, Crude, Forex pairs quoted in USD).
FX pairs with USD as their Base currency can see a rally or at-least bullish biasness for the next few years.
For Educational Purposes only, Not an Investment Advice
Any new perspective you want to share, feel free to mention below in the comment.
Regards CrazyTrades247,
 Long
Long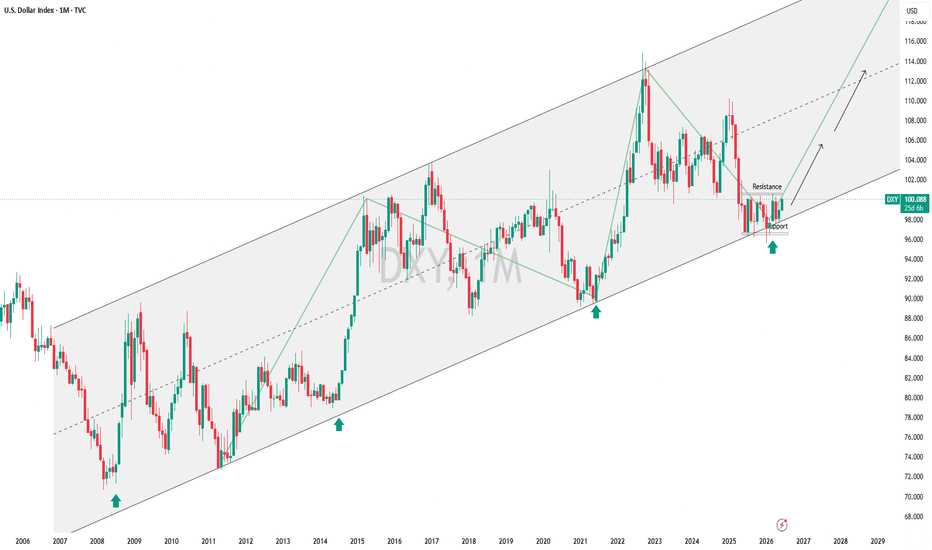
 Long
Long
Short 
 Long
Long
EURUSD: Downtrend Continues as Channel Resistance HoldsHello everyone, here is my breakdown of the current EURUSD setup.
Market Analysis
EURUSD previously traded inside a broad consolidation range after breaking below a major downward channel. Following a temporary recovery, price formed a rounding top pattern near resistance, signaling weakening bullish momentum and a potential trend reversal.
Currently, EURUSD is trading below the 1.1450 Resistance Zone while holding above the 1.1370 Support Zone. A recent breakout below the consolidation structure triggered a new bearish leg, and price continues to move inside a well-defined descending channel, confirming that sellers remain in control.
My Scenario & Strategy
As long as EURUSD remains below the 1.1450 Resistance Zone and continues to respect the descending channel structure, the bearish scenario remains valid. A rejection from current levels could push price toward the 1.1370 Support Zone (TP1).
However, if EURUSD breaks above the resistance zone and exits the channel to the upside, the bearish outlook would weaken and a deeper recovery could develop.
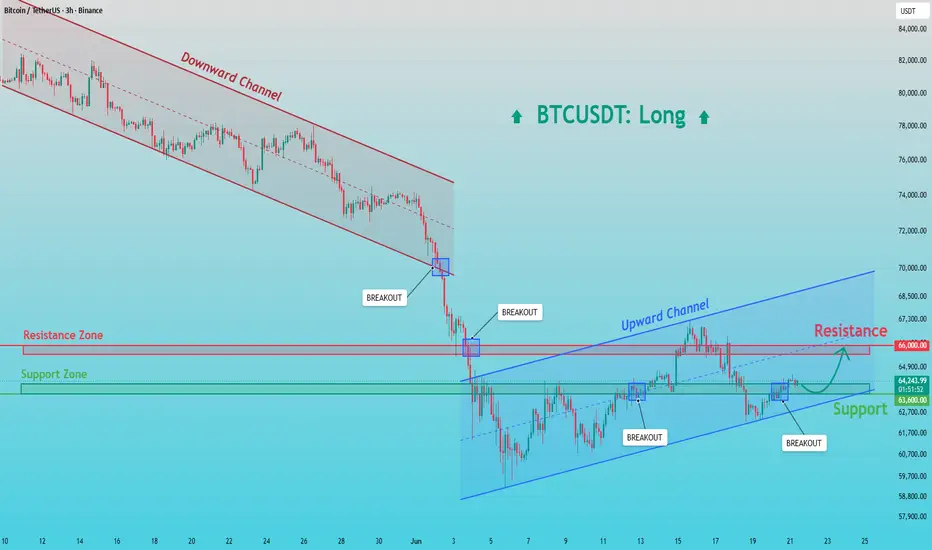
That’s the setup I’m tracking. Thank you for your attention, and always manage your risk. BTCUSDT: Ready for Another Push Higher? 66K Resistance in SightHello everyone, here is my breakdown of the current BTCUSDT setup.
Market Analysis
BTCUSDT previously traded inside a well-defined descending channel, where sellers dominated the market and pushed price steadily lower. After breaking below several key support levels, the decline accelerated before buyers finally stepped in near the local bottom and triggered a strong recovery.
Currently, BTCUSDT is trading above the 63,600 Support Zone while remaining below the 66,000 Resistance Zone. Following the breakout from the descending channel, price formed an ascending channel and continues to print higher lows, signaling that bullish momentum remains intact. The latest pullback found support near the lower boundary of the channel, where buyers are attempting to regain control.
My Scenario & Strategy
As long as BTCUSDT remains above the 63,600 Support Zone and continues to respect the ascending channel structure, the bullish scenario remains valid. A bounce from current levels could push price toward the 66,000 Resistance Zone (TP1).
However, a breakdown below the support zone and channel support would weaken the bullish outlook and increase the risk of a deeper correction.
That’s the setup I’m tracking. Thank you for your attention, and always manage your risk. Long 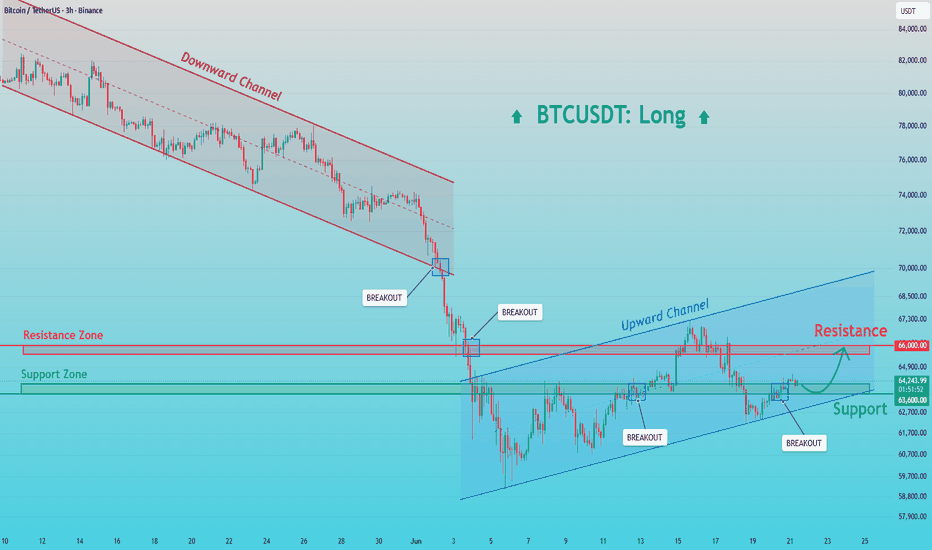
Gold Locked Inside Descending Channel - FVG Hunt Before Weekend The Gold market (XAUUSD) enters the final session of the week under prolonged technical pressure, with bears firmly maintaining full custody of the higher-timeframe order flow. As the market transitions into Friday, trading desks are navigating a unique macroeconomic landscape marked by the US Juneteenth holiday.
With major Wall Street banking institutions and equity markets closed, the market is experiencing a structural liquidity vacuum. During such holiday sessions, retail sentiment often becomes highly vulnerable as institutional market makers withdraw their active books.
Instead of heavy fundamental driving forces, the intraday price action is completely governed by automated algorithmic execution. These trading algorithms are systematically targeting localized structural inefficiencies and resting sell-stops, pushing bullion deeper into discount matrixes before the weekly closing bell rings.
Key Levels
• Channel Resistance: Dynamic trendline
• Current Price: 4,158
• FVG Target: 4,120
• Major Demand Zone: 4,040
Bearish Scenario
As long as price stays below channel resistance, the path toward the 4,120 FVG remains open. A clean break lower could expose the 4,040 demand zone.
Bullish Scenario
Thin holiday liquidity can create violent short squeezes. If buyers defend the FVG area and reclaim structure, a sharp rebound toward channel resistance may follow.
Gold is approaching a major decision zone.
Will smart money fill the 4,120 imbalance first, or trap late sellers before the weekly close? Short 
XAUUSD (H1) | Breakdown Loading or Short Squeeze Ahead?Gold starts the week under pressure as price continues to respect a well-defined descending channel on H1. With no major economic data on the calendar, technical flows and liquidity hunts are likely to dominate short-term price action.
Analyzing the structural alignment on the H1 timeframe, the price action is perfectly respecting the geometry of the Descending Channel boundaries. The core price coordinates on the layout include:
Disabled Overhead Zone: The historical distribution block acting as the ultimate trend invalidation ceiling for near-term buyers.
Major Resistance (Channel Pivot Floor): 4,220.000 – A critical horizontal supply layer and dynamic channel confluence where the recent technical rebound faced an aggressive institutional rejection.
Immediate Psychological Support: 4,128.000 – The localized structural swing low baseline where short-covering algorithms might offer minor temporary consolidation.
Major Liquidity Target (Demand Floor): 4,032.560 (demarcated by the bottom blue baseline) – The primary downside destination and ultimate liquidity pool where massive institutional buy-stops are heavily clustered.
Bearish Scenario
As long as price remains below 4,220, sellers maintain control. A break below 4,128 could open the path toward the 4,032 liquidity target.
Bullish Scenario
If buyers defend the current support zone and trigger a short-covering rally, gold could rebound toward the upper channel resistance.
The structure remains bearish, but low-liquidity conditions often create the biggest traps.
Will gold break down toward 4,032, or squeeze late sellers before the next major move? Short 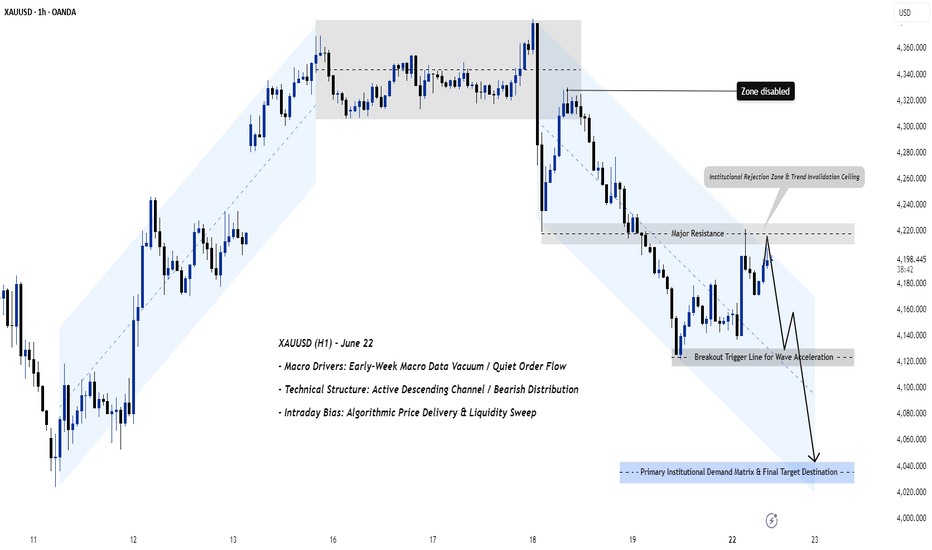
 Short
Short
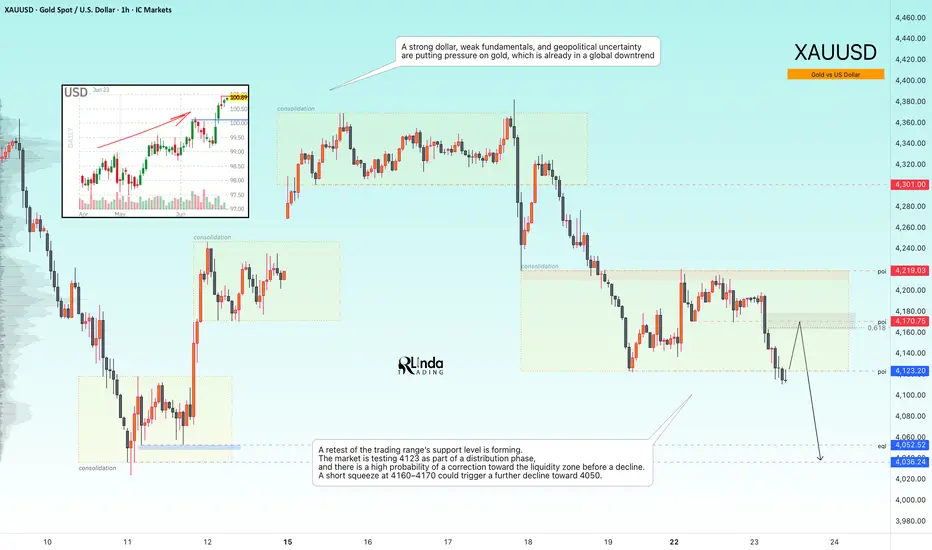
GOLD - A correction before the decline continues toward 4000ICMARKETS:XAUUSD continues to decline and print new lows under pressure from three key factors: a strong U.S. dollar, a weak fundamental backdrop, and ongoing geopolitical uncertainty. In the medium term, the market may remain under bearish control.
Sellers continue to dominate. The dollar remains strong, while expectations of a Federal Reserve rate hike continue to pressure gold as a non-yielding asset. Any rebound is likely to be viewed as an opportunity for fresh selling. Key catalysts ahead include PMI data releases and developments in the Middle East.
Drivers:
Downside: a stronger dollar, hawkish Fed expectations, persistent geopolitical uncertainty, and strong PMI data.
Upside: progress in negotiations, a dovish Fed signal, weak PMI data, and profit-taking on long dollar positions.
Resistance levels: 4170, 4210
Support levels: 4123, 4050
A retest of the trading range support is developing. The market is testing 4123 within the current distribution phase, and there is a high probability of a corrective move toward the liquidity zone before another decline. A short squeeze into the 4160–4170 area could trigger a further move lower toward 4050.
Best regards,
R. Linda Short 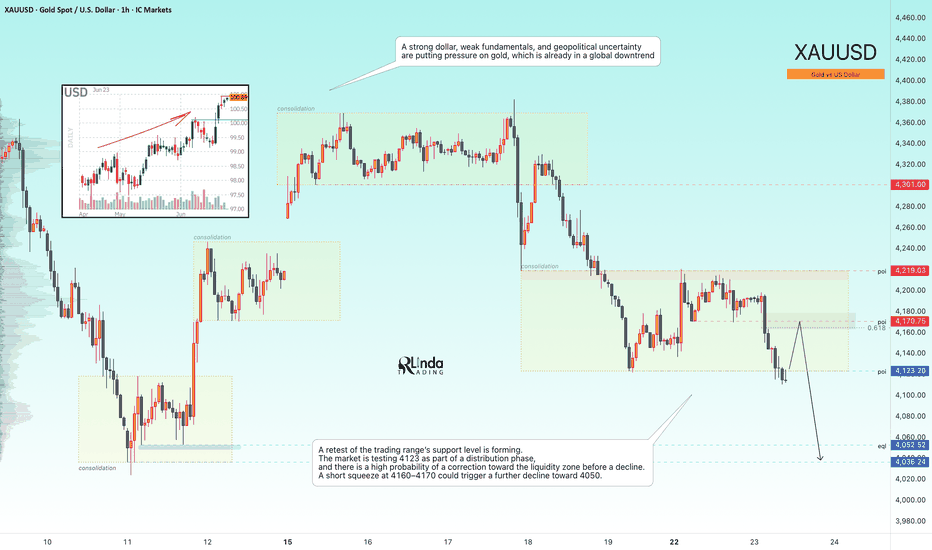
EURUSD: Breakdown Confirmed – Support Becomes the Next TargetHello everyone, here is my breakdown of the current EURUSD setup.
Market Analysis
EURUSD has been trading inside a well-defined downward channel, where sellers continue to maintain control through a sequence of lower highs and lower lows. After breaking below a previous support area, price attempted several recoveries, but each rally was rejected near channel resistance, confirming the bearish trend.
Currently, EURUSD is trading below the 1.1490 Resistance Zone while holding above the 1.1410 Support Zone. A recent breakout below a short-term consolidation structure accelerated selling pressure, and the latest rebound appears to be a corrective retest of former support, now acting as resistance.
My Scenario & Strategy
As long as EURUSD remains below the 1.1490 Resistance Zone and continues to respect the downward channel structure, the bearish scenario remains valid. A rejection from current levels could push price toward the 1.1410 Support Zone (TP1).
However, if EURUSD breaks above the resistance zone and exits the channel to the upside, the bearish outlook would weaken and a larger recovery could develop.
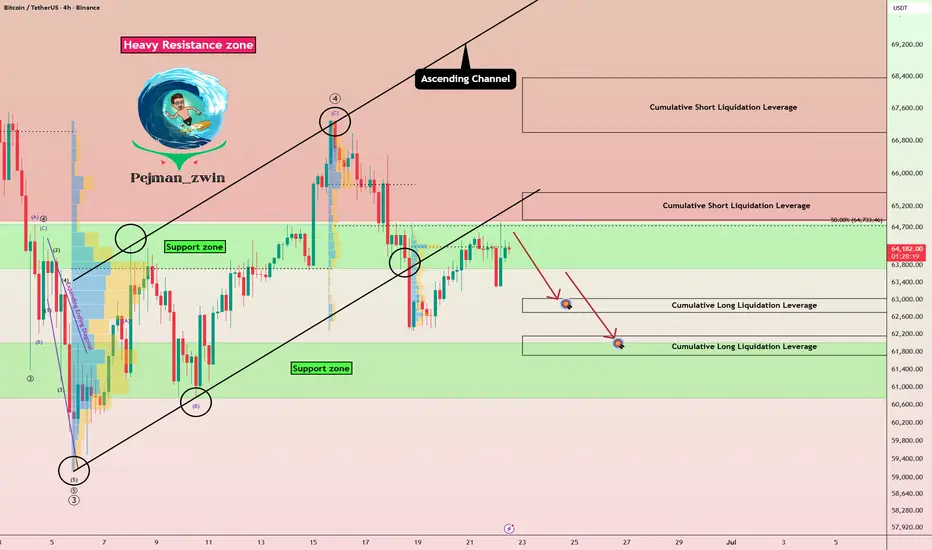
That’s the setup I’m tracking. Thank you for your attention, and always manage your risk. Bitcoin Roadmap: Breakdown First, Reaction NextBefore diving into the 4-hour Bitcoin ( BINANCE:BTCUSDT ) chart, let’s quickly run through the fundamental analysis.
Please stay with me
Bitcoin Fundamental & News:
1. U.S.–Iran Roadmap Agreement — The Main Macro Catalyst
The most important development was the reported agreement between the U.S. and Iran on a roadmap toward a final deal within the next 60 days.
This reduced geopolitical risk significantly, with the Strait of Hormuz expected to remain open and oil prices falling below $80. Lower oil prices are generally positive for global inflation expectations and risk assets.
Asian equities and traditional markets reacted positively, but Bitcoin showed a classic “buy the rumor, sell the news” reaction. BTC initially spiked above $67,000 on the rumor, but after the official confirmation, it rejected and dropped back toward the $64,000 area.
2. Continued Outflows From Bitcoin ETFs
The second major bearish factor remains the persistent outflow from spot Bitcoin ETFs.
Bitcoin ETFs reportedly recorded their sixth consecutive week of outflows, with around $227 million leaving the market between June 14 and June 18 alone.
Overall, June has been a weak month for institutional flows, and these ETF outflows remain one of the main reasons Bitcoin has struggled to hold higher levels despite positive macro headlines.
3. Other Important Bitcoin Developments
On-chain activity is starting to improve, according to CryptoQuant, which may suggest that selling pressure is gradually weakening and accumulation is slowly returning.
Franklin Templeton also filed for a new Bitcoin-related DRIP ETF structure, designed to reinvest dividend income into BTC exposure.
Meanwhile, Bitcoin developers continue to discuss improvements around RBF, or Replace-by-Fee, which could improve transaction flexibility and fee management on the network.
----------
Now, let’s get into the technical analysis on the 4-hour timeframe.
Currently, Bitcoin seems to have broken the support zone($64,760-$63,720) and the lower line of the ascending channel, and is now completing a pullback toward these levels.
From an Elliott Wave perspective, this suggests that main wave 4 might have completed after breaking the lower line of the ascending channel, and we could anticipate further downside in the coming days.
Additionally, with the DXY Index ( TVC:DXY ) and U.S. 10-Year Government Bond Yield ( TVC:US10 ) both on upward trends, and considering the likelihood of a bearish S&P 500 ( FX:SPX500 ), these factors could all support further downward pressure on Bitcoin in the short term.
I expect Bitcoin, in the coming hours, to potentially drop toward the Cumulative Long Liquidation Leverage($63,020-$62,700). Bearish momentum is strong; we might even see a test of the support zone($62,000-$60,750).
Cumulative Long Liquidation Leverage: $62,160-$61,720
Cumulative Short Liquidation Leverage: $68,3700-$67,000
Cumulative Short Liquidation Leverage: $65,530-$64,880
What do you think about Bitcoin? Will it drop below $60,000, or not?
💡 Please respect each other's opinions and express agreement or disagreement politely.
📌Bitcoin Analysis (BTCUSDT), 4-hour time frame.
🛑 Always set a Stop Loss(SL) for every position you open.
✅ This is just my idea; I’d love to see your thoughts too!
🔥If you find it helpful, please BOOST this post and share it with your friends. Short 
BTCUSDT Retests Major Buyer Zone – Can Bulls Recover?Hello traders! Here’s my technical outlook based on the current BTCUSDT (1H) chart structure. BTCUSDT previously traded inside a consolidation range before breaking below support and extending its bearish move. After reaching a local bottom, price reversed higher and formed a broad ascending channel, confirming a recovery phase. However, buyers lost momentum near the upper boundary, leading to a fresh breakdown. Currently, BTCUSDT is trading near the 61,800 Buyer Zone while remaining below the 66,000 Seller Zone. The recent break below channel support accelerated selling pressure and pushed price back toward a major support area. As long as BTCUSDT remains above the 61,800 Buyer Zone, a short-term recovery scenario remains valid. A bounce from current levels could drive price toward the 66,000 Resistance Zone (TP1). Please share this idea with your friends and click “Boost” 🚀 Long 
 Short
Short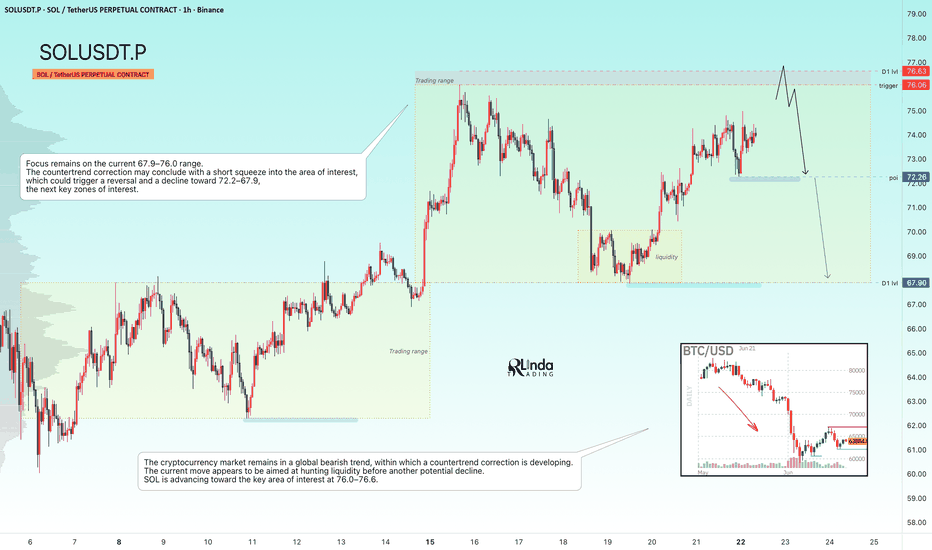
Short 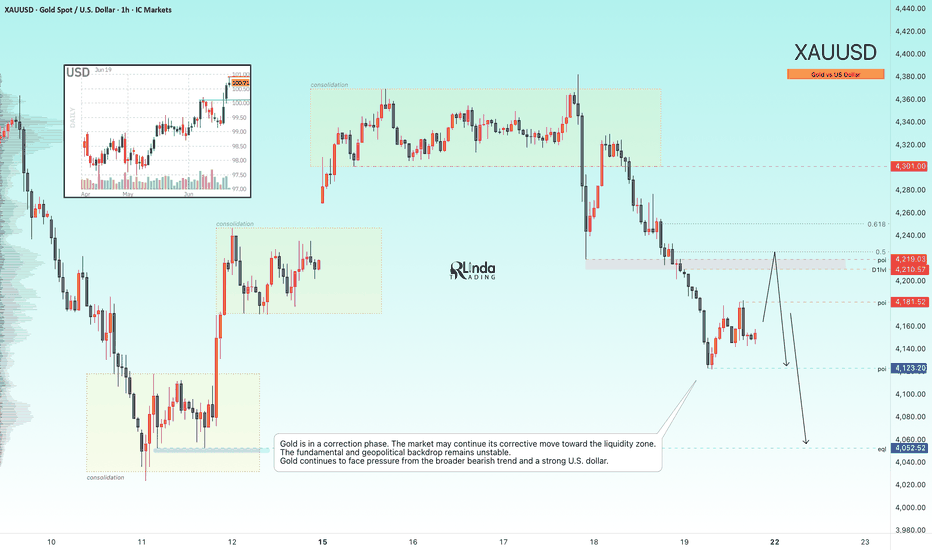

 Short
Short