BTCUSDT: Bearish Drop to 63000?As the previous analysis worked exactly as predicted, BINANCE:BTCUSDT is eyeing a bearish reversal on the 4-hour chart , with price testing a downward trendline after recent highs, converging with a potential entry zone near resistance that could trigger downside momentum if sellers defend amid volatility. This setup suggests a pullback opportunity post-rally, targeting lower support levels with more than 1:4.5 risk-reward .🔥
Entry between 70000–71000 (entry from current price with proper risk management is recommended). Target at 63000 . Set a stop loss at a 4-hour close above 71500 , yielding a risk-reward ratio of more than 1:4.5 . Monitor for confirmation via a bearish candle close below entry with rising volume, leveraging Bitcoin's volatility near resistance.🌟
📝 Trade Setup
🎯 Entry (Short):
70,000 – 71,000
(Entry from current price is valid with proper risk & position sizing.)
🎯 Target:
• 63,000
❌ Stop Loss:
• 4H close above 71,500
⚖️ Risk-to-Reward:
• > 1:4.5
💡 Your view?
Is Bitcoin about to rotate back toward 63K after trendline rejection, or will bulls break resistance and squeeze shorts above 71.5K? 👇
Pivot Points
XAUUSD Swing Short / Sell SetupThere are 3 scenarios printing out, I won't buy until the this week Closes Bullish, will buy from 4150-4200 levels if any evidence seen for buy, for now manage your risk and look for a short setup. If you are looking for scalp buy setup then look from 4515-4500 level and target the 4550 level. If Gold manages to close above previous day high at least a 4hrs candle closing, then again avoid selling until it reaches 4600-4615 level. Will share the setup again. Keep following for more updates. Will Avoid long scalp cause the sl is bigger and RR is too low.
MESM May 21: Break 7470 for 7540, lose 7407 for 7377MESM analysis for Thursday, May 21
MESM is trading around 7426 and still sitting inside the overhead supply zone from yesterday. Because of that, today looks like a decision area between breakout continuation and renewed selling pressure.
On the 4H chart, the key bullish level for me is 7470. If we get a 4H candle close above 7470, then I think price could continue higher toward the previous high at 7540.
On the downside, if the current 4H candle closes below 7426, then I think sellers may start taking control again, and in that case I’ll be watching for continuation lower toward 7376.
On the 1H chart, the downside trigger I’m watching is 7407. If price starts closing below that level, then I think the move lower could extend toward the higher-time-frame support around 7377.
On the 15M chart, the structure is still aligned with the higher time frames, so for me the important range today is 7407 to 7470. Once price breaks either side, then the next move becomes more actionable.
Key levels
7470 = bullish breakout level
7540 = upside target
7426 = 4H support / weakness trigger
7407 = downside trigger
7377 / 7376 = downside target
So for today, my plan is:
Above 7470 = watch for bullish continuation toward 7540
Below 7407 = watch for downside continuation toward 7377
Stay patient while price remains inside the range
Not financial advice. No confirmation, no trade. CME_MINI:MESM2026
BTC position | 21 may 2026BTCUSDT position | 15m Chart (Entry on M5)
Follow price BINANCE:BTCUSDT.P
❇️ Analysis Description: Downtrend line is broken (leg-2 expansion). Bullish momentum expected; wait for a pullback. Breaking the 77,170 level will invalidate this setup and start a downtrend.
🔼 Buy-sell Setup: Enter only after a valid trendline break and pullback to the 77,730 or 77,470 area.
🕯 Entry Plan (5-Minute Confirmation):
M5 candle must close with a full body (body size at least 2x the shadows).
Pullback Entry: Enter on the retest of the levels with a confirmation candle in the trade direction.
⚙️ Position Management
🔴 Stop Loss (SL): Placed behind the M15 swings (77,320 for aggressive or 77,170 for conservative).
🟢 Take Profit (TP): Target levels marked on the chart based on leg-2 expansion (78,220 & 78,480 & 79,250).
💡 Note: Once Target 1 is reached, you can secure partial profits (Take Profit) or Risk-Free (Break-even) your position.
⚠️ Min R/R must be 1:1 for TP1. Use Risk-Free (Break-even) for higher targets.
⚠️ Please follow proper risk management.
💬 Leave your thoughts in the comments or message me directly for details!
XAUUSD: Trend in 15 Min timeframeThe color levels are very accurate levels of support and resistance in different time frames, and we have to wait for their reaction in these areas.
So, Please pay special attention to the very accurate trend, colored levels, and you must know that SETUP is very sensitive.
BEST,
MT
ServiceNow(NOW) could be entering a MASSIVE reaccumulation phaseLooking at the 2W chart of ServiceNow NYSE:NOW , I currently see what appears to be the late stage of a complex W-X-Y corrective structure.
From an Elliott Wave perspective, the correction looks mature, although I still believe price could briefly move deeper toward the ~$50 zone before a larger reversal fully confirms.
What really caught my attention, however, is the strong impulsive move from the $80 → $100 region.
To me, that is important.
Because impulsive reactions like this, especially after prolonged corrective structures, often become the first early signal that market character may slowly be changing.
At the same time, several indicators across higher timeframes are beginning to show large bullish divergences — particularly momentum-based indicators such as RSI and MACD.
Historically, these kinds of divergences often appear during late-stage corrective phases and near important long-term bottoms.
What makes this setup interesting is the combination of:
* a mature W-X-Y structure,
* improving momentum,
* bullish divergences,
* and the emergence of impulsive price behavior.
If this scenario continues developing constructively, I believe NYSE:NOW could fully recover the broader decline and eventually build the structure needed for a new ATH cycle.
Long-term, I would not underestimate the possibility of a move toward the $300 region over the coming years. 📈
Gold analysis (XAUUSD)Gold remains bearish on the H4 and H1 timeframes, as the market is still forming lower lows (LL) and lower highs (LH). Gold will not turn bullish unless it delivers a strong momentum close above the 4589 level on H4.
On the daily timeframe, the structure remains bullish as long as price holds above 4274, which is acting as the key higher-low level. However, there is major liquidity resting around 4098, and that zone is still likely to be swept before any sustained bullish continuation.
FOMC Repair Into Supply — The Retest Decides
Gold is trying to repair after the FOMC window, but this is not a clean “buy anything” chart. The move is constructive, the dollar and U.S. yields are softer, and futures are trading above spot — but the higher-timeframe structure still demands proof. The key question for the next session is simple: does gold accept above the first resistance shelf, or was the rally only a repair into supply?
My base read is that XAUUSD is in a decision pocket, not a confirmed trend continuation pocket.
Spot reference: 4546.32
Main value magnet: 4540.25
First bull permission: 4552.42
Breakout confirmation: 4564.31
Bear damage begins: 4529.87
Line in the sand: 4508.76
════════════════════════════════════════════════════════════
1) THE CORE MAP
════════════════════════════════════════════════════════════
Gold is repairing from lower value, but the repair is now approaching the zone where late buyers can get trapped if acceptance is missing.
The bullish side needs more than a wick above resistance. It needs:
- acceptance above 4552.42
- a clean reclaim and hold above 4564.31
- a retest that does not collapse back under value
- DXY and U.S. yields staying soft during the retest
Without that, the move remains a reaction into supply, not a clean continuation leg.
The bearish side does not fully regain control unless gold loses the repair shelves:
- first weakness below 4538.17 / 4529.87
- deeper damage below 4522.65
- full campaign failure below 4508.76
That means both sides have a clear job:
Bulls must prove acceptance above the gate.
Bears must prove failure below the repair shelf.
Everything between those zones is tactical, not emotional.
════════════════════════════════════════════════════════════
2) MARKET STRUCTURE READ
════════════════════════════════════════════════════════════
Higher timeframe:
Gold is recovering from lower accumulation, but the broader structure is not fully repaired. The recovery is strong enough to respect, but not clean enough to chase blindly.
4H / 1H:
The market is still carrying absorption and mixed structure. That usually means rallies can continue, but only if each higher shelf is accepted and defended.
15M execution frame:
This is where the truth should appear. A 15m acceptance above 4552.42, followed by a successful retest, improves the bullish case. A failed acceptance back below 4538.17 weakens it quickly.
Current tactical read:
Repair is alive, but permission is conditional.
════════════════════════════════════════════════════════════
3) KEY LEVELS
════════════════════════════════════════════════════════════
BULLISH GATE
4552.42 = first permission shelf
4564.31 = breakout confirmation shelf
4575.96 = next upside magnet / TPq zone
4585.53 = stronger confirmation / TP2 zone
4608.01 = upper expansion target
4617.70 = stretch target if momentum stays clean
VALUE / MAGNET
4540.25 = main intraday magnet
4546.32 = spot reference
PULLBACK SHELVES
4542.09 = first defended continuation shelf
4538.17 = POC-side reload / support test
4529.87 = repair downgrade shelf
4522.65 = last controlled pullback before deeper reset
BEARISH DAMAGE MAP
4508.76 = line in the sand
4502.43 = first deeper reset shelf
4496.54 = downside continuation shelf
4487.54 / 4485.12 = lower reaction shelf
4455.70 / 4438.85 = deeper structural memory
════════════════════════════════════════════════════════════
4) BULLISH SCENARIO
════════════════════════════════════════════════════════════
The clean bullish version is not a vertical chase.
The better bullish case is:
1. Gold holds above 4538.17 / 4542.09.
2. Price accepts above 4552.42.
3. Buyers reclaim 4564.31.
4. Retest holds without losing value.
5. DXY and U.S. yields do not rebound aggressively.
If that sequence holds, upside can rotate toward:
- 4575.96
- 4585.53
- 4608.01
- 4617.70
The important point is that the retest matters more than the first push.
A spike is not enough. Acceptance is the trade filter.
════════════════════════════════════════════════════════════
5) BEARISH SCENARIO
════════════════════════════════════════════════════════════
The bearish case starts if gold cannot defend the repair.
Warning signs:
- price fails above 4552.42 / 4564.31
- price returns under 4540.25
- 4538.17 fails as support
- 4529.87 breaks and accepts lower
If that happens, the repair can turn into a bull trap unwind.
The downside map then opens toward:
- 4522.65
- 4508.76
- 4502.43
- 4496.54
- 4487.54 / 4485.12
Below 4508.76, the conversation changes from “healthy pullback” to “repair failure”.
════════════════════════════════════════════════════════════
6) MACRO TIMING RISK
════════════════════════════════════════════════════════════
The next data stack can decide whether the repair survives.
Main timing windows to watch in Cairo time:
15:30 Cairo — U.S. Housing / Jobless Claims / Philadelphia Fed cluster
16:45 Cairo — S&P Global U.S. Flash PMI
20:00 Cairo — U.S. 10Y TIPS auction
23:30 Cairo — Fed Balance Sheet
The reaction path matters more than the headline alone.
For gold:
- weaker labor / softer activity can support gold if yields and DXY stay lower
- stronger activity / lower claims can pressure gold if US02Y and DXY rebound
- mixed data can create a two-way trap
The first spike is emotion.
The second acceptance is truth.
════════════════════════════════════════════════════════════
7) EXECUTION PLAN — EDUCATIONAL ONLY
════════════════════════════════════════════════════════════
LONG CONTINUATION IDEA
Trigger:
Acceptance above 4552.42, then reclaim / retest above 4564.31.
Primary zone:
4552.42–4564.31 retest hold.
Risk map:
SL1: below 4538.17 / 4529.87 depending on timeframe
SL2: below 4522.65 if using wider structure
Invalidation: loss of 4508.76
Targets:
TPq: 4575.96
TP2: 4585.53
TP3: 4608.01 / 4617.70
SHORT FAILURE IDEA
Trigger:
Failed acceptance above 4552.42 / 4564.31, then close back below 4540.25 and 4538.17.
Primary zone:
Failed reclaim or failed retest under 4540.25 / 4538.17.
Risk map:
SL1: above 4552.42
SL2: above 4564.31 / 4575.96 if using wider structure
Invalidation: reclaim above 4585.53
Targets:
TPq: 4529.87
TP2: 4522.65 / 4508.76
TP3: 4502.43 / 4496.54
════════════════════════════════════════════════════════════
8) FINAL VERDICT
════════════════════════════════════════════════════════════
Gold is repairing, but it is not yet a clean trend-chase environment.
The bullish structure improves only if price accepts above 4552.42 and confirms above 4564.31. Until then, upside is a repair into supply and must be managed carefully.
The bearish structure improves if gold fails the upper gate and loses 4538.17 / 4529.87. Below 4508.76, the repair thesis is invalidated and a deeper reset becomes active.
Best posture:
- do not chase the first candle
- trade the retest
- respect the 4540.25 value magnet
- treat 4552.42 / 4564.31 as the bullish gate
- treat 4529.87 / 4508.76 as the bearish damage path
- reduce aggression around macro-data windows
This is an acceptance map.
Not a prediction.
Not a signal.
A structured decision framework.
Educational analysis only. Not financial advice. Manage risk carefully.
ARUSDT: trend in daily time framesThe color levels are very accurate levels of support and resistance in different time frames, and we have to wait for their reaction in these areas.
So, Please pay special attention to the very accurate trend, colored levels, and you must know that SETUP is very very ... very sensitive.
Don't get the short position, just if price down to sensitive area get the BUY position.
So, please set the order for BUY position with +200 pips SL.
Be careful
BEST
MT
First TradingView idea on ADAEUR.ADAEUR idea — not financial advice, just sharing my personal view of the chart.
I’m expecting ADA to potentially reach around €0.51 by approximately October 1st if the current structure and momentum continue developing positively.
This is my first TradingView idea, so I’m sharing it mainly to learn and discuss with the community. Curious to hear other opinions and scenarios as well.
First TradingView idea on ADAEUR.
My current expectation is a possible move toward €0.51 around early October 2026 if bullish momentum continues.
Still learning and sharing ideas with the community — this is not professional financial advice.
The Bear Trap Everyone Falls For – Smart Money Is Buying HereAt first glance this looks like a clean breakdown below support, which usually convinces traders to open sell positions.
But if you look closer, this move has the characteristics of a classic liquidity grab (Fake Sell / Bear Trap).
Price briefly pushed below the support level to trigger stop losses and trap sellers, then immediately reacted upward. This type of move often happens when smart money collects liquidity before a reversal or a strong retracement.
Why this is a BUY setup
Liquidity Sweep
The market moved below support to collect sell-side liquidity. Those stops provide the fuel needed for a potential upward move.
Strong Reaction from the Zone
After the sweep, buyers stepped in quickly, creating a strong bullish reaction. This suggests demand is present in this area.
Clear Risk Management
The setup provides a clean invalidation level. If price breaks below the red stop-loss zone, the fake sell idea becomes invalid.
Trade Plan
Entry: Buy zone around the fake sell candle
Stop Loss: Below 4452.104 (invalidation of the setup)
Targets:
Target 1 (Low Risk): 4572.615
Target 2 (Medium Risk): 4731.489
Target 3 (High Risk): 4857.990
The idea here is simple: don’t chase the breakdown — trade the trap.
Markets often move in the opposite direction of what the majority expects, and fake breakouts like this are one of the clearest signs of that behavior.
What do you think — is this the start of a reversal or just a temporary bounce?
#Gold #TradingView #Forex #LiquidityGrab #SmartMoney #PriceAction #BearTrap
Monthly/Weekly Institutional Level Map.Weekly Companion With Previous-Month References:
Both the Monthly and Weekly charts continue to maintain a short-term bearish bias unless price successfully reclaims the key control levels. The first bullish invalidation level stands at 4,545, followed by the stronger reclaim zone around 4,629–4,660. On the bearish side, a weak close below 4,453 would confirm continuation pressure and open the path toward the next liquidity targets near 4,400 and 4,350–4,300
XAUUSD still looks bullish if we look at the bigger monthly trend, but right now short-term price action is clearly showing weakness. The monthly candle is sitting below its open and keeps rejecting the 4,770 area, while price slowly moving closer toward the lower side of the range. Weekly structure also not looking very healthy for bulls, because upside continuation failed and price is accepting below important liquidity levels.
At this stage, the market feels more like distribution after a very stretched rally. Sellers are still in control unless buyers can quickly reclaim the current sell-side pressure. And honestly, market does not even need a huge crash to stay bearish here. Even a simple bounce into the 4,510–4,545 zone, if rejected again, can become another lower-high setup before continuation lower.
For now, the first proper sign of strength would be a strong weekly reclaim above the monthly open. That’s the area where smart money would start showing real accumulation again instead of just temporary reactions.
MarketBreakdown | USDCAD, NZDUSD, USDCHF, DXY
Here are the updates & outlook for multiple instruments in my watch list.
1️⃣ #USDCAD daily time frame 🇺🇸🇨🇦
We see a strong bullish momentum.
The pair will likely continue rising at least to 1.379 level.
2️⃣ #NZDUSD daily time frame 🇳🇿🇺🇸
The price retraced to a major daily support cluster.
There will be a high chance that the price will pull back from that.
Alternatively, its breakout and a daily candle close below that
will provide a strong bearish signal.
3️⃣ #USDCHF daily time frame 🇺🇸🇨🇭
Bulls keep pushing strongly.
The price is going to reach 0.791 level soon.
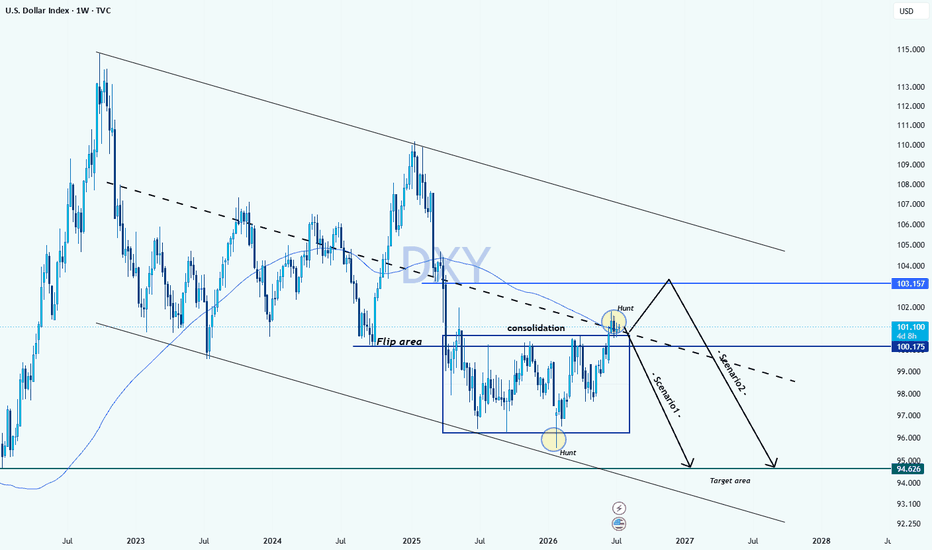
4️⃣ #DXY Dollar Index daily time frame 💵
The market looks ready to finally fill a gap down of the 7th of April.
Expect a rise to 99.5 level.
Do you agree with my market breakdown?
❤️Please, support my work with like, thank you!❤️
I am part of Trade Nation's Influencer program and receive a monthly fee for using their TradingView charts in my analysis.
BTCUSDT position | 19 may 2026BTCUSDT position | 15m Chart (Entry on M5)
Follow price BINANCE:BTCUSDT.P
❇️ Analysis Description: Downtrend line is broken. Bullish momentum expected; wait for a pullback.
🔼 Buy Setup: Enter only after a valid trendline break and pullback to the 76,642 area.
🕯 Entry Plan (5-Minute Confirmation):
M5 candle must close with a full body (body size at least 2x the shadows).
Pullback Entry: Enter on the retest of the level with a confirmation candle in the trade direction.
⚙️ Position Management
🔴 Stop Loss (SL): Placed behind the last M15 swing (76,293 or 76,082).
🟢 Take Profit (TP): Target levels marked on the chart (77,180 & 78,004).
⚠️ Min R/R must be 1:1 for TP1. Use Risk-Free (Break-even) for higher targets.
⚠️ Please follow proper risk management.
💬 Leave your thoughts in the comments or message me directly for details!
Yen Bears Could be Pushing Their LuckWith the risk of further intervention from Japan’s MOF rising, bulls may want to err on the side of caution given USD/JPY has rallied for a seventh consecutive day and already surpassed the level of the second intervention. I also examine key technical levels for AUD/JPY, GBP/JPY and CHF/JPY.
MS.
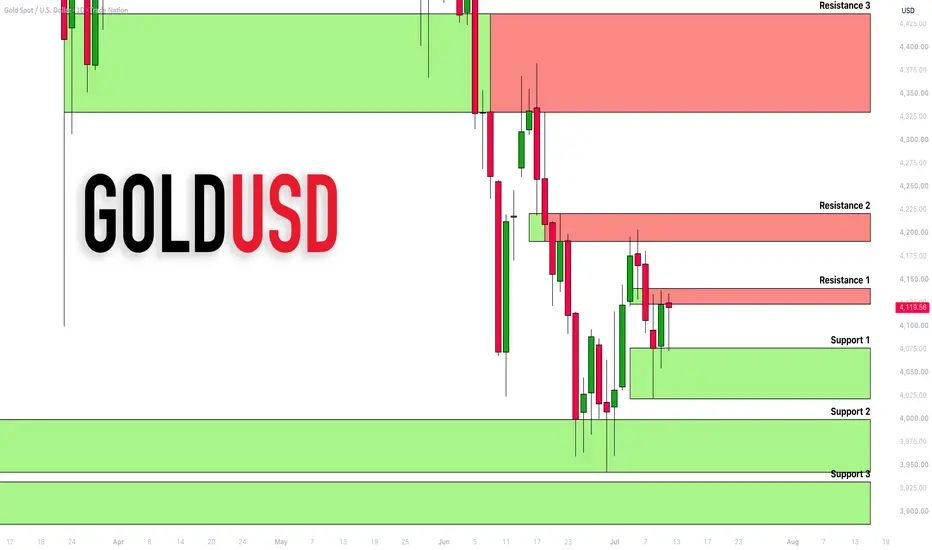
GOLD position | 18 may 2026Follow price TVC:GOLD 🔽
❇️Analysis description: :
I believe in long more deals. Because we are on best support.
Traded Levels:
🔽Sell Setup: Followed price below $4510
🔼Buy Setup: Followed price above $4563
Entry Plan (5-Minute Confirmation):
1️⃣ Execution is only valid if a candle closes with these criteria on the M5 timeframe:
2️⃣ Valid Breakout: At least 80% of the candle body must close outside the level in the direction of the trade.
3️⃣ Momentum: Body size must be at least 2x the shadows (No Doji or Pin bars).
4️⃣ Relative Size: Body should be average-to-large compared to recent candles.
5️⃣ The trade is valid on Pullback: If the price breaks through the breakout level again, you can enter the position with the confirmation candle as mentioned
Position Management:
🔴 Stop Loss (SL):
Placed behind the last swing prior to the breakout.
🟢Take Profit (TP):
Target levels are marked numerically on the chart.
🔼Note: Only take trades with a minimum 1:1 Risk/Reward ratio. Use Risk-Free (Break-even) for higher targets.
⚠️Risk Warning: Please follow proper risk management if you enter based on this analysis.
💬 Join the Discussion: I'd love to hear your thoughts on this setup in the comments! For direct inquiries or more details, feel free to message me in private chat.
Ethereum Still Trapped Inside a Descending Channel👋 Welcome to SatoshiFrame
👍 Ethereum is still moving inside a descending channel, with selling pressure appearing stronger than Bitcoin. The sharp RSI reaction near oversold levels and the increase in sell volume suggest that bears still control the short-term market structure.
✈️ In the bullish scenario, a breakout above the channel resistance and stabilization above the $2,168 level could trigger a recovery move. In that case, a 0.5% risk long position may be considered, while a breakout above $2,231 could justify adding the remaining risk to the trade.
🔜 In the bearish scenario, as long as price remains below the channel resistance, the overall structure stays bearish. A rejection from the top of the channel could offer a short opportunity, while losing the $2,080 support may increase downside pressure toward the $2,020 area.
✅ From a momentum perspective, RSI is currently trading near the 50 zone, showing that the market still lacks strong bullish momentum. Increasing buy volume during a breakout can confirm the long scenario, while stronger sell volume may confirm continuation of the bearish move.
⚠️ Risk management and capital management are the most important parts of trading. Always trade based on your own strategy and risk tolerance. Every trade and trading decision is entirely your own responsibility.
BTC Trading Plan | Day 1👋 Welcome to SatoshiFrame
💸 After faking out the $76,228 support level, Bitcoin has entered a short-term recovery phase and is now trading back above the $77,000 area. However, trading volume has been decreasing during the latest upward move, which could signal weakening bullish momentum in the short term.
⏳ In the bullish scenario, the first major resistance sits around $78,488. If price manages to stabilize above this level, a long position with 0.5% risk could be considered. A breakout above the $80,272 resistance may then open the door for a move toward the $82,550 area.
🪙 In the bearish scenario, as long as the market remains below the $78,488 resistance, the overall structure still favors sellers. Losing the $76,228 support could increase selling pressure and push price toward the $74,950 and then $73,760 support zones.
✅ Final confirmation for the long scenario can come from increasing buy volume during the breakout, improving the quality of the setup. For the short scenario, stronger seller participation during the breakdown can act as confirmation as well.
⚠️ Risk management and capital management are essential in trading. Always trade based on your own strategy and risk tolerance. Every trading decision and its outcome are entirely your own responsibility.
BTC position | 18 may 2026Follow price BITSTAMP:BTCUSD 🔽 76743 for sell and 🔼 77036 for buy..
❇️Reason for entry and exit :
We are in bear-trend but we near to strong support.
Traded Levels:
🔽Sell Setup: Followed price below $80,360
🔼Buy Setup: Followed price above $80,910
Entry Plan (5-Minute Confirmation):
1️⃣ Execution is only valid if a candle closes with these criteria on the M5 timeframe:
2️⃣ Valid Breakout: At least 80% of the candle body must close outside the level in the direction of the trade.
3️⃣ Momentum: Body size must be at least 2x the shadows (No Doji or Pin bars).
4️⃣ Relative Size: Body should be average-to-large compared to recent candles.
5️⃣ The trade is valid on Pullback: If the price breaks through the breakout level again, you can enter the position with the confirmation candle as mentioned
Position Management:
🔴 Stop Loss (SL):
Placed behind the last swing prior to the breakout.
🟢Take Profit (TP):
Target levels are marked numerically on the chart.
🔼Note: Only take trades with a minimum 1:1 Risk/Reward ratio. Use Risk-Free (Break-even) for higher targets.
⚠️Risk Warning: Please follow proper risk management if you enter based on this analysis.
💬 Join the Discussion: I'd love to hear your thoughts on this setup in the comments! For direct inquiries or more details, feel free to message me in private chat.
GOOG Short-term analysis | Trading and expectationsNASDAQ:GOOG NASDAQ:GOOGL Wave IV ended at 0.236 Fib retracement. 2 gaps have been left behind, one at the daily pivot $350 and another at the S1 pivot $302, which is likely to be filled. The bulls are in control as price is well above the daily 200EMA and pivot. Wave (1) appears complete, and wave 2 has an expected target of the previous all-time high, High Volume Node at the 0.5 Fib retracement $337, followed by the golden pocket and gap fill $310.
📈 Daily RSI has bearish divergence in oversold territory, a pullback is expected
👉 Analysis is invalidated if we continue higher with force
GOOG Macro analysis | The bigger picture | Long-term holdersNASDAQ:GOOG NASDAQ:GOOGL caught an extraordinary bid from the weekly pivot, booming into price discovery, now finding support above the R1 weekly pivot. Wave (5) of III appears to be underway with a target of the R2 weekly pivot at $447.
📈 Weekly RSI bearish divergence in overbought is huge, suggesting a major top soon, but continued pressure high would negate this.
👉 Analysis is invalidated only below wave (4) as there are no nested waves to count due to the strength of the move.
CLSK Short-term analysis | Trading and expectationsNASDAQ:CLSK is above the daily 200EMA and pivot, showing bulls in control, suggesting wave © of E is complete as a truncated pattern. The strong move upwards towards $40 looks underway, but the price is trapped in a High Volume Node resistance area first. A break and close above this will be very bullish. The higher high makes the local structure bullish.
📈 Daily RSI played out a series of bullish and bearish divergences, with a hidden bearish divergence now negated. Room to grow here.
👉 Analysis is invalidated if we go below wave E, keeping it alive