Long
Long
 Long
Long
Over a Month in This GBPUSD Buy — Now, the Market Is RetracingThis GBPUSD buy is a good reminder that **patience is also a trading skill.
For over a month, I held onto this position while allowing price to move within the larger structure.
Now, after the sustained move to the upside, price has reached an important area and is beginning to retrace.
From my perspective, the key areas I am watching include:
🔹 The unmitigated Order Block above
🔹 The liquidity resting around the recent highs
🔹 The imbalance/FVG below, which could become relevant during a deeper retracement
🔹 The broader range, with the low and high defining potential liquidity objectives
The important thing now is not to blindly assume that every retracement means a complete reversal. Price can retrace, rebalance inefficiencies, mitigate institutional levels, and then continue with the larger order flow.
One thing about swing or position setups like this is having a sub account because not all brokers allow it but this helps me in separating different strategies and exposures (like scalping or intraday and swing trading like this) hence giving me reason to look at longer term without panicking. and because bitget allows this and I find it useful as a trader to manage separate trading activity through sub-accounts. So yes, this is how I navigate through which can be useful for keeping different strategies or risk allocations isolated from each other.
So, if you are looking for how to position for a longer term trade, you can have a separate account because market can be convincing that will make you change your initial setup and once you are right, you might end up using emotion to trade and not what you see. Hope this helps
Liquidity Pools Explained: How Do They Actually Work?⚠️ Disclaimer: This post is for educational and informational purposes
If you’ve spent any time in DeFi, you’ve probably heard the term Liquidity Pool.
But what exactly is it?
Why do people put their crypto into these pools?
How do traders use them?
And where does the liquidity provider actually make money?
Let’s break it down step by step. 👇
🔹 What Is a Liquidity Pool?
A liquidity pool is a smart-contract-based pool containing two or more crypto assets that are deposited by users.
These assets provide the liquidity needed for decentralized trading.
For example, imagine an ETH/USDC liquidity pool.
The pool might contain:
500 ETH
1,000,000 USDC
Users can trade ETH for USDC — or USDC for ETH — directly against the pool without needing a traditional buyer and seller to match their orders.
The people who deposit these assets are called Liquidity Providers (LPs).
🔹 Why Do Liquidity Pools Exist?
Traditional exchanges usually rely on an order book.
An order book matches:
Buyer → Seller
But decentralized exchanges (DEXs) can use a different model called an Automated Market Maker (AMM).
Instead of waiting for another person to place the opposite trade, users trade against the liquidity held inside the pool.
So the basic structure looks like this:
Liquidity Providers → Liquidity Pool → Traders
LPs provide the capital.
Traders use that liquidity.
The protocol's smart contract manages the trades according to its rules.
🔹 How Does an AMM Determine the Price?
One of the classic AMM models uses the formula:
x × y = k
Where:
x = amount of Token A
y = amount of Token B
k = a constant
Suppose a pool contains:
10 ETH × 20,000 USDC = 200,000
If someone buys ETH from the pool, the amount of ETH decreases.
To maintain the relationship defined by the AMM, the amount of USDC in the pool increases.
This means the price changes as trades happen.
Bigger trade → Bigger price impact
This is one reason liquidity depth matters.
A large pool can generally handle larger trades with less price impact than a very small pool, all else equal.
🔹 Where Does the Liquidity Come From?
The liquidity comes from users.
Imagine you provide:
$5,000 worth of ETH
and
$5,000 worth of USDC
to an ETH/USDC pool.
You have supplied $10,000 of liquidity.
In return, the protocol records your share of the pool.
Depending on the protocol, you may receive LP tokens or another form of position representation.
Your share allows you to participate in the pool's economics and, subject to the protocol's rules, withdraw your portion later.
🔹 How Do Liquidity Providers Earn?
The main source is usually trading fees.
Suppose traders continuously swap ETH and USDC through the pool.
Every trade may generate a fee.
A portion of those fees can be distributed to liquidity providers according to the protocol's rules.
For example:
Trader swaps:
$100,000
If the applicable trading fee is 0.30%, the fee would be:
$300
That fee doesn't automatically mean every LP receives $300.
The distribution depends on the protocol, pool design, incentives, and your share of the relevant liquidity.
So:
More trading volume + sufficient liquidity + attractive fee structure
can potentially create more fee revenue for LPs.
But this does not mean LPs are guaranteed to make money.
🔹 The Big Risk: Impermanent Loss
This is probably the most important concept to understand before providing liquidity.
Let's say you deposit:
ETH + USDC
Then ETH's market price changes significantly.
The AMM's mechanism causes the pool's asset composition to change as traders arbitrage the pool toward the market price.
You may end up holding:
Less ETH + More USDC
than you would have if you had simply held the original assets in your wallet.
The difference is commonly referred to as impermanent loss.
Why "impermanent"?
Because if the relative prices return to the appropriate original relationship before you withdraw, the difference can disappear.
But once you withdraw, the loss relative to simply holding the assets can become realized.
And if trading fees and other rewards don't compensate for that difference, providing liquidity may underperform simply holding the assets.
🔹 Simple Example
Imagine you deposit:
$5,000 ETH + $5,000 USDC
Total:
$10,000
Now imagine ETH's price increases dramatically.
Arbitrage traders interact with the pool, changing its ETH/USDC ratio.
When you later withdraw, you might receive something like:
$7,000 ETH + $7,500 USDC
Total:
$14,500
Sounds great, right?
But here's the important comparison:
If you had simply held your original ETH and USDC instead of providing liquidity, your portfolio might have been worth $15,500.
The difference is the economic effect commonly described as impermanent loss, before considering the fees and rewards you earned.
So you shouldn't look only at:
"How much money is inside my LP position?"
You should compare it against:
"What would I have if I had simply held the same assets?"
🔹 Other Risks You Need to Understand
Liquidity pools aren't simply a way to earn passive income.
There are several risks.
1️⃣ Impermanent Loss
Changes in the relative prices of the assets can reduce your performance compared with holding the assets separately.
2️⃣ Smart Contract Risk
Your funds interact with code.
If the underlying smart contract has a vulnerability, exploit, or design flaw, funds can potentially be lost.
3️⃣ Token Risk
Providing liquidity for a highly volatile or low-quality token can expose you to significant losses.
A token can lose most or all of its value.
4️⃣ Stablecoin Risk
Even stablecoins aren't completely risk-free.
They can experience depegging, liquidity issues, or other risks.
5️⃣ Low Liquidity
Small pools can experience significant price impact.
This can also make exiting a position more difficult or costly.
6️⃣ Protocol Risk
A protocol may have economic, governance, oracle, or implementation risks beyond the basic AMM mechanism.
7️⃣ Incentive Risk
Some pools offer additional token rewards.
But those rewards can decrease in value or disappear entirely.
A high advertised APY doesn't automatically mean high profit.
🔹 What Is APY in Liquidity Pools?
You may see something like:
APY: 25%
or
APR: 80%
Don't immediately interpret this as guaranteed return.
These numbers can depend on:
Trading volume
Pool liquidity
Token prices
Fee distribution
Incentive emissions
Reward-token price
Compounding
Protocol changes
An APY displayed today can be very different tomorrow.
🔹 Why Do Traders Need Liquidity?
Imagine you want to swap:
$100,000 USDC → ETH
You need someone or something willing to sell you that ETH.
In a DEX using an AMM, the liquidity pool provides the assets needed for the swap.
Without sufficient liquidity:
Large trade → High price impact → Worse execution
With deeper liquidity:
Large trade → Lower price impact → Better execution
This is why liquidity is one of the fundamental building blocks of DeFi.
🔹 The Liquidity Provider's Trade-Off
Providing liquidity is essentially a trade-off.
You are giving the market access to your capital.
In return, you may receive:
💰 Trading fees
🎁 Incentive rewards
📈 Potential additional yield
But you're also accepting:
⚠️ Impermanent loss
⚠️ Smart-contract risk
⚠️ Token price risk
⚠️ Stablecoin/depeg risk
⚠️ Protocol risk
So the correct question isn't:
"What is the APY?"
A better question is:
"Is the expected fee/reward income sufficient to compensate me for the risks I'm taking?"
🔹 Liquidity Pools in One Simple Picture
Think of a liquidity pool like a shared inventory warehouse.
LPs put assets into the warehouse.
Traders come and exchange assets from that inventory.
The warehouse charges a fee for facilitating those trades.
LPs can receive a portion of the economics generated by the activity.
But the inventory composition changes as people trade.
And the value of what you eventually withdraw may be different from what you originally deposited.
That's the core idea behind liquidity pools.
🧠 The Takeaway
A liquidity pool allows users to deposit crypto assets into a smart contract so traders can swap those assets through a decentralized exchange.
LPs provide liquidity → Traders use liquidity → Trades generate fees → LPs may receive a share of those fees.
But liquidity providing isn't "free money."
The biggest concepts to understand are:
AMMs + Trading Fees + Price Impact + Impermanent Loss + Smart Contract Risk + Token Risk
If you understand those six concepts, you'll have a much stronger foundation for understanding DeFi liquidity pools.
Always do your own research (DYOR), understand the specific protocol and pool mechanics, and never deposit money you cannot afford to lose.
⚠️ Disclaimer: This post is for educational and informational purposes only and should not be considered financial, investment, trading, tax, or legal advice. Cryptocurrency and DeFi involve substantial risks, including the possible loss of some or all of your funds. Always conduct your own research and consider consulting a qualified professional before making financial decisions.  Education
Education 
 Long
Long
 Long
Long
Long 
Short 
ICT QUARTERLY THEORY - COMPLETE TRADING FRAMEWORKICT QUARTERLY THEORY - COMPLETE TRADING FRAMEWORK
The ICT Quarterly Theory is a powerful time-based trading framework that analyzes how price moves across fixed time periods. Market movements repeat in cyclical phases across different timeframes, such as yearly, monthly, weekly, daily, and 90-minute session quarters.
Understanding these time cycles helps traders anticipate structural sweeps, manipulation moves, and high-probability expansion phases with maximum precision.
1. TIME FRACTALS AND CYCLE DIVISIONS
Time in the market operates on fractal cycles, divided into four key quarters:
- Q1 Phase: Accumulation and initial range creation.
-
- Q2 Phase: Manipulation, Judas Swing, and liquidity sweeps.
-
- Q3 Phase: Main trend expansion and strong price movement.
-
- Q4 Phase: Trend continuation, profit taking, or reversal (X phase).
2. THE AMDX ENGINE
The market cycles through a specific sequence known as AMDX:
- Accumulation (Q1): Smart money builds orders in a tight consolidation range.
-
- Manipulation (Q2): Price fakeouts run past key highs or lows to capture liquidity and trigger stop losses.
-
- Distribution (Q3): Large institutional orders drive the price rapidly toward the real target.
-
- Reversal or Continuation (Q4): The trend either extends further or retraces back into key Fair Value Gaps.
3. THE TRUE OPEN REFERENCE
Each trading session and time quarter relies on its True Open benchmark:
- The True Open acts as the structural baseline for calculating Premium and Discount pricing.
-
- In a bullish setup, trades are ideally evaluated when price manipulates below the True Open into a discount zone.
-
- In a bearish setup, trades are evaluated when price manipulates above the True Open into a premium zone.
4. LIQUIDITY MAPPING & SWEEPS
Targeting high-probability liquidity pools is essential for timing setups:
- Buy-Side Liquidity (BSL): Located above previous session highs, equal highs, or structural swing points.
-
- Sell-Side Liquidity (SSL): Located below previous session lows, equal lows, or structural swing points.
-
- Q2 sweeps target these liquidity pools before initiating the true Q3 expansion move.
5. ENTRY EXECUTION & CONFLUENCE
A complete quarterly trading setup relies on sequential
confirmation steps:
Step 1: Define higher timeframe quarterly bias.
Step 2: Identify Q1 accumulation range and True Open levels.
Step 3: Wait for Q2 manipulation to sweep liquidity.
Step 4: Confirm Market Structure Shift (MSS) on lower timeframes.
Step 5: Enter during strong displacement off a Fair Value Gap (FVG).
Step 6: Target opposite liquidity pools in Q3 for high reward-to-risk ratios.
6. RISK MANAGEMENT & TRADING DISCIPLINE
Long-term consistency depends entirely on execution rules and risk parameters:
- Always define invalidation levels before entering any trade.
- Maintain consistent position sizing across all market conditions.
- Focus execution primarily on Q3 expansion phases rather than chasing Q1 consolidation.
- Avoid overtrading, revenge trading, and emotional entries.
- Quality over quantity; staying flat when setups are unclear is a valid strategic decision.
DISCLAIMER:
Trading is risky. Always follow your own trading plan. This is not financial advice. Education 
Short 
Short 
 Short
Short
 Long
Long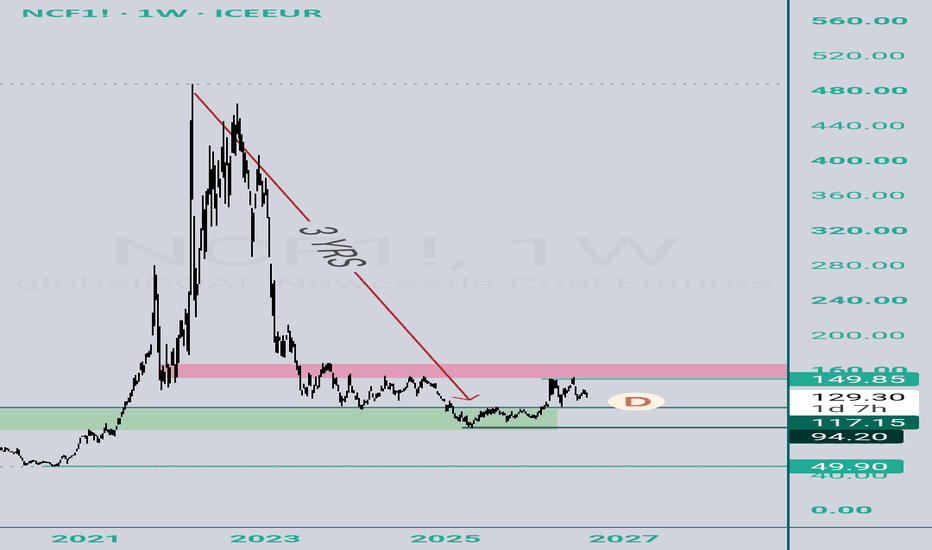
Platinum Futures (NYMEX) — Long Setup: Demand Zone BelowThe Setup
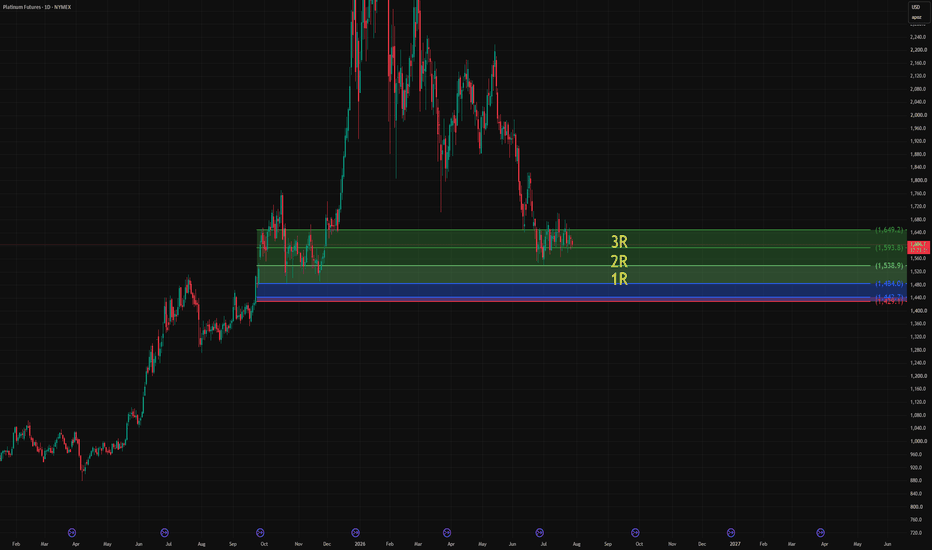
Below the current price sits a clearly defined demand zone between 1,457 and 1,513. This zone has already been tested — once or twice depending on how you count touches — and held. That's the first point in its favor.
What makes this zone particularly interesting is its location: it rests directly beneath a well-established support level. Zones sitting just under support tend to attract stronger buying interest because they catch limit orders and stops from traders who misjudged the breakdown. In other words, the fuel is already sitting there.
Entry Strategy
I favor entering closer to the lower edge of the zone — around 1,471 — rather than chasing anywhere near the upper boundary. The deeper the fill, the better the risk/reward math and the higher the probability of a clean reaction.
Stop Loss
Below 1,429. A break below the zone invalidates the thesis. No need to overcomplicate it.
Targets
Minimum target is 3R, which puts the first objective around 1,649. That gets price back above the consolidation range and into open air.
The larger picture, however, is what makes this worth watching: Platinum is coming off a brutal multi-month drawdown from ~2,360 to current levels. A bounce from this zone isn't just a scalp — it could mark the start of the next sustained leg higher. If this zone is indeed the bottom, the trade transitions from a fixed-RR play into a runner.
Seasonal Context
August brings several short-duration bullish patterns for Platinum. Nothing that carries the trade on its own, but it adds a tailwind to an already constructive technical setup. The seasonal window is tight — these patterns don't stay active for long — but the timing lines up.
 Long
Long