Short
Short
BABA showing signs of life.BABA, Alibaba, 1W / 1D
(AI summary of my analysis)
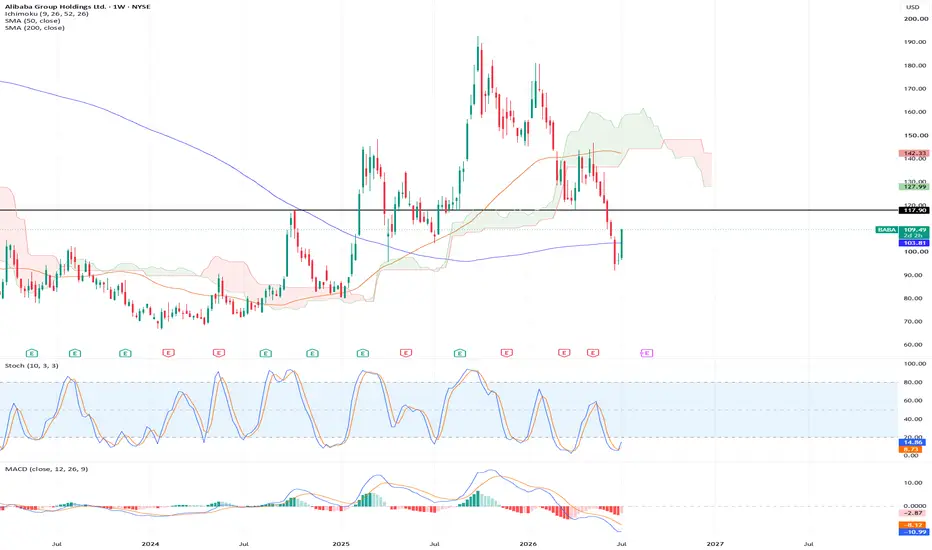
China internet has quietly started to turn up this week (KWEB, MCHI, FXI all curling higher on relative strength for the first time in a while). BABA is the name I want inside that. This is an early one, so I'm treating it like a probe, not a conviction long.
The setup:
- Fresh 52-week low, one week of consolidation, and now a big thrust week. Daily is up double digits on the heaviest volume in months and reclaimed the 21 EMA and 10 SMA. Weekly reclaimed the 200-week line and stochastics are buried and just starting to curl.
- Not extended. Price is still sitting a couple ATRs below the 50-day, so there's room to run into resistance rather than chasing something that already went vertical off the MAs.
What I'm watching:
- 117.90 is the first shelf, and then 120 to 128 is the real wall (declining 50-day plus the weekly cloud base). That whole zone is stuffed with trapped supply from the slide down from 148. First push into it probably stalls.
- I want to see it clear 117.90 and hold, with MACD actually crossing up instead of just getting less negative. That's when I'd add.
Risk:
- Stop under the 21 EMA reclaim, roughly 104 to 105. Lose that and the thrust failed, no argument. Risk is about $4-5 per share, small.
- Wider structural line is 98, and the whole thing is dead if it takes out the 90 low.
Caution:
- This is still a countertrend trade. Below a falling 50 and 200 day, MACD hasn't turned, and it's the first bounce off a new low. Those retest or base more often than they V straight up. The theme turn is only one week old too.
- So it's early and the risk is defined and small, which is exactly why I like it here. Starter now, add if China's second week confirms and 117.90 gives way. If it can't hold the 21 EMA, I'm out cheap and I wait for the base.
Not advice, just how I'm playing it.  Long
Long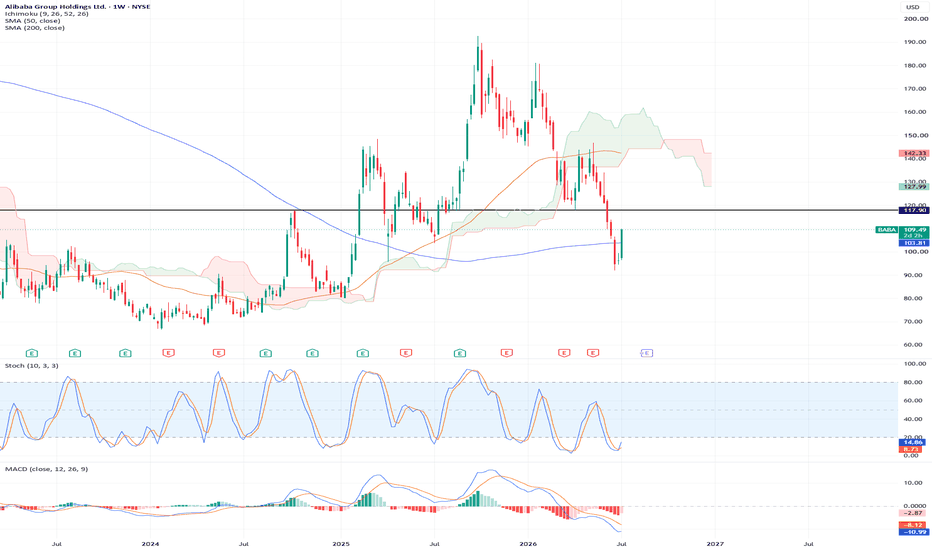
Ethereum weekly: RSI, STOCH & MACD, all bullishEthereum's weekly RSI produced a lower low in March-Feb 2026 vs March-April 2025. We know that ETHUSDT produced a very strong higher low. Here we have a hidden bullish divergence, this is a very strong signal.
At the same time, the RSI hit the lowest level since July 2022, the previous bear market bottom. This happened in early March.
Here is the chart:
There is a delay with the signals coming from the oscillators so it is good that the RSI is already rising.
The STOCH has been oversold since November 2025, printed a higher low and is ready to grow. It has very large bullish potential because of all the time it has been moving at the bottom.
The MACD reveals a bullish bias with a divergence between the histogram and the signal and MACD lines. The histogram has a higher low while the signal and MACD lines produced a lower low. A hidden bullish divergence is also present with ETHUSDT.
As you can see, all the oscillators are now bullish, the candles also.
ETHUSDT trades above all the weekly close since the 2-Feb. week, only one week closed higher in the past two months and that's the green week on the chart.
The monthly close is irrelevant now. Decision will come either from a continuation or rejection. Ether is moving up, if it continues, the bulls won. If bullish momentum is lost and there is a reversal, the bearish scenario needs to be considered. As long as ETH trades above $2,000 (or $1,900), there is no need to consider lower prices, we should focus only on the next target.
Namaste.  Long
Long
Caution needed for Tesla, Heres the Macro TA reason whyHello.
Tesla on the 1 month timeframe warrants caution. Larger timeframe always dictate larger % moves for longer periods of time. And its something to always consider when trading and investing, i know i do.
Tesla has made strides as one of the best performing companies ever to exist. Thats a given and no one can say other wise. Evaluated at 1.5 Trillion.
But regardless no company, no asset is exempt from the grasps of market uncertainty created by human psychology and market algos. We must always consider all angles at all times or so help the market, we could face losses.
Some signs are showing that indicate a potential for continued sell off owing to the fact that bears may have gained control of late and could be winning the macro game as of now.
With literal day left before the Month of February candle close. We are nearing in on a close below a 4 Month long Support level of $427.00 ish.
With the likelihood of reaching the $400.00 psychological lvl for a major showdown of support.
Signs existed way in advanced of a Sell wall existing to crush demand. Dec. 2024 monthly candle indicates a massive sell off with massive upper wick.
Nov. and Dec. 2025 candles also printed with Upper wicks indicating sell pressure.
The $400.00 lvl is crucial and potentially where Bulls can step in again. Whole rounded numbers is just what humans like. And its where entries have been placed. So its an area where we need to keep an eye on as well. Whether a bounce back to continue uptrend or a breakdown to lower prices.
21 EMA is another safety net for long positioners. With it making its way up, watch where the purple line goes and if and when price reaches it, how it interacts.
Watch if 21 EMA reaches the $400.00 lvl. If this is the case we now have 2 supports converging. Will help the Bull/ Bounce case.
If these 2 can't hold price, TSLA can reach as low as the Uptrending Macro Support Line(Blue).
An indicator that i always gauge at on the Macro is the STOCH RSI. Great way to observe momentum shifts. AND it looks like a Bearish cross/ momentum signal is eminent. If you look left of everytime we have crossed down and notice price action, it has always indicated price drops to a T.
Only way to avoid is for a bull cross to show up which requires demand to come back to TSLA.
The reasons mentioned require awareness to TSLA and to observe what comes next. Further evidence needs to be sought out as well. Which i will be doing.
If you liked what you read, like, follow. I will be putting up more updates on TSLA as this progresses.
 Short
Short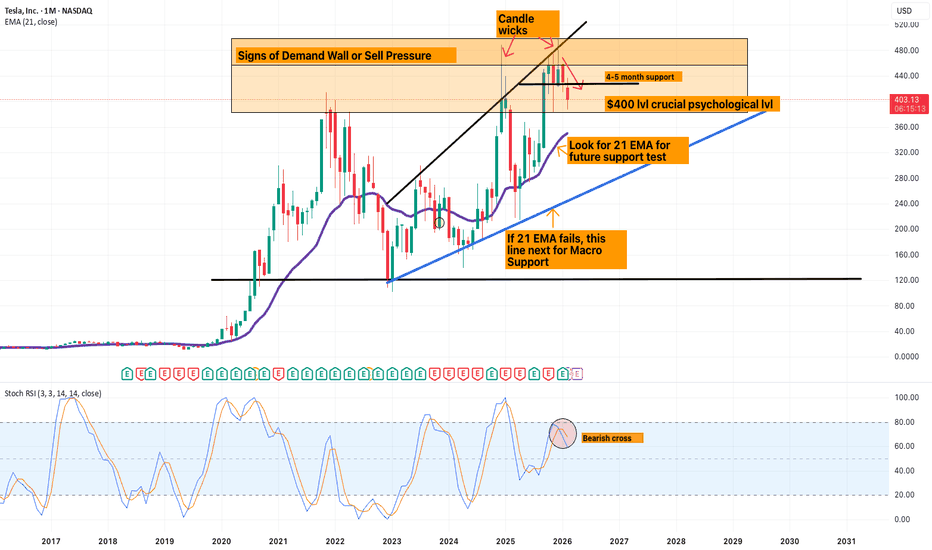
 Long
Long
 Short
Short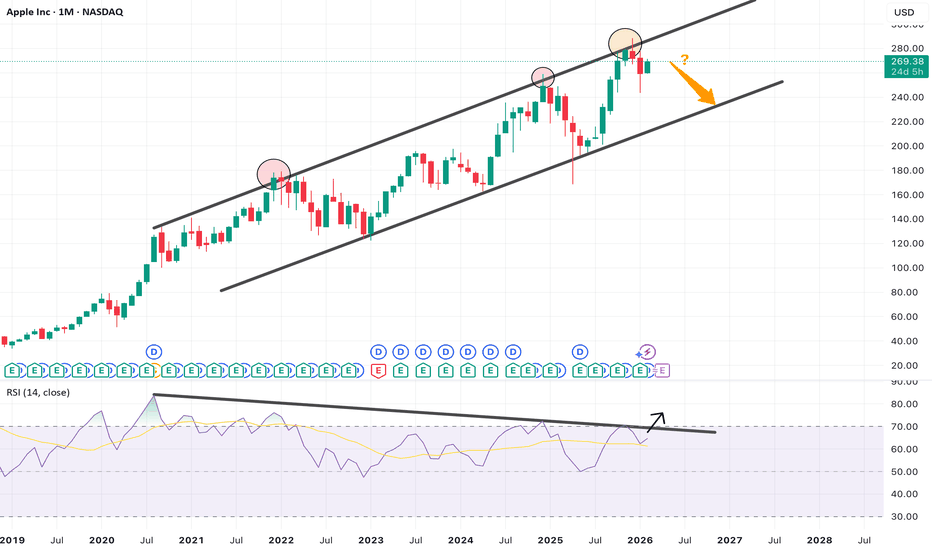
MACRO Bullish Case for GBCI on 1 MonthGlacier Bancorp (GBCI) has some Macro develops that have caught my eye on the 1 Month timeframe.
With the right lower timeframe signals, there may be a trade at some point.
Ill be looking at price action, chart patterns, indicators, candle configurations and more to continue my assessment on this.
NOTE: Being that this initial assessment is on 1 Month, keep in mind we still have 8 days for this month's candle close.
Also being that this is on 1 Month, price movements can showcase strong macro level trends, with potential long duration.
WHY this stock has caught my fancy?
Note price action, we are in a clear uptrend, maintaining the support trendline.
We are also currently breaking out of a Resistance trendline that was responsible for the declines from its top at roughly $58.00.
Though breakout seen, we are still in need of confirmation. Which we maybe able to gauge at in the 1 week.
The candle responsible for breakout is a massive Engulfing Bullish Candle.
We are also getting close to the Resistance Zone depicted by the red rectangle placed. WHich is an extreme Supply zone. It won't be easy to get past this so keep in mind potential push back.
Areas to consider Support test on the Resistance trendline and the Uptrend Support trendline.
Also we may be in a Ascending Triangle Pattern created by Support trendline + Horizontal Resistance.
Other Signs:
VOLUME: Positive Volume Uptrend, will need to see Volume Continue upward especially during breakout through resistance.
MOMENTUM Indicators:
If we maintain current trajectory of indicators at the close of this Months candle, Momentum will be on our side.
With Stoch RSI showcasing Bullish Cross above 20 lvl and MACD attempting to Cross ABOVE 0 lvl with Green histobar print.
All positive signs.
Such developments supports attention and observation on GBCI.
Look to more updates on this.
 Long
Long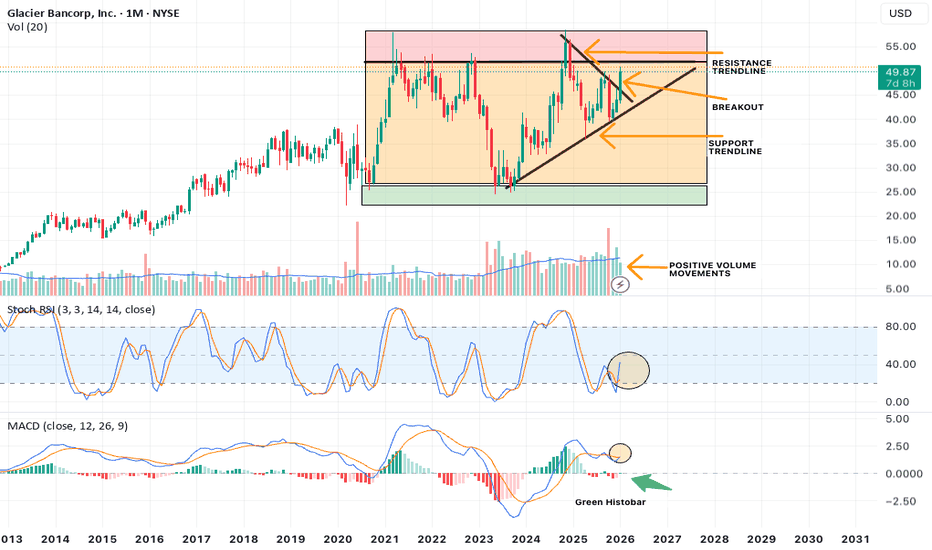
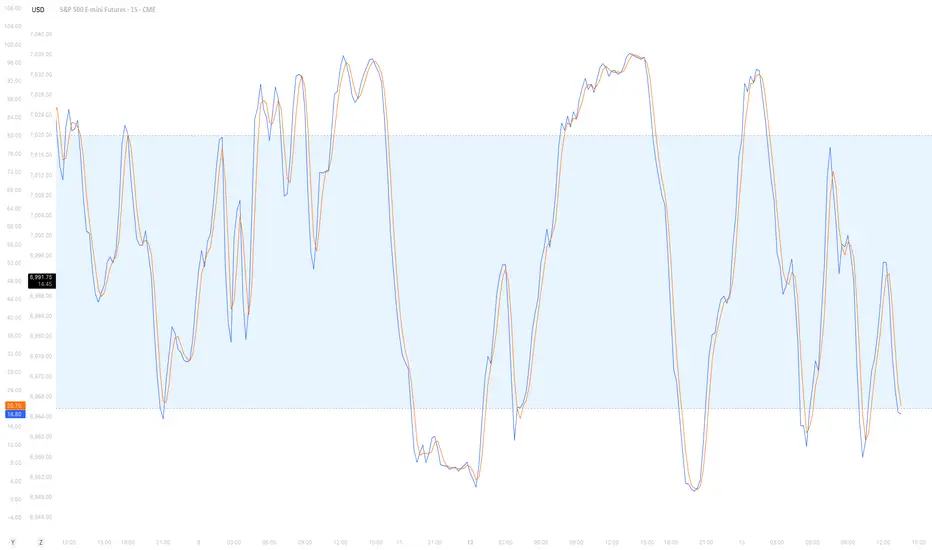
Understanding Stochastic Oscillator In TradingThe Stochastic Oscillator is one of the most widely used momentum indicators in technical analysis. It helps traders identify potential trend reversals, overbought and oversold conditions, and momentum shifts before price reacts.
Unlike trend-following indicators, Stochastic focuses on price momentum , making it especially useful in ranging or consolidating markets.
What Is the Stochastic Oscillator?
The Stochastic Oscillator compares the current closing price to the price range (high–low) over a selected lookback period.
Core concept: Momentum changes direction before price does.
When price is closing near the top of its recent range, momentum is strong. When it closes near the bottom, momentum is weakening.
The indicator consists of two lines:
%K – The main momentum line (fast)
%D – A smoothed moving average of %K (signal line)
These two lines oscillate between 0 and 100.
Stochastic Oscillator Formula
%K = (Current Close − Lowest Low) / (Highest High − Lowest Low) × 100
Where:
Lowest Low = Lowest price over the lookback period
Highest High = Highest price over the lookback period
This calculation shows where the current close sits relative to recent price extremes.
Default TradingView Settings
TradingView’s default Stochastic settings are:
%K Length: 14
%K Smoothing: 1
%D Length: 3
Overbought Level: 80
Oversold Level: 20
These values are balanced for most markets and timeframes. Shorter periods make the indicator more responsive, while longer periods reduce noise but increase lag.
How to Read the Stochastic Oscillator
The Stochastic Oscillator always moves between 0 and 100.
Above 80 → Market is considered overbought
Below 20 → Market is considered oversold
%K crossing above %D → Bullish momentum shift
%K crossing below %D → Bearish momentum shift
Important:
Overbought does not mean price must fall, and oversold does not mean price must rise. In strong trends, price can remain overbought or oversold for extended periods.
Common Trading Strategies
1. Overbought & Oversold Reversal Strategy
This is the most common use of the Stochastic Oscillator and works best in sideways or ranging markets.
Buy when %K crosses above %D below the 20 level
Sell when %K crosses below %D above the 80 level
2. Trend-Based Stochastic Strategy
In trending markets, Stochastic should be used as a confirmation tool rather than a reversal signal.
Uptrend: Look for oversold signals only
Downtrend: Look for overbought signals only
This approach helps traders stay aligned with the dominant trend.
3. Stochastic Divergence
Divergence occurs when price and the indicator move in opposite directions.
Bullish divergence: Price makes lower lows while Stochastic makes higher lows
Bearish divergence: Price makes higher highs while Stochastic makes lower highs
Divergence often signals weakening momentum and potential trend reversal.
Best Timeframes for Stochastic Oscillator
The Stochastic Oscillator can be applied to any timeframe, but signal quality generally improves on higher timeframes.
Scalping: 1m – 5m
Day Trading: 15m – 1h
Swing Trading: 4h – 1D
Lower timeframes generate more signals but also more false signals.
Advantages and Disadvantages
Advantages
Simple and easy to interpret
Effective for spotting momentum shifts
Works well in range-bound markets
Disadvantages
Prone to false signals in strong trends
Can lag during sharp price movements
Should be combined with other tools
Final Thoughts
The Stochastic Oscillator is a powerful momentum indicator when used correctly. It performs best when combined with:
Trend indicators such as moving averages or VWAP
Support and resistance levels
Price action and market structure
Always use confirmation and proper risk management before entering trades.
Trade smart and stay disciplined 📈
 Education
 Long
Long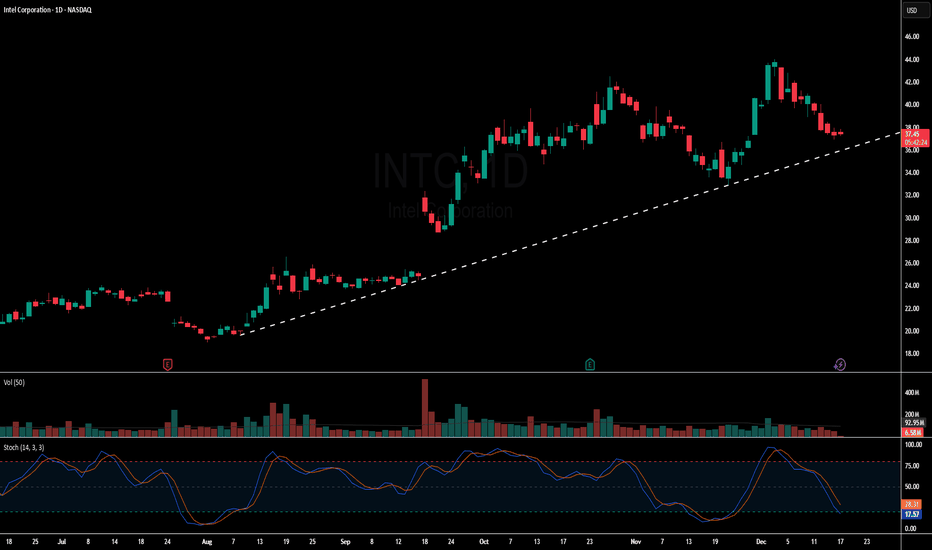
Possible Falling Wedge Reversal +90% run – 4H Setup - Worldcoin BINANCE:WLDUSDT could gain 90%
⚙️ Setup
Price has been trending down within a well-defined falling wedge since the local high.
Currently, it’s testing the lower trendline with Stochastics oversold and curving up, suggesting waning bearish momentum.
Volume has compressed, which is typical before a breakout.
We’re now at a decision point: either a bounce and breakout or a confirmed wedge failure.
Stochastics: Oversold (<20) with a possible bullish cross forming.
Volume: Decreasing — consistent with the final stages of compression.
EMAs: Price hovering around/under short EMAs (20–50); a close above them could trigger momentum shift.
📈 Plan / Hypothesis
Watching for bullish breakout confirmation above the upper trendline with increased volume.
Target: Height of the wedge projected upward (~ from breakout point).
Invalidation: 4H candle close below the lower trendline with volume expansion.
💭 Fundamenteal Thought:
We may or may not like Altman or Worldcoin's course of action to learn how to validate humanness, but the thing is, it's the only exposure we have to OpenAI and ChatGPT, and with AI everywhere, we are gonna need more than ever to validate people being real.
Considering Open AI, the disease, being worth $500 Billion, I think that the potential cure that Altman himself fabricated, Worldcoin, having a market cap of less than $3 Billion is pretty cheap. There's still many token to airdrop.
Anyhow, it all depends on what utility the token ends up delivering, I see that if this token is used to validate humanness, this will be really valuable. And ofc of what competitors do.  Long
Long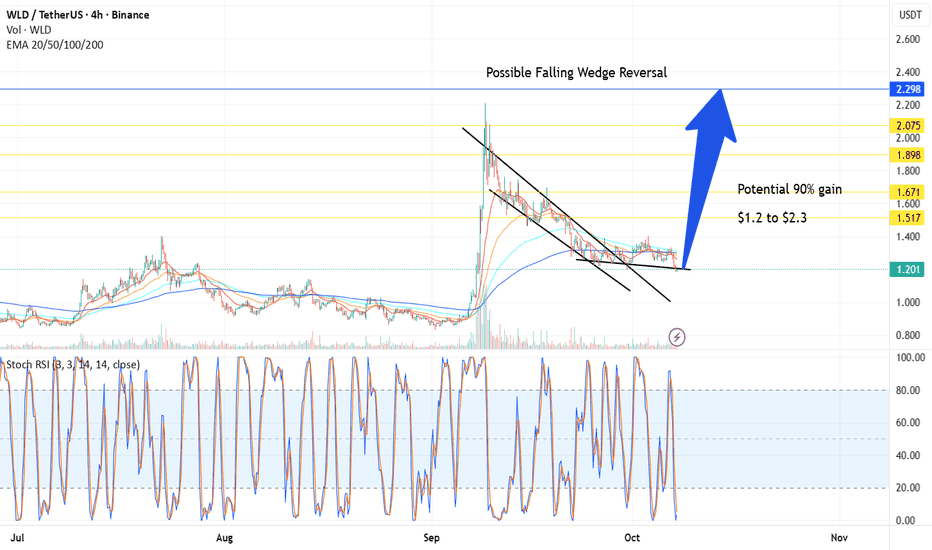
 Long
Long
ETH - On which side will it break-out?Today, the FED will decide on the interest rate in the USA. It is almost certain (99% probability) that the rate will remain unchanged. The most important aspect to focus on in this meeting’s minutes is the FED Balance Sheet. Will they stop tightening the balance sheet this month, or will they wait until mid-year as stated in January?
Leading up to the FOMC meeting, ETH is squeezing within its 4-hour pattern, forming equal highs and higher lows. This suggests a potential breakout to the upside.
I have outlined two possible scenarios:
1. ETH breaks through the resistance zone with strong volume, then successfully retests it as support.
2. ETH fails to break the resistance zone and instead breaks below the rising trendline.
Scenario 1:
Many stop-loss orders are accumulating just above the equal highs. If ETH manages to break out of the resistance zone with high volume and fill the gap, there is a chance it will flip this resistance into support. To confirm this, we need multiple candle closes above the resistance zone.
However, there is also a possibility that the FOMC meeting could trigger a price pump, only to drop immediately afterward, taking out stop-losses along the way.
Scenario 2:
In this case, ETH breaks below its rising trendline. For this to be a valid breakdown, it must be accompanied by high volume and a new lower low. If ETH breaks the trendline without forming a new lower low, it could be a fake-out. Therefore, we need confirmation: a lower low followed by a trendline retest.
Interesting Observations:
Stochastic RSI on the Daily Timeframe is rising rapidly into the overbought zone, while ETH remains in consolidation. Typically, we want the momentum of the Stochastic RSI to increase alongside price action. However, that is not happening here.
If the Stochastic RSI enters the overbought area and then crosses downward, it could put selling pressure on ETH, potentially leading to new lows in this downtrend.
Conclusion:
My base case is that ETH will sweep liquidity/stop-losses during the FOMC meeting with an initial upside move, followed by a sustainable correction downward in the coming days or weeks, accompanied by a decrease in the Stochastic RSI.
We’ll have to wait and see how the FOMC meeting unfolds.
Thanks for your support!
Drop a like and leave a comment to have a conversation about this topic. Make sure to follow me so you don’t miss out on the next analysis.
 Long
Long
 Long
Long
 Short
Short
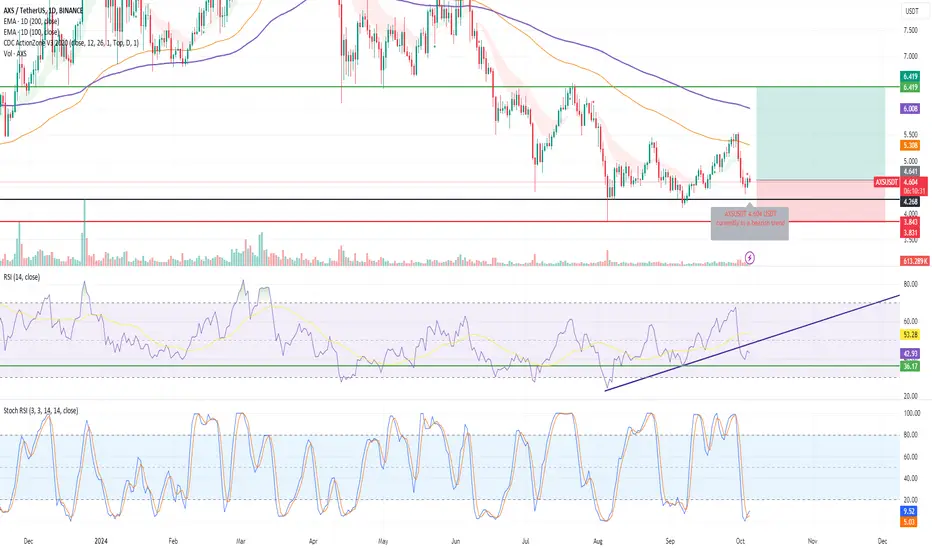
I have bought AXS From the AXSUSDT chart, it shows:
Market Trend: The chart is currently in a clear downtrend along the EMA (Exponential Moving Average) line, with the 100-day EMA and 200-day EMA still above the price chart, indicating strong resistance.
Important Support: The support area around 4.145 USD has been tested several times. If the price breaks this support level, it may see a continued correction to the 3.843 USD and 3.831 USD areas, which were previously rebounded.
Stochastic RSI: It is in the oversold zone (below 20), indicating that the market may have a chance to recover in the short term due to weaker selling pressure, but other indicators should confirm it.
RSI (Relative Strength Index): The RSI value at 40.61 is still in the downtrend zone. If the RSI value increases and crosses the 50 line, it may be a sign that the price has a chance to return to the uptrend.
Trading Volume: Trading volume has decreased during the price correction, which may indicate that selling pressure is starting to weaken. Or there are fewer sellers
Entry Recommendation:
Buying at the support level of 4.145 USD should consider waiting for confirmation from Stochastic RSI that there is a reversal from the oversold zone and see if the RSI value can cut through the 50 line. If so, it may be a good time to buy.
Set the stop loss below the important support level at around 4.00 USD to hedge the risk if the price falls below the support level.  Long
Long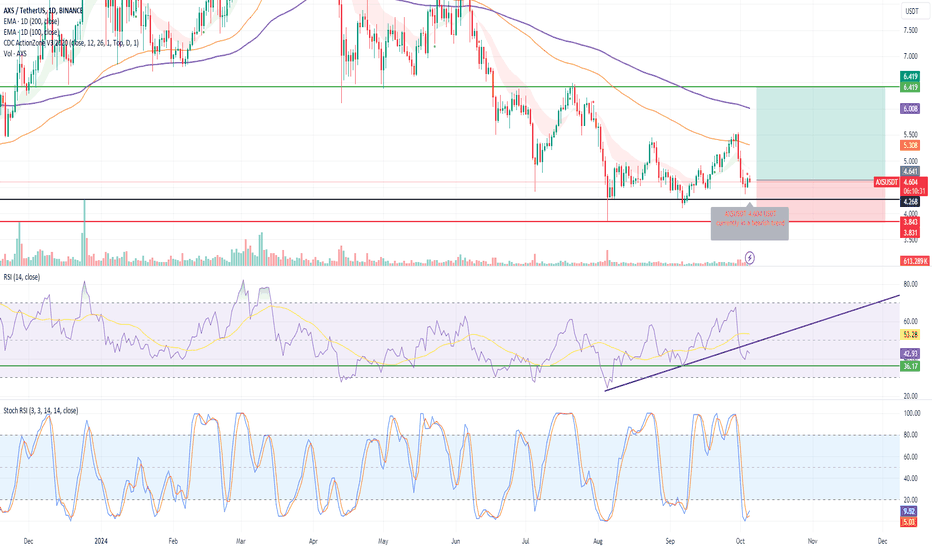
Bullish Alert: Tata Technologies|Strong Swing Trade Potential!📈 Bullish Alert: Tata Technologies Ltd. Shows Strong Swing Trade Potential! 🚀
Stock Analysis Report
Stock Name : Tata Technologies Ltd.
Timeframe: Daily
Current Market Price (CMP) : ₹1068
________________________________________
Trade Type
• Trade Type: Swing Trade
________________________________________
Technical Analysis
1. Trendline Breakout:
The stock has recently broken above a key trendline with increased volume, indicating a strong bullish signal.
Following the breakout, the stock has successfully retested the trendline, further
validating the upward momentum.
2. Indicators:
MACD: Buy signal confirmed.
Oscillator: Buy signal confirmed.
3. Moving Averages:
The price is currently trading above both the 50-day and 100-day moving averages, reinforcing the positive trend.
________________________________________
Target Prices
• T-1: ₹1115
• T-2: ₹1150
• T-3: ₹1180
________________________________________
Stop Loss
• SL: ₹1045
________________________________________
Summary : Tata Technologies Ltd. presents a strong swing trade opportunity. The stock exhibits a bullish trend supported by a recent trendline breakout, successful retest, and positive signals from key technical indicators. With the price trading above significant moving averages, potential target prices are set at ₹1115, ₹1150, and ₹1180, while a stop loss is recommended at ₹1045 to manage downside risk.
________________________________________
Disclaimer : " Please do not base your trades solely on the ideas mentioned above. Conduct your own research before making any trading decisions. We are not responsible for any financial losses that may result from applying this study or from taking any early entry or exit in trades. "
 Long
Long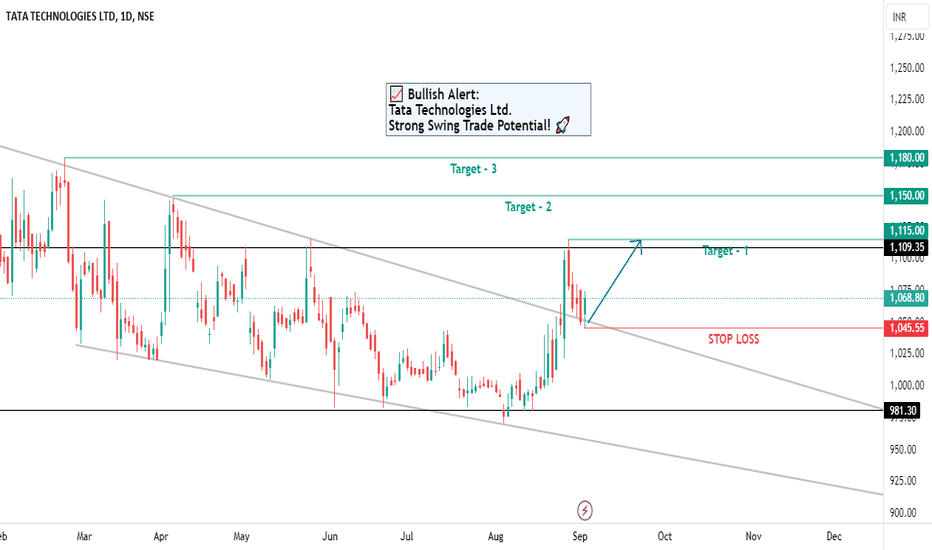
Long