HOW-TO: Understanding BUY, ADD, and EXIT Signals in Dynamic MomeDynamic Momentum Trend Signals (DMT Signals) is a systematic trend-following indicator designed primarily for medium- to long-term cryptocurrency market analysis.
Rather than attempting to predict exact market tops or bottoms, DMT Signals identifies changes in momentum and trend conditions after they are confirmed.
BUY — Initial Trend Entry
A BUY signal indicates that the conditions required for an initial bullish trend entry have been confirmed.
The purpose is not to identify the exact market bottom. Because the methodology requires confirmation, BUY signals may appear after an upward move has already begun.
ADD — Trend Continuation
An ADD signal indicates that an existing bullish trend has continued and additional momentum conditions have been satisfied.
Therefore, BUY and ADD represent different stages:
BUY → Initial bullish trend confirmation
ADD → Continuation of an established bullish trend
This allows trend development to be evaluated progressively rather than relying on a single entry signal.
EXIT — Bearish Momentum Confirmation
An EXIT signal indicates that bearish momentum conditions have been confirmed.
It is not designed to identify the exact market top. As with many trend-following approaches, part of an established move may be given back before sufficient evidence of trend deterioration appears.
Signal Confirmation
DMT Signals evaluates conditions using confirmed candle data. Signals are generated only after the relevant candle has been confirmed, and confirmed historical BUY, ADD, and EXIT signals are designed not to repaint.
This approach prioritizes confirmation and consistency over generating the earliest possible signal.
Market Conditions
DMT Signals is designed primarily for daily cryptocurrency charts. Trend-following methodologies generally perform best during sustained directional movements.
During sideways, choppy, or rapidly reversing markets, false signals and unsuccessful entries can occur.
A typical signal sequence can therefore be interpreted as:
BUY → bullish trend conditions confirmed
ADD → trend continuation conditions confirmed
EXIT → bearish momentum conditions confirmed
Not every market cycle will produce all three signals, and no individual signal guarantees a profitable trade.
DMT Signals is intended for analytical and educational purposes only and does not constitute financial or investment advice.  Education
 Long
Long
XAUUSD: Bulls Regain Control, but $4,500 Remains the Key TestGold has staged a strong recovery after the recent selloff, climbing back toward the $4,480 area following a gain of more than 2% on Thursday.
The short-term structure has improved significantly, but price is now approaching an important psychological and technical barrier around **$4,500**. This is the area I am watching for confirmation of whether the recovery can develop into a broader bullish continuation.
**Key levels**
Immediate resistance: **$4,490-$4,500**
Upside target: **$4,540**
Near-term support: **$4,440-$4,450**
Secondary support: **$4,380-$4,400**
As long as Gold holds above the $4,440-$4,450 region, buyers retain the short-term advantage. A sustained break and acceptance above $4,500 would strengthen the bullish structure and could open the way toward the $4,540 area.
However, rejection from $4,500 followed by a loss of $4,440 would suggest that the current move is still a recovery within the larger correction. In that scenario, $4,400 and then $4,380 would come back into focus.
Fundamentally, today's US employment report is the major catalyst. Gold rallied strongly on Thursday after Federal Reserve Governor Christopher Waller indicated that he could support keeping rates unchanged if inflation continues to moderate, reducing expectations for an immediate rate hike.
The Nonfarm Payrolls release could now significantly influence expectations for the Fed's September decision, so volatility around these technical levels may increase sharply after the data.
**Bias: cautiously bullish above $4,440, with $4,500 remaining the key confirmation level.**
Rather than chasing the recovery into resistance, I am watching how price reacts around $4,500 and whether buyers can defend the $4,440-$4,450 area on any pullback.
 Long
Long
 Long
Long
Short 
 Long
Long
XAUUSD — Bullish Setup From 4,425
Gold is building a bullish recovery structure after completing the previous bearish wave 5 near the lower demand zone. From Kelly’s view, the current chart suggests that XAUUSD may be preparing for another upside leg if buyers continue to defend the End wave C / Buy zone.
The key idea is simple: gold may correct slightly first, but as long as price holds above the buy zone, the bullish structure remains valid toward the upper liquidity area.
⟡ Market Structure
Gold reacted strongly from the 4,280–4,300 area, where the previous downside wave appears to have completed. After that, price created a new bullish impulse and is now consolidating around 4,472–4,488.
The most important support is the 4,420–4,430 Buy zone. This zone is marked as the potential end of wave C. If price pulls back into this area and buyers defend it, gold may start a new bullish wave.
The first confirmation area is around 4,488–4,500. A clean break above this zone would support stronger upside continuation toward 4,525–4,550, then the major liquidity target near 4,615–4,630.
➤ Key Levels
◌ Current price area: 4,472–4,488
◌ End wave C / Buy zone: 4,420–4,430
◌ Bullish confirmation: above 4,500
◌ First upside target: 4,525–4,550
◌ Main liquidity target: 4,615–4,630
◌ Bullish invalidation: below 4,400
⌁ Elliott Wave View
The chart shows that the previous bearish wave 5 may have already completed around 4,280–4,300.
From that low, gold is now forming a new recovery structure. The current pullback may be part of an ABC correction before the next bullish wave develops.
If wave C ends around 4,420–4,430, buyers may push price higher again. The next upside sequence can target 4,500, then 4,550, and finally the liquidity zone around 4,615–4,630.
This is why Kelly is not chasing buys at the current price. The cleaner plan is to wait for price to confirm support or break above the short-term liquidity level.
▸ Trading Scenario
Preferred bullish scenario
Entry: Buy around 4,420–4,430 if price gives bullish confirmation from the End wave C / Buy zone
Stop Loss: Below 4,400
Take Profit 1: 4,500
Take Profit 2: 4,525–4,550
Take Profit 3: 4,615–4,630
Alternative entry
If gold breaks and holds above 4,500, buyers may look for continuation toward 4,525–4,550 without waiting for a deeper pullback.
◌ Invalidation
The bullish view becomes weaker if gold breaks below 4,400 and fails to reclaim the buy zone. In that case, the recovery structure may need more correction before a new bullish setup appears.
⌁ Kelly’s View
Kelly’s main view is bullish while gold holds above 4,420–4,430. The market has already reacted strongly from the lower demand area, and the current movement looks more like a correction before continuation.
If buyers defend the buy zone and price breaks above 4,500, gold may continue toward 4,550 and the main liquidity zone near 4,615–4,630.
Do you think gold will retest the buy zone first, or break above 4,500 directly? Long 
XAUUSD 2H — Bullish Structure After Liquidity SweepMarket structure:
Price previously established a bullish sequence with multiple BOS confirmations.
The subsequent decline swept liquidity around the 4,300–4,320 area.
Price then reacted strongly from the lower 2H FVG / OB region.
A bullish MSS has now appeared around the 4,470–4,480 area.
The nearby Demand Zone around 4,430–4,445 is the key area to monitor for a potential retest.
Key levels from the chart:
MSS / structure: ~4,470–4,480
Demand zone: ~4,430–4,445
Lower 2H FVG + OB: ~4,310–4,340
Major lower FVG: ~4,280–4,295
Upside reference areas: ~4,560 and ~4,680
Possible scenario
If price holds the demand zone and maintains the bullish structure, continuation toward the higher resistance/liquidity areas could become technically relevant.
If price instead breaks and closes below the demand zone, the bullish continuation thesis becomes weaker and price could revisit the lower imbalance/OB areas.
TradingView-ready description
XAUUSD 2H — Market Structure & Demand Retest
Gold has shifted back toward a bullish structure after reacting from the lower 2H imbalance area. The recent bullish MSS near 4,470–4,480 suggests a potential change in short-term structure.
The 4,430–4,445 region is the main demand area to monitor. A sustained reaction from this zone could support continuation toward higher liquidity/resistance areas around 4,560 and potentially 4,680.
A decisive move below the demand zone would weaken this scenario and bring the lower 2H FVG/OB area back into focus.
This is technical market analysis for educational purposes, not financial advice. Price can invalidate the scenario at any time. Long 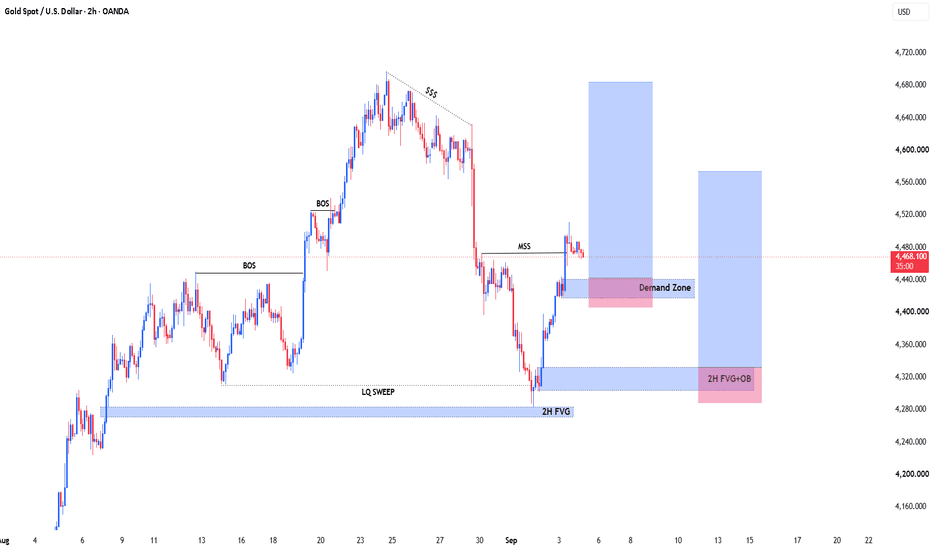
 Short
Short
 Short
Short
Long 
Gold Holds Key Support — Is the Recovery Ready to Continue?Market Structure
Gold remains within a broader bullish structure despite the recent corrective decline. After retreating from its recent highs, price has found buying interest near a key support zone and is attempting to stabilize. The latest rebound suggests buyers are returning, although stronger confirmation above nearby resistance is still required before the broader uptrend resumes.
Market Sentiment - Moderately Bullish
Short-term momentum has improved following the recent bounce from support, while the broader trend continues to favor buyers. Market sentiment remains cautiously optimistic as long as price holds above the recent demand zone.
Bullish Scenario
If buyers maintain control above the current support area and reclaim 4,500, bullish momentum could strengthen further. A sustained move above 4,560 would increase the probability of another advance toward the recent swing highs around 4,650.
Bearish Scenario
If sellers push price below 4,400, the current recovery may fail and expose the next support around 4,320. A decisive break beneath that level would increase the risk of a deeper corrective move.
────────────────────
Market Outlook
The recent rebound suggests that buying interest is returning after the previous correction. However, price still needs to overcome nearby resistance before confirming that the broader uptrend has resumed. Until then, the market remains in a recovery phase within a larger bullish structure.
────────────────────
Key Levels
First Resistance 4,500
Second Resistance 4,560
First Support 4,400
Second Support 4,320
────────────────────
Future Scenarios
A sustained move above 4,500 would indicate that buyers are regaining control and could drive price toward 4,560 before potentially retesting the recent highs near 4,650.
However, if price fails to hold above 4,400, selling pressure may return and extend the correction toward 4,320 before buyers attempt another recovery.
────────────────────
Event Risk
Gold remains highly sensitive to global macroeconomic developments and monetary policy expectations.
Traders continue to monitor Federal Reserve policy expectations, U.S. Treasury yields, inflation data, labor market reports, movements in the U.S. Dollar Index, and geopolitical developments. These factors remain the primary drivers of gold's short-term direction.
The next confirmed major macro event is the Federal Reserve meeting on September 15–16, 2026. Any change in interest-rate expectations could significantly influence gold through real yields, U.S. dollar movements, and overall market risk sentiment.
Ultimately, price reaction matters more than the headlines. If positive news cannot push gold above 4,500–4,560, upside momentum may remain limited. Conversely, if negative news fails to break 4,400–4,320, buyers may be preparing for another advance within the broader uptrend.
────────────────────
Please share your view below:
Do you expect gold to resume its primary uptrend from current support, or is a deeper correction becoming more likely?
More market structure and key level updates will be shared regularly. XAUUSD: Resistance Holds, Bearish Pressure Could ReturnXAUUSD remains under pressure on the H4 timeframe despite the recent recovery from the 4,300 area. Price is now approaching the key 4,490–4,520 resistance zone, where the rebound is beginning to lose momentum.
If price continues to stay below this resistance and selling pressure returns, I expect XAUUSD to move lower toward 4,425. A decisive break below this level could extend the decline toward 4,370.
The technical structure remains relatively bearish, as the current recovery is still trading beneath an important resistance area. Consequently, I favor a “sell on rally” strategy while the 4,490–4,520 zone remains intact.
Main Trend: Bearish | Resistance: 4,490–4,520 | Target: 4,370 Short 
NAS100: Trendline Breakdown & Liquidity Retest🔹 NAS100 is showing a corrective shift after facing strong rejection from the 29,700–29,800 resistance area. Price has moved below the rising trendline that supported the previous advance, suggesting that short-term market structure has weakened. The recent lower high and move toward 29,100 highlight increasing selling pressure, while the 28,250–28,400 region stands out as a visible liquidity and support area.
🔸 If the bearish structure remains intact, price could continue exploring lower levels toward the highlighted liquidity area, particularly if the 29,200–29,300 region continues to act as resistance. On the other hand, a strong reclaim above the broken structure could shift the short-term view back toward the resistance zone. Traders may wait for clear price confirmation before considering any trade, while a failure to hold the current area could expose deeper support levels.
This analysis is for educational purposes only and does not constitute financial or investment advice. Always conduct your own research before making trading decisions.  Short
Short
 Long
Long
XAUUSD:Bullish Reversal off H4 Demand Zone (FVG + OB Mitigation)Market Structure & Technical Breakdown
Higher Timeframe Context: Gold underwent a prolonged bearish expansion after breaking structure (CHOCH and BOS to the downside), leading to a Market Structure Shift (MSS) around the 4,380 level.
Internal Structure Shift: Price swept liquidity near 4,280 and pushed aggressively to the upside, breaking local resistance (BOS) to signal potential bullish momentum.
Point of Interest (POI): Price is currently retracing toward a strong demand confluence comprising a 4-Hour Fair Value Gap (H4-FVG) spanning approximately 4,380–4,410 and a 4-Hour Order Block (H4-OB) situated around 4,370–4,390.
Trade Setup & Strategy
Bias: Long / Bullish
Entry Zone: Mitigation of the H4-FVG or lower into the H4-OB zone (~4,380 – 4,410).
Take Profit (Target): Liquidity pool / recent swing high at ~4,465 – 4,470.
Invalidation / Stop Loss: A sustained 1H close below the H4-OB (~4,365). Long 
XAUUSD 4H — Reaction From H4 FVG Could Define the Next Leg MarkGold has experienced a strong bearish displacement from the 4,600 area into the 4,300–4,320 region. Price is now approaching a previously identified H4 Fair Value Gap (FVG), with a deeper H4 Order Block (OB) below it.
Technical view
Current price: ~4,322
H4 FVG: roughly 4,275–4,305
H4 OB: roughly 4,220–4,260
Upside liquidity: around 4,625 and 4,695
The recent sell-off has created a significant imbalance, so the FVG/OB area is important for assessing whether buyers can regain control.
The LQ sweep near the recent low adds confluence, but confirmation is still required.
Bullish scenario
If price retraces into the 4,275–4,305 FVG and shows a clear bullish reaction, the area could act as support. A sustained recovery above the nearby structure would strengthen the case for a move toward the 4,625 liquidity level, with the higher 4,695 area as a secondary objective.
Invalidation / bearish scenario
If price decisively breaks and holds below the H4 OB around 4,220–4,260, the bullish thesis would lose strength and the market could continue its broader bearish structure.
Key idea: Rather than assuming an immediate reversal, I would watch how price behaves inside the H4 FVG/OB zone. The reaction there should determine whether this is a retracement opportunity or continuation of the bearish move.
TradingView-safe note: This wording focuses on chart analysis, reasoning, conditional scenarios and invalidation rather than presenting a guaranteed result or a bare “BUY/SELL” call. TradingView specifically recommends explaining why the view exists and what would invalidate it; it also prohibits promotional content and after-the-fact ideas.
Suggested title
XAUUSD 4H: H4 FVG Reaction Could Shape the Next Move
Suggested TradingView description — ready to paste
Gold is currently trading near an important H4 imbalance after a strong bearish displacement from the 4,600 area.
The H4 FVG around 4,275–4,305 is the first area I am watching for a potential reaction, while the H4 OB around 4,220–4,260 represents a deeper support zone.
If price respects the FVG/OB area and develops bullish confirmation, attention could shift toward the upside liquidity around 4,625, followed by the 4,695 region.
A sustained break below the H4 OB would weaken this bullish scenario and suggest that the bearish structure remains dominant.
For now, the reaction around these H4 zones is more important than anticipating the direction prematurely Long 
XAUUSD 1H | Resistance Retest vs Bullish BreakoutMarket Structure
Gold is currently testing a major 1H resistance/supply zone around 4,435–4,465 after recovering strongly from the 4,280–4,300 1H Order Block.
The previous bearish channel has been challenged, so price is now at an important decision area. ⏳
🟢 Bullish Scenario
A strong 1H close above 4,465 followed by a successful retest could indicate that resistance has been reclaimed. 🔓
🎯 Potential upside areas:
4,600
4,680
🔴 Bearish Scenario
If price gets rejected from the 4,435–4,465 resistance zone and forms a lower high/reversal structure, downside pressure could return. ⚠️
🎯 Potential downside areas:
4,320
4,280–4,300 1H OB
🔑 Key Levels
🟥 Resistance: 4,435–4,465
🟢 Breakout confirmation: Above 4,465
🎯 Upside: 4,600 → 4,680
🔻 First downside: 4,320
🔵 Major support / 1H OB: 4,280–4,300
🧠 SMC + Price Action
The 1H Order Block remains an important demand area, while the current resistance zone is the key area to watch for either liquidity rejection or breakout + retest confirmation.
⚖️ Bias: Neutral-to-bullish while the 1H OB holds, but confirmation is preferred before considering continuation.
📌 This is a technical-analysis scenario for educational purposes only. Price can move in either direction, so proper risk management is essential. Long 
Silver | Has Wave IV Ended, or Is One More Decline Still Ahead?⏱️ Reading Time: About 2 Minutes
🟦 Scenario 1 | Bullish Case
In the bullish scenario, Wave IV may have already been completed as a Zigzag, while Wave II of the same degree formed an Expanded Flat. This difference is consistent with the Elliott Wave guideline of alternation between corrective waves.
However, confirmation of a continuing bull market does not depend solely on higher prices. After each advance, the current structure should produce a clear and clean correction appropriate to its wave degree, character, and position within the larger pattern.
Therefore, confirmation of the bullish scenario depends on how the current structure continues to develop. By examining lower degrees—especially the daily chart—we can better identify the character of the advance and the corrective structures that follow.
⬛ Scenario 2 | Bearish Case
The bearish scenario still considers the possibility that the previous decline was only the first leg of a larger corrective structure, such as a classic Zigzag.
In that case, the current advance may simply be a corrective move—either a sharp correction or a Zigzag. Once this corrective structure is completed, another decline may remain to complete the larger Wave IV structure.
Ultimately, the future structure will determine whether Wave IV has truly ended and the market has entered the next bullish phase, or whether the larger correction still requires one more move lower.
The structure is still speaking. Our job is to give it enough time to prove itself.
— Mr. Nobody | Elliott Wave Principle
Silver / U.S. Dollar
Aug 8
##Leading Diagonal Completed | What Is Silver Telling Us Next?


