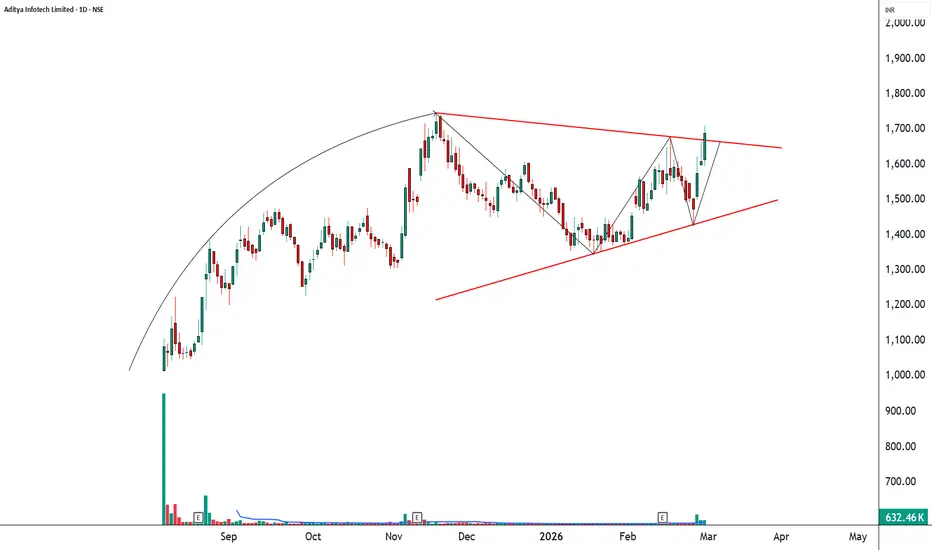
ICICIGI Three White Soldiers Within a Large Ascending Triangle📊 ICICI Lombard General Insurance: Daily Technical Snapshot – Three White Soldiers Emerging Within a Large Ascending Triangle
📊STWP Equity Snapshot
________________________________________
MARKET STRUCTURE SNAPSHOT | NSE: ICICIGI | DAILY
________________________________________
• Closing Price: 1,839.00 (+48.50 | +2.71%)
• Core Trend: Downtrend (Weakening) / Recovery Structure Emerging
• Market State: Consolidation Near Breakout Zone
• Price Structure: Ascending Triangle Formation with bullish
Three White Soldiers
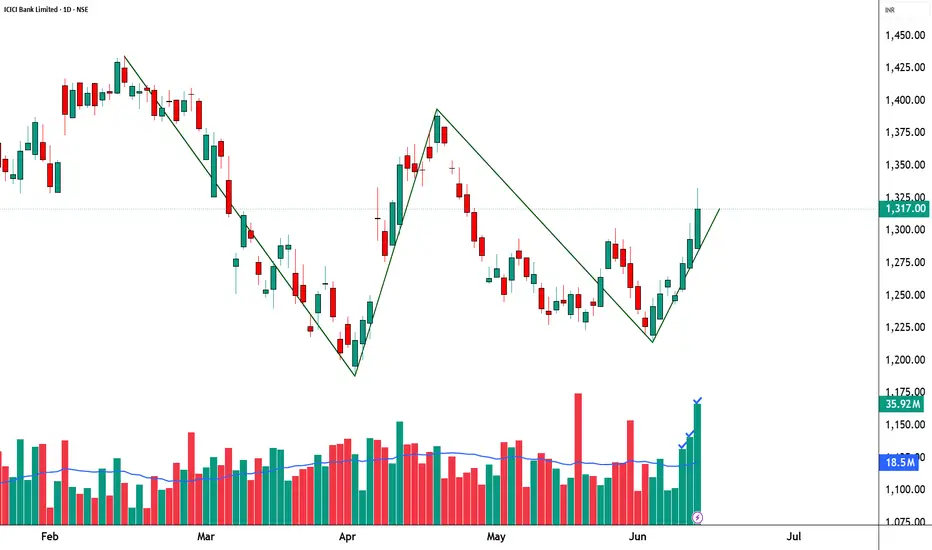
ICICIBANK Three White Soldiers - Developing W PatternICICI Bank: High-Volume Reversal Attempt Emerges as Weakening Downtrend Approaches Critical Structural Pivot
Market Context & Structural Shift
ICICI Bank is displaying an increasingly constructive technical profile on the daily timeframe as a weakening downtrend begins transitioning into a potential recovery phase. While the broader trend has not yet fully reversed, recent price action suggests that selling pressure is losing intensity and buyers are gradually regaining control.
The most sig
CPPLUS – STWP Equity Snapshot📊 CPPLUS – STWP Equity Snapshot
Ticker: NSE: CPPLUS
Sector: Electronic Security / Surveillance Systems
CMP: 1,689.00 ▲ (+4.91% | 27 Feb 2026)
Learning Rating: ⭐⭐⭐⭐☆ (Strong Continuation Within Expanding Structure)
Chart Pattern Observed: Three White Soldiers After Consolidation Base
Candlestick Context: Strong Bullish Expansion Candle with Above-Average Participation
CPPLUS has transitioned from a prolonged consolidation structure into a decisive bullish expansion phase, reclaiming prior supply
Three White Soldiers & Three Black CrowsHello, Traders! 😎
In technical analysis, not all candlestick patterns are created equal. While some merely hint at indecision or short-term corrections, others shout with conviction: "Trend reversal is coming…" Two of the most powerful momentum candlestick formations are the Three White Soldiers and the Three Black Crows. When they appear, traders PAY ATTENTION. In this article, we’ll dive deep into: What do these patterns look like? Why do they form? What do they tell us about market psycholog
XAUUSD Support Zones for 9 July
SAXO:XAUUSD
🏆 XAUUSD (Gold) Market Update
📊 Range: $3,270 – $3,360
🕯️ Pattern: Three White Soldiers formed after recent selling pressure, signaling potential bullish momentum.
🛡️ Support: $3,270 & $3,175
Yesterday, Gold shed over 1% as the Fed’s restrained dovish tone cooled investor enthusiasm 📉. Despite ongoing trade tension concerns, markets are reassessing the near-term outlook for precious metals amid shifting Fed expectations.
💡 Today, Gold is stabilizing near $3,300 during Asian a
BTC | W-BOTTOM Pattern Continuation - UPDATEA quick continuation on yesterday's BTC update, with regards to the bullish W bottom pattern that likely takes us into the new ATH.
There are a few conditions that need to be met in order to "secure" the W pattern, but we're currently not seeing these conditions met. The good news, is that it's beginning to look more like a cup an handle pattern, also a bullish pattern.
This daily lose and especially the weekly close is going to be a KEY candle close to watch.
___________________
BINANCE:BT
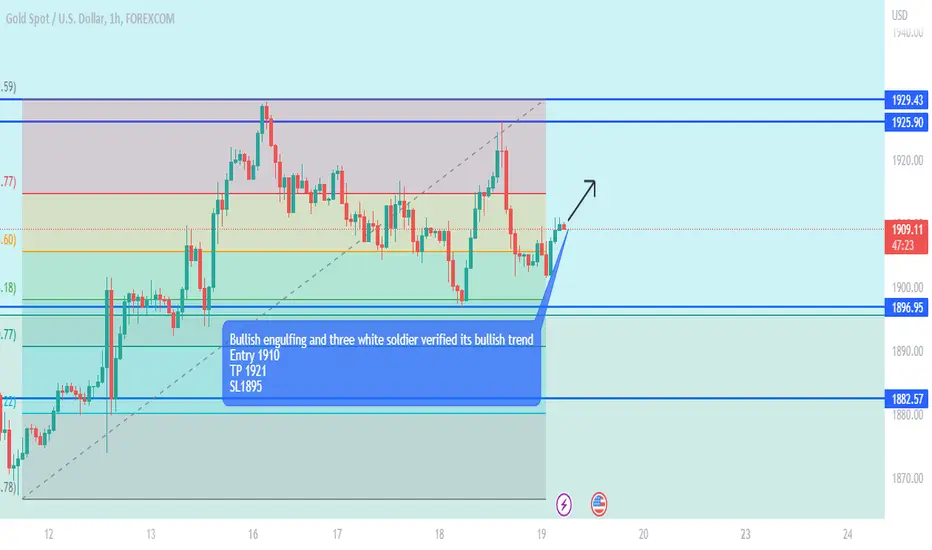
Will Three White Soldiers Lead the Way?OANDA:XAUUSD Analysis
4H Chart
Current Price: 2447.215
Analysis Summary
• Three White Soldiers Pattern
• Volume Analysis
• Overbought and Resistance Zone
• Overall Bullish Trend
Three White Soldiers:
The chart shows a clear Three White Soldiers pattern, a strong bullish reversal candlestick formation indicating potential upward momentum. This pattern suggests consistent buying interest, as each candle closes higher than the previous one, signaling sustained demand.
Volume Analys
LINK - Three White Soldiers Candlestick PatternIn the weekly timeframe, a bullish candlestick pattern has formed on Chainlink.
The Three White Soldiers are characterized by three consecutive green candles. The higher the timeframe, the more powerful the pattern. We've recently observed an instance of the TWS pattern in the weekly, which was a precursor to a 136% increase:
However, the unfilled wick around $8 remains a concern - but also a potential for buying in / accumulating at a lower price.
_________________________
BINANCE:LINKUSD
Bitcoin PATTERN - BTC Roadmap to NEW ATHBINANCE:BTCUSDT
👉 Trendline Analysis: BTC has been consolidating directly underneath the resistance zone - BULLISH
👉 Candlestick Analysis: Three white soldiers in the 2W timeframe - BULLISH
👉 Technical Indicator Analysis : Price has cooled down after being "Extremely Overbought", moving averages holds - BULLISH
Technical Indicator Monthly Timeframe:
Technical Indicator Weekly Timeframe:
There is really only one concerning matter, and that is from a potential near term scenario:
❗ P
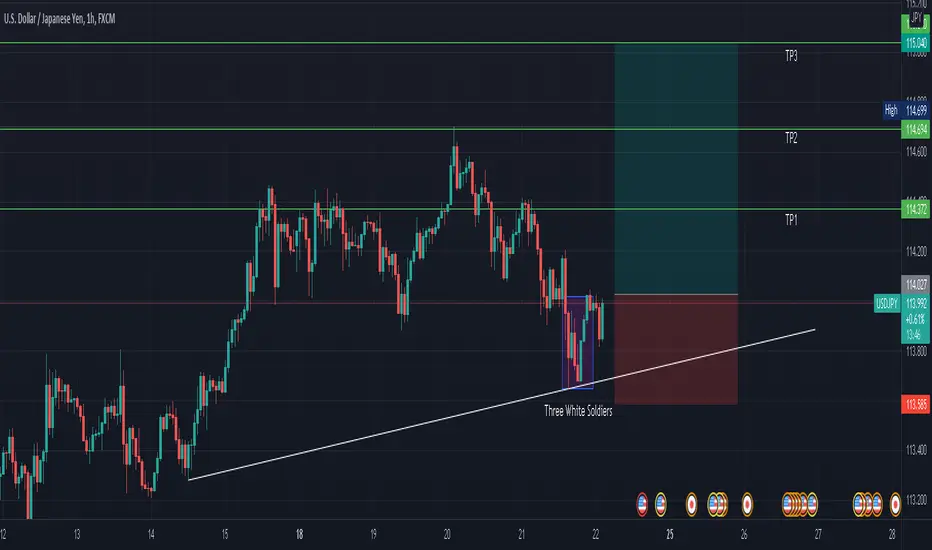
Three White SoldiersGreetings, traders! Today, let’s dive into a powerful candlestick pattern: the Three White Soldiers. This pattern, often regarded as a bullish signal, can provide valuable insights.
Understanding the Three White Soldiers Pattern:
The Three White Soldiers pattern is identified by three consecutive bullish candles, symbolizing a robust influx of buying pressure. When these candles appear in a sequence, it suggests a shift in market sentiment from bearish to bullish.
Key Characteristics:
B
NATURALGAS: 3 White Soldiers at Bullish Shark PCZAt the start of the year Natural Gas had a potential Bullish Shark setup at the minimum .886 PCZ and it ultimately failed to pivot from there but now we are significantly lower at the 1.13/1.618 Confluence zone of this Shark and are showing Bullish Divergence on the MACD as well as a 3 White Soldiers pattern on the daily. The bullish Target for Natural Gas remains to be $4.5 but it could go as high as $9.00. As for stops i'd put it below the second candle of the 3 White Soldiers Pattern which s
NLong
The Three Black Crows PatternThe Three Black Crows or as otherwise known Three Soldiers are a formation of price continuation showing how the bears are taking control over the bulls to reverse the trend as we can see here.
Price comes down buyers try to push it back up only to be reversed by sellers overpowering them so it falls back down the buyers try again but realise the bear is the almighty and with that last attempt they withdraw from the market causing a big sell off with a strong downward movement when just the be
FTM/USDT BINANCE W Three White Soldiers (propsect)FTM/USDT BINANCE W Three White Soldiers (prospect)
Here is a three white soldier candlestick pattern
wait for Price and breakout confirmation
when bullish breakout watch target with the green horizontal ray
FLong
BTCUSD - WEEKLY - THREE WHITE SOLDIERS !Good morning to all of you.
Today we are going to look closely at the weekly picture in drawing several trading zones :
I : BREAKOUT TRADING ZONES
II : BULLISH ZONE
III : SUPPORT ZONE
BREAKING ZONES :
In looking at the last three weeks price action, a " Three white soldiers" pattern has been identified and each weekly closing level confirmed an upside breakout
BULLISH ZONE :
Current weekly closing will give an important indication about further development. Indeed, a weekly closing ab
3 White Soldiers ABCD ContinuationWe have a 3 white soldiers pattern that has been retraced 50 percent of the way, if we see a reversal here then i expect another big wave up.
This is a continuation trade that can lead to a much bigger move up later on, checkout the related idea for the bigger bullish target.
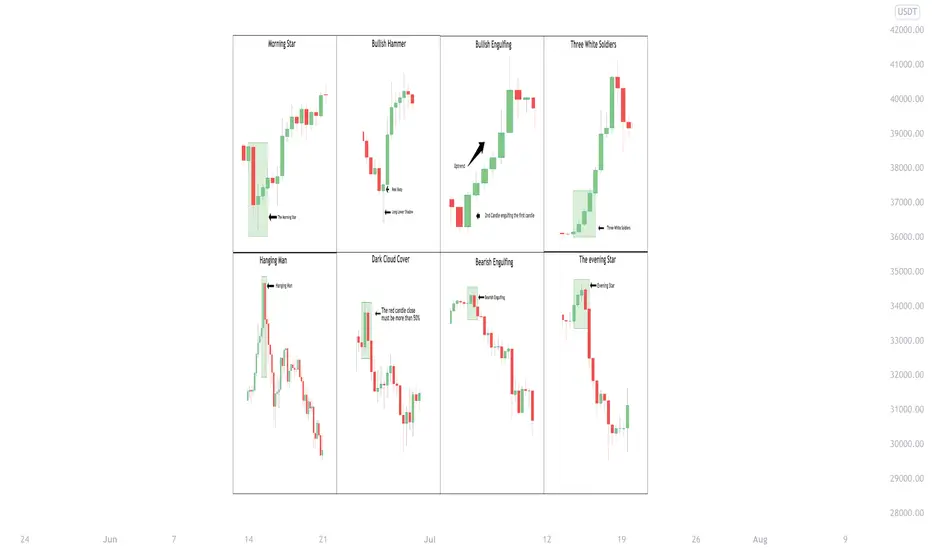
Let's talk about Candlestick Chart PatternsThe candlestick chart patterns are used by traders to set up their trades, and predicting the future direction of the price movements. There are many candlestick chart patterns. I will be discussing a few of those.
✅ Morning Star is formed after a downtrend indicating a bullish reversal. Generally made of 3 candlesticks, first being a bearish candle, second a Doji, and third being a bullish candle. The first candle shows the continuation of the downtrend, the second being a Doji shows indecisi