XAUUSD — 4,591 Breakout, 4,646 Next Test?
Gold is showing a very strong bullish structure after breaking above the previous resistance area.
Price is now trading around 4,590 - 4,600, right above the 1.0 Fibo zone near 4,591.
This is a powerful breakout.
But after a strong move, I still do not want to chase the candle blindly.
The simple read
The key level now is 4,591.
If gold holds above 4,591, buyers may try to continue toward the next Fibo extension zone around 4,646.
That 4,646 area is important because it can become the first major sell reaction / profit-taking zone.
If momentum stays strong above 4,646, the medium-term upside area near 4,735 becomes the next zone to watch.
But if gold fails to hold above 4,591, a pullback can appear first.
The first buy retest area is around 4,572 - 4,557.
Below that, the stronger buy zone sits around 4,531 - 4,539.
Key price zones
Current price area: 4,590 - 4,600
Breakout confirmation zone: 4,591
First buy retest zone: 4,572 - 4,557
Main buy zone: 4,531 - 4,539
Previous resistance support: 4,450
First Fibo extension target: 4,646
Medium-term goal: 4,735
Trading plan
Bullish continuation scenario
If gold holds above 4,591:
The breakout structure remains strong.
Price may continue toward 4,646 first.
If 4,646 breaks with confirmation, the next upside area becomes 4,735.
Pullback buy scenario
If gold pulls back from the current price:
I will watch 4,572 - 4,557 first.
A clean reaction from this area may support another bullish continuation attempt.
If this zone fails, 4,531 - 4,539 becomes the deeper buy reaction zone.
Resistance reaction scenario
If gold reaches 4,646:
I will watch price action carefully.
This is a Fibo extension zone, so the market may slow down or reject before choosing the next move.
No rejection = no forced sell.
Tiara’s View
Gold is bullish, but the market is now moving after a strong breakout.
4,591 is the level buyers need to protect.
4,646 is the next major reaction zone.
4,572 - 4,557 is the first retest area.
4,531 - 4,539 is the deeper buy zone.
The clean plan is simple:
Do not chase the breakout late.
Wait for 4,591 to hold.
Or wait for the retest reaction.
Reaction first.
Confirmation second.
Trade last.
No confirmation = no trade.
Do you think gold can hold above 4,591 and push toward 4,646, or will the market retest 4,572 first?
 Long
Long
 Long
Long
XAUUSD — 4,500 Is the Gate to 4,650?
Gold is showing a strong bullish structure after breaking above the previous resistance zone.
The market pushed sharply from the lower support area and is now trading around 4,480 - 4,500, right under the short-term breakout line.
This is where the chart becomes very interesting.
The trend is bullish.
But after a strong move, I still do not want to chase the candle.
I want to see if buyers can defend the new structure.
The simple read
4,500 is the first important gate today.
If gold breaks and holds above 4,500, buyers may try to push price toward the weekly high around 4,524 - 4,527.
That area is important because it aligns with the 1.618 Fibo reaction zone.
If momentum remains strong above 4,527, the medium-term target zone around 4,650 becomes the next major area to watch.
But if gold fails to hold above 4,500, a pullback may appear first.
The key buy zone is around 4,475 - 4,490.
If buyers defend this OB area, the bullish continuation plan remains healthy.
Below that, 4,450 is the previous resistance zone and can become an important retest support.
Key price zones
Current price area: 4,480 - 4,500
Breakout gate: 4,500
Weekly high / Fibo reaction: 4,524 - 4,527
Medium-term goal: 4,650
Buy zone OB: 4,475 - 4,490
Retest support: 4,450
Bullish continuation improves above: 4,500
Short-term structure weakens below: 4,450
Trading plan
Bullish continuation scenario
If gold breaks and holds above 4,500:
The bullish structure becomes stronger.
Price may continue toward 4,524 - 4,527 first.
If buyers keep control above that area, 4,650 becomes the medium-term reaction target.
Pullback buy scenario
If gold rejects from 4,500:
I will watch the 4,475 - 4,490 buy zone.
A clean reaction from this area may support another bullish attempt.
If this zone fails, 4,450 becomes the next important support to watch.
Deeper retest scenario
If 4,450 breaks clearly:
Gold may need more correction before the next bullish setup.
In that case, I would wait for a new reaction instead of forcing entries.
Tiara’s View
Gold is bullish, but the market is now near a breakout gate.
4,500 is the key level.
4,524 - 4,527 is the first upside reaction zone.
4,650 is the medium-term goal if buyers keep control.
4,475 - 4,490 is the first buy zone to defend.
The clean plan is simple:
Do not chase the top.
Wait for 4,500 confirmation.
Or wait for the OB buy zone reaction.
Reaction first.
Confirmation second.
Trade last.
No confirmation = no trade.
Do you think gold can break 4,500 and open the road toward 4,650, or will it retest the buy zone first?
Long 
 Long
Long
HYPEUSDT - A Pullback Before a Bull Run BINANCE:HYPEUSDT.P is forming a local bullish setup. The altcoin is outperforming the broader market, including Bitcoin, and for this reason, the coin has further upside potential
Bitcoin, meanwhile, remains neutral within a consolidation that has been developing for several months as part of the broader global bearish market.
HYPE maintains its global bullish trend, within which a 53.0–75.0 trading range is forming. The range is relatively wide, and the bounce from support opens up a medium-term trading opportunity. There is still room for further upside, and we are waiting for the bulls to step in more aggressively
Resistance levels: 60.47, 63.0
Support levels: 58.0, 57.09
The market is confirming its local bullish structure. However, after reaching a new high, a counter-trend correction is developing toward the imbalance zone.
An upside breakout followed by consolidation above 58.0 could provide the catalyst for the continuation of the uptrend toward 60–63
Best regards,
R. Linda  Long
Long
Long 
How Will Gold Perform Ahead of the FOMC Announcement?XAUUSD – H1 | Technical Update
Current Price: ~4,367
* 🔵 Major Resistance: 4,395–4,400 — Strong supply zone where price has been rejected multiple times.
* 🔴 Key Level: 4,358–4,360 — Short-term pivot; price is currently holding above this zone.
* 🟢 Major Support: 4,310–4,320 — Demand zone + ascending trendline confluence.
* 📈 Trendline: Still valid, but price is currently recovering after the decline from 4,400.
Main Scenarios
🟢 Bullish:
If price holds 4,358–4,360, then breaks and closes an H1 candle above 4,400 → this would confirm the breakout, with the next targets around 4,420–4,440.
🔴 Bearish:
If price is rejected from 4,395–4,400 and closes an H1 candle below 4,358 → price could retest 4,340, followed by the deeper support zone at 4,310–4,320.
👉 Current Bias: Neutral → Slightly Bullish. Preferably wait for price reaction around 4,358–4,360 or a clear breakout above 4,395–4,400. Avoid chasing the price while it remains below the resistance zone.
⸻
TRADING PLAN
🟢 BUY GOLD
* Entry: 4,316–4,318
* Stop Loss: 4,306
* Take Profit: 200 / 500 / 1000 pips
🔴 SELL GOLD
* Entry: 4,397–4,399
* Stop Loss: 4,409
* Take Profit: 200 / 500 / 1000 pips Short 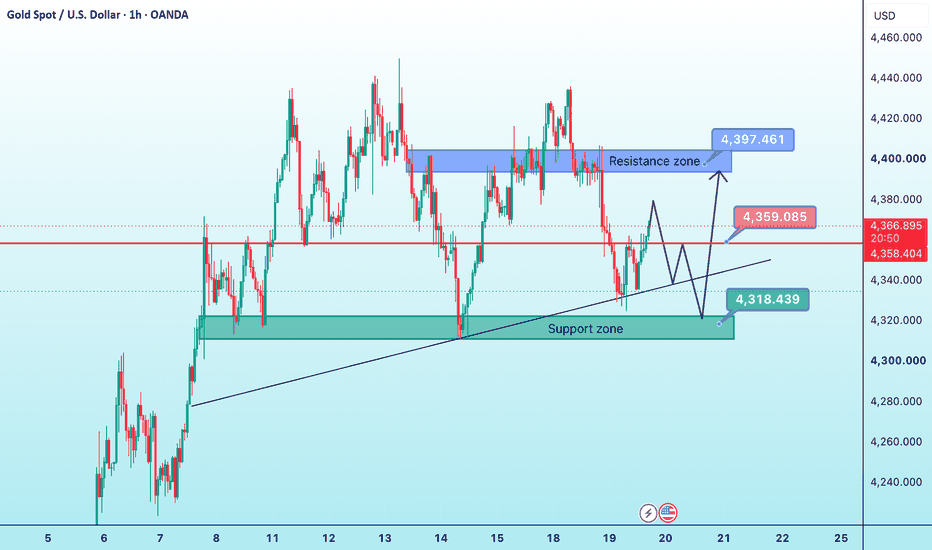
XAUUSD – ABC Rebound Before Bearish RotationGold is holding a short-term recovery structure after bouncing from the 4,320 area, but this move still looks more like an A-B-C rebound than a full bullish reversal. From Kelly’s view, price may continue pushing higher first into resistance, then face renewed selling pressure once the corrective structure is completed.
⟡ Market structure
The chart shows a completed selloff into the 4,320–4,330 region, followed by a rebound forming an A-B-C pattern.
Wave A has already pushed price back above 4,350, while wave B created a shallow pullback. If buyers stay in control in the short term, wave C can extend toward the resistance band around 4,370 first, and possibly into the higher sell zone near 4,392–4,398.
That upper zone is important because it aligns with the projected end of the corrective wave and the 1.618 extension area marked on the chart. If price reaches that zone and loses momentum, the market may rotate lower again.
➤ Key levels
◌ Current price area: 4,360
◌ Near resistance: 4,368–4,372
◌ Main sell zone: 4,392–4,398
◌ Short-term support: 4,345–4,350
◌ Lower downside target: 4,330–4,333
⌁ Trading scenario
Kelly’s preferred path is a bullish push first, with price trying to complete wave C into 4,370 and then 4,392–4,398.
If gold reacts bearishly from that zone, sellers may take control again and drive price back toward 4,345, then deeper into 4,330.
◌ Invalidation
If price breaks cleanly above 4,398 and holds, the bearish follow-up scenario becomes weaker and gold may extend higher.
▸ Do you think gold will complete wave C into the sell zone first, or reject earlier from 4,370? Short 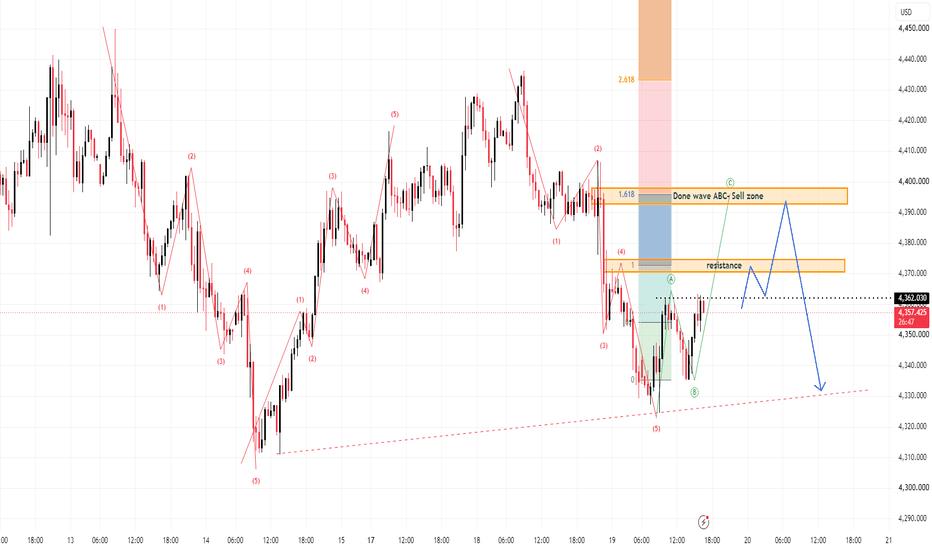
Gold Is Consolidating, Awaiting a Breakout.XAUUSD – H1 | Technical Update
Current Price: ~4,394
* 🔵 Major Resistance: 4,435–4,440 — Strong supply zone where price has reacted multiple times.
* 🔴 Intermediate Level: 4,410 — Short-term resistance; price needs to break and close an H1 candle above this level to open the way toward 4,435–4,440.
* 🟢 Key Support: 4,350–4,362 — Demand zone located near the ascending trendline.
* 📈 Trendline: Still holding, so the H1 bullish structure remains intact.
Scenarios
1️⃣ Bullish – Preferred Scenario
If price pulls back toward 4,350–4,362, holds this zone, and forms a confirmation candle → the expected targets are 4,410 → 4,435–4,440.
2️⃣ Breakout Scenario
If an H1 candle closes above 4,440 → this would confirm a breakout of the recent high and could open the way toward higher price levels.
3️⃣ Bearish Scenario
If an H1 candle closes below 4,350 and breaks the ascending trendline → the short-term structure would weaken. In this case, Buy the Dip would no longer be the preferred strategy, with potential downside toward 4,320–4,300.
👉 Current Bias: Sideways consolidation within the 4,350–4,440 range, with a bullish bias as long as the ascending trendline holds. Avoid FOMO around 4,430–4,440; preferably wait for a pullback toward support or a confirmed breakout.
⸻
TRADING PLAN
🟢 BUY GOLD
* Entry: 4,360–4,362
* Stop Loss: 4,350
* Take Profit: 200 / 500 / 1000 pips
🔴 SELL GOLD
* Entry: 4,438–4,440
* Stop Loss: 4,450
* Take Profit: 200 / 500 / 1000 pips  Long
Long
XAUUSD: Bullish Elliott Wave Targets 4,500Gold is still holding a constructive bullish structure after reacting from the lower support area. From Kelly’s view, the chart suggests that XAUUSD may be preparing for the next bullish Elliott wave, as long as price continues to hold above the current buy zone.
The key idea is simple: gold may still move with short-term corrections, but the main scenario remains bullish while buyers defend the 4,390–4,405 area.
⟡ Market structure
The chart shows gold recovered strongly from the 4,300 area and built a new bullish sequence. After forming a higher low, price pushed back above 4,400 and is now consolidating near the Buy zone.
Current price is around 4,402. This is an important reaction area because it sits close to the short-term support zone and below the nearest breakout level around 4,416.
If gold holds above the Buy zone and breaks 4,416 with strength, the next upside target is the resistance area around 4,435–4,445. A clean breakout above that resistance may open the path towards the Elliott wave completion zone around 4,500–4,510.
➤ Key levels
◌ 4,390–4,405: Buy zone and short-term support
◌ 4,402: current price reaction area
◌ 4,416: bullish confirmation checkpoint
◌ 4,435–4,445: main resistance zone
◌ 4,500–4,510: End Elliott wave / Fibonacci 1.618 target
◌ Below 4,380: area where the bullish setup starts to weaken
⌁ Elliott Wave view
From an Elliott Wave perspective, gold may be forming a bullish 5-wave structure after the previous correction ended near 4,300.
Wave 1 created the first recovery move from the lower base.
Wave 2 corrected but held above the main low.
Wave 3 may develop if price breaks above 4,416 and pushes into 4,435–4,445.
Wave 4 may later form as a controlled pullback near resistance.
Wave 5 may then continue towards 4,500–4,510, where the chart marks the Elliott wave completion zone.
This means Kelly is still watching for bullish continuation, but confirmation is important. The stronger setup is not to chase price randomly, but to wait for the Buy zone to hold and for price to confirm above the nearest resistance.
▸ Trading scenario
Preferred scenario: wait for gold to hold the Buy zone and show bullish confirmation.
Entry zone: 4,390–4,405 if bullish confirmation appears
Stop loss: below the confirmed pullback low or below 4,380
Take profit 1: 4,416
Take profit 2: 4,435–4,445
Take profit 3: 4,500–4,510
Alternative scenario: if gold breaks below 4,380 with strong bearish pressure, the bullish Elliott setup weakens. In that case, price may need to retest the lower support area before building a new bullish structure.
⌁ Kelly’s view
For Kelly, the main structure still favours the bullish scenario. Gold is holding above the buy zone, the recovery structure is improving, and the next Elliott wave may continue if buyers protect support.
The key zone to watch is 4,390–4,405. If this area holds, gold may continue higher towards 4,435 first, then the 4,500 Elliott target.
Gold is building bullish momentum.
If the buy zone holds, wave 5 may extend higher.
Share your view below.
Long 
GOLD - The Hunt for Liquidity Ahead of the Distribution ICMARKETS:XAUUSD maintains its local bullish trend and is entering a consolidation phase, within which a clear trigger is forming. A breakout of this trigger could strengthen the continuation of the upward move
The Dollar Index remains stagnant and is testing support within a downward impulse. Further dollar weakness could become a technical driver for gold upside. The key area to watch is 4,390–4,370.
The correction in gold appears temporary. The fundamental backdrop — including a weaker dollar and expectations of lower Fed rates — continues to support the metal. Key events this week include the FOMC minutes on Wednesday, as well as U.S. housing and industrial production data.
Technically, dip-buying remains the more likely scenario.
Drivers:
Downside: higher oil prices and yields, stronger dollar, geopolitical uncertainty.
Upside: weaker dollar, lower rate expectations, dip-buying
Resistance levels: 4,435, 4,450, 4,500
Support levels: 4,388, 4,371, 4,313
Gold maintains its local bullish trend. The market is confirming resistance at 4,435, but is forming a correction ahead of a potential breakout, with a possible liquidity hunt as the objective.
A bounce from the 4,370–4,388 zone could trigger a breakout above 4,435 and open the way for further upside toward 4,480–4,500
Best regards,
R. Linda Long 
XAUUSD: Bullish Structure Breakout & Demand Zone RetestOn the XAUUSD chart, Gold recently completed a significant structural shift. After a prolonged descending corrective channel, price found solid support around the 4,310 - 4,320 demand region (marked by a Weak Low swing bottom).
Price subsequently broke out of the descending trendline with strong momentum, triggering a Change of Character (CHoCH) followed by a Break of Structure (BOS) to the upside. The background trend tracker has shifted from bearish (pink) to bullish (cyan/green), signaling a trend reversal.
Technical Confluences
Market Structure Break: Breakout above the descending trendline with higher highs and higher lows.
Support Retest: Price is holding above the local structural support and recent Equal Lows (EQL) around 4,371.60.
Indicator Alignment: Both the Adaptive Trend Tracker (ATT) and Smart Money Concepts (SMC) indicators align with a bullish bias following the buy confirmation off the lower boundary.
Trade Parameters & Execution Plan
Bias: Bullish Continuation
Entry Zone: 4,371.00 – 4,376.00 (Local support retest)
Invalidation / Stop Loss: Below local structure at 4,360.00
Target 1 (TP1): 4,400.00 (Equal Highs / Resistance Supply Zone)
Target 2 (TP2): 4,440.00 – 4,450.00 (Major Supply Zone / Strong High)
Risk-to-Reward Ratio (RRR): ~1:2.5
Risk Management Disclaimer
Always wait for lower timeframe candle confirmations (e.g., bullish reaction or micro CHoCH) before entry. Apply proper position sizing to manage risk effectively. Long 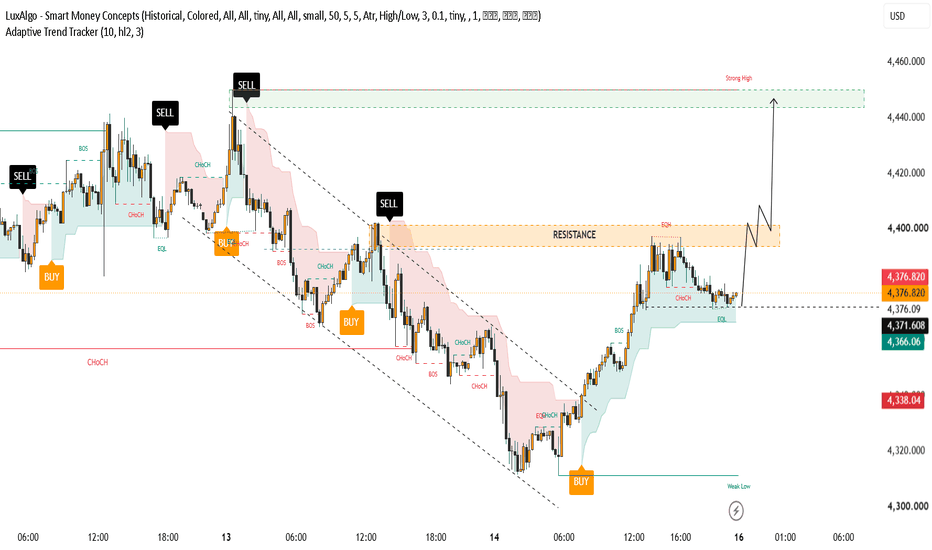
Gold Is Moving Sideways, Consolidating Ahead of a Breakout on AuXAUUSD – H1 | Technical Analysis
Current Price: ~4,400
* 🔵 Major Resistance: 4,430–4,440 — Strong supply zone and the nearest significant high.
* 🟢 Near-term Support: 4,355–4,365 — Key zone that needs to hold to maintain the short-term bullish structure.
* 🟢 Major Support: 4,310–4,320 — Important support zone, located near the ascending trendline.
* 📈 Trendline: The bullish trend remains valid as long as price holds above the ascending trendline and the 4,355–4,365 support zone.
Preferred Scenarios
📈 Bullish: If price pulls back toward 4,355–4,365, holds this zone, and shows a confirmed bullish reaction, price could continue higher toward 4,430–4,440.
📉 Bearish: If price is rejected from 4,430–4,440 and breaks below 4,355, the bullish structure would weaken. If an H1 candle closes below the trendline and 4,310–4,320, the probability of a deeper downside move would increase.
⸻
TRADING PLAN
🟢 BUY GOLD
* Entry: 4,361–4,363
* Stop Loss: 4,351
* Take Profit: 200 / 500 / 1000 pips
🔴 SELL GOLD
* Entry: 4,437–4,439
* Stop Loss: 4,449
* Take Profit: 200 / 500 / 1000 pips Short 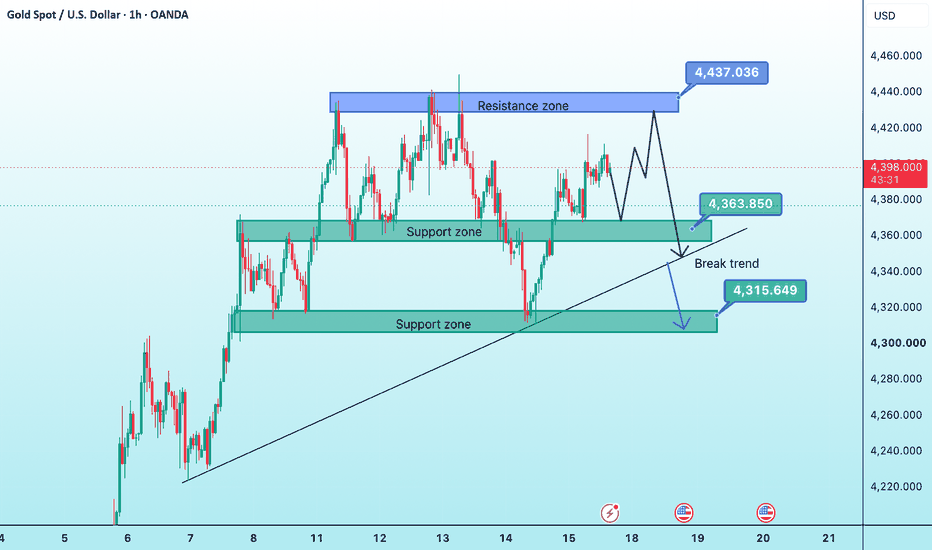
3 Short-term setup after trendline breakoutThis analysis covers three low-risk setups I use after a trendline or channel breakout. Two are bullish entry strategies, and the third is a sell setup used when the breakout fails. All three rely on waiting for confirmation—such as a retest or a fake breakout—to reduce the risk of false signals.
Let me walk you through the three setups I use most often after a trendline or channel breakout. These are designed to reduce risk by waiting for confirmation before entering a trade.
Learn this : The key to low-risk trading is patience . Entering immediately after a breakout often leads to getting stopped out by a fake move. Waiting for a retest or a clear confirmation signal improves the probability of success and gives you a tighter stop-loss.
Setup 1 – Buy on Retest Using Fibonacci (Higher Reward)
After a breakout occurs and price retests the broken level, a short-term pump usually follows. I draw a Fibonacci retracement on that short-term pump and look for entries at the 0.38 or 0.618 retracement levels.
If the market is bullish on the higher timeframe, I use the 0.38 level for entry.
If the market is bearish or ranging on the daily timeframe, I use the 0.618 level for entry.
The stop-loss is placed below the low of the short-term pump. This setup offers a good balance between risk and reward because the entry is at a discount and the stop-loss is clearly defined.
Learn this: The Fibonacci retracement tool is useful for identifying potential pullback levels within a trend. In a strong trend, price often pulls back to the 0.38 level. In a weaker or ranging market, the pullback tends to go deeper to the 0.618 level.
Setup 2 – Buy on Breakout of Previous High (Lower Risk, Lower Reward)
The second setup is also a buy, but it typically offers lower risk and sometimes lower reward. It involves identifying the previous high of the broken channel or trendline. Once price breaks above that high, I enter a long position.
This is a more conservative entry because the breakout above the previous high provides additional confirmation that the trend is continuing. The stop-loss is placed as 40% of gain to reach that high.
Learn this: Trading breakouts of previous highs is a classic trend-following strategy. It is lower risk because the market has already shown strength by clearing a key level. The reward may be smaller if the move is already extended, but the probability of success is often higher.
Setup 3 – Sell When Breakout Fails (Fake Breakout Strategy)
The third setup is used when the breakout fails and price moves back into the channel or below the trendline. In this case, I enter a sell position to capture the downside move. This setup can also help cover losses from any buy positions that were stopped out.
This is a counter-trend trade that takes advantage of false breakouts. It requires quick execution and a tight stop-loss above the failed breakout level.
Learn this: Fake breakouts are common in the market. They occur when price briefly breaks a key level but fails to sustain the move and reverses. These reversals can be sharp, offering a good opportunity for a short trade with a clearly defined risk level.
Final Thought
These three setups give you a complete framework for trading breakouts. They cover both directions and ensure you are always prepared, whether the breakout succeeds or fails. The key to making them work is discipline—waiting for the confirmation signal before entering and sticking to your stop-loss levels.  Education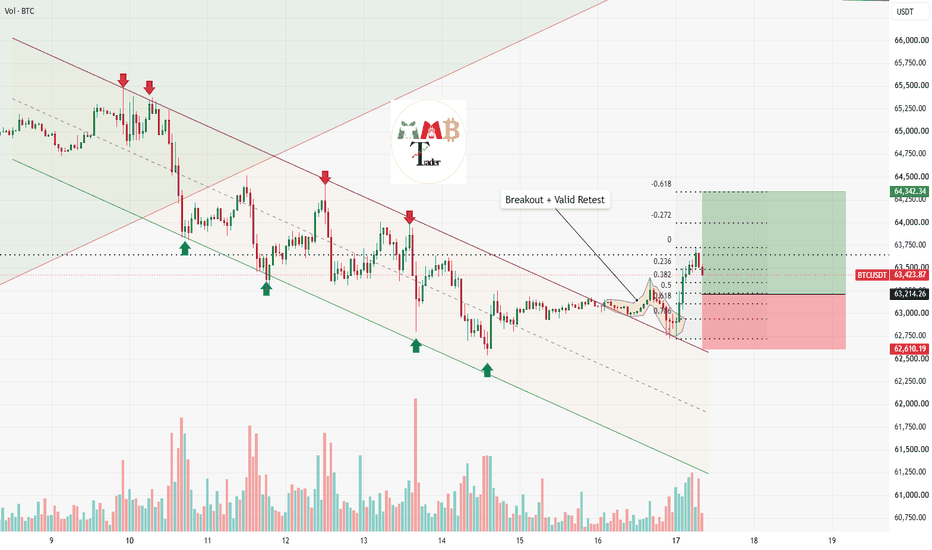
GOLD - The local uptrend continuesFX:XAUUSD is bouncing off the 4,313 support level of the trading range formed within the local bullish trend. The situation remains challenging, but the market still has room for further upside
The dollar remains stagnant but continues to look weak. A decline in the Dollar Index could support further upside and the ongoing local bullish trend in gold.
The fundamental and geopolitical backdrop remains unstable.
Globally, gold remains in a bearish trend.
Locally, the market is in a bullish distribution phase, with a 4,313–4,435 range forming within it.
Gold is currently correcting within the range ahead of a potential move higher.
There are not many major events scheduled for the coming week. Attention will be focused on the FOMC meeting, initial jobless claims, and PMI data
Resistance level: 4,435
Support levels: 4,356, 4,313
A long squeeze around the local 4,356 support zone could shift the balance of power in favor of buyers and trigger a continuation of the local uptrend toward the upper boundary of the trading range
Best regards,
R. Linda Long 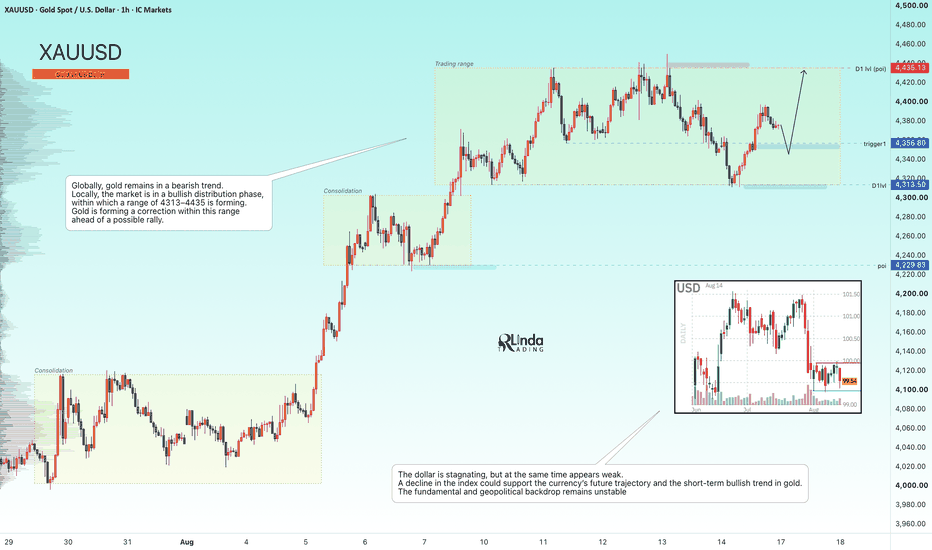
Long 
What will gold’s movement look like in the new week?🔴 Resistance
1. Near Resistance: 4,430 – 4,445
This is a price zone that has been rejected several times during the period of August 11–14.
The current price is around 4,376, so if the price continues to rise, this will be the first key area to watch.
If a Bearish Engulfing / Pin Bar / false breakout appears in this zone, the probability of a correction will increase.
On the other hand, a clear H4 close above 4,445 would open the way for further upside.
2. Strong Resistance: 4,500 – 4,520
This is the largest Resistance Zone on the chart.
It is near the 2.618 Fibonacci Extension level at 4,504.
If price breaks above 4,445, this will become the next upside target.
🟢 Support
1. Near Support: 4,310 – 4,320
This is currently the most important support zone.
It aligns with the previous breakout area and is close to the 1.618 Fibonacci level at 4,309.
The ascending trendline is also approaching this area.
If price corrects into this zone but maintains the bullish structure, this will be the preferred area to look for BUY signals.
2. Strong Support: 4,185 – 4,205
This is a major support zone formed from the previous accumulation/breakout area.
If 4,310–4,320 is strongly broken, price may return to test this zone.
This is also the key area that will determine whether the H4 bullish trend remains intact.
📈 Main Scenario
BUY Scenario:
4,376 → Correction → 4,310–4,320 → Confirmation → BUY
Targets:
TP1: 4,430
TP2: 4,445
TP3: 4,500–4,520
As long as the 4,310–4,320 zone holds, the bullish structure remains very strong.
📉 Correction Scenario
If price fails to break 4,430–4,445 and a reversal signal appears, the following move could occur:
4,430–4,445 → 4,360 → 4,310–4,320
If the H4 candle closes below 4,310, we should avoid forcing BUY positions.
In that case, the next downside correction target will be 4,185–4,205. How Will Gold Perform on the Last Trading Day of the Week?XAUUSD Technical Analysis – H1
Price is currently undergoing a downward correction after being rejected from the 4,380–4,385 zone. The current structure shows that price is retesting the ascending trendline. This area will be crucial in determining whether the bullish trend can continue or whether the correction will extend further.
Key Resistance & Support Levels
🔵 Major Resistance: 4,380–4,385 → Strong supply zone + trendline confluence. A confirmed breakout is required for further upside.
🔵 Near-term Resistance: 4,352–4,362 → Fibonacci 0.618/0.5 zone and an important area that price needs to reclaim to restore bullish momentum.
🟢 Near-term Support: 4,315–4,325 → Breakout zone + ascending trendline.
🟢 Major Support: 4,270–4,280 → Strong demand zone, aligned with Fibonacci 1.618 around 4,272.
Bullish Scenario
If price holds the 4,315–4,325 support zone, reclaims 4,352–4,362, and an H1 candle closes back above this zone, price could move toward 4,380–4,385.
A decisive breakout above 4,385 would open the way toward 4,420–4,440.
Bearish Scenario
If price breaks below 4,315 and an H1 candle closes below this level, the ascending trendline would be invalidated, opening the way toward the next target at 4,270–4,280.
⸻
TRADING PLAN
🟢 BUY GOLD
* Entry: 4,274–4,276
* Stop Loss: 4,264
* Take Profit: 200 / 500 / 1000 pips
🔴 SELL GOLD
* Entry: 4,384–4,386
* Stop Loss: 4,396
* Take Profit: 200 / 500 / 1000 pips


