XAUUSD — 4,337 Retest or 4,274 Sweep?
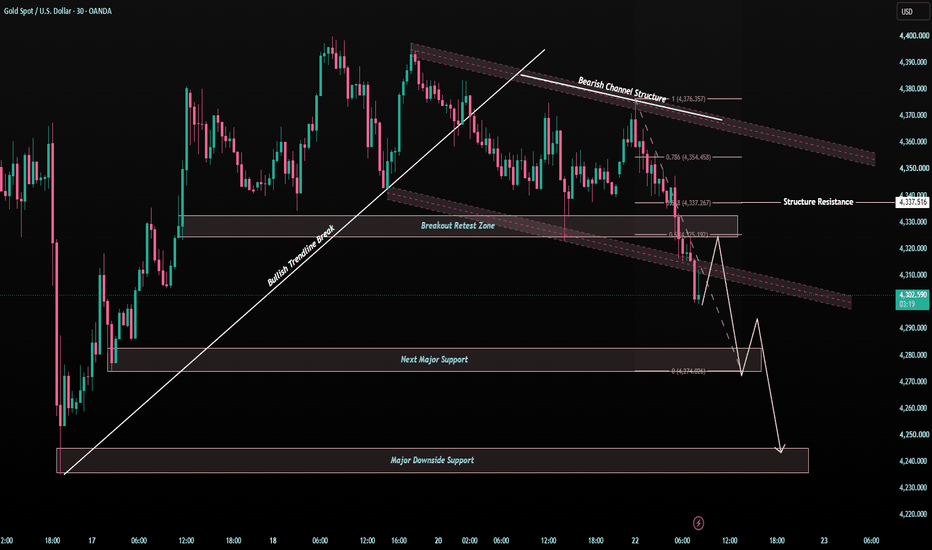
Gold is trading around 4,305 after breaking below the previous M30 support structure.
Price remains inside a bearish channel, with the old breakout area now turning into resistance.
Macro News
Higher-for-longer Fed expectations and a firm U.S. dollar are keeping pressure on Gold. Oil has also rebounded, keeping inflation risk in focus and supporting a cautious short-term outlook.
The simple read
The 4,325–4,337 area is now the key resistance zone.
If Gold retests this area and sellers def
Trend Line Break
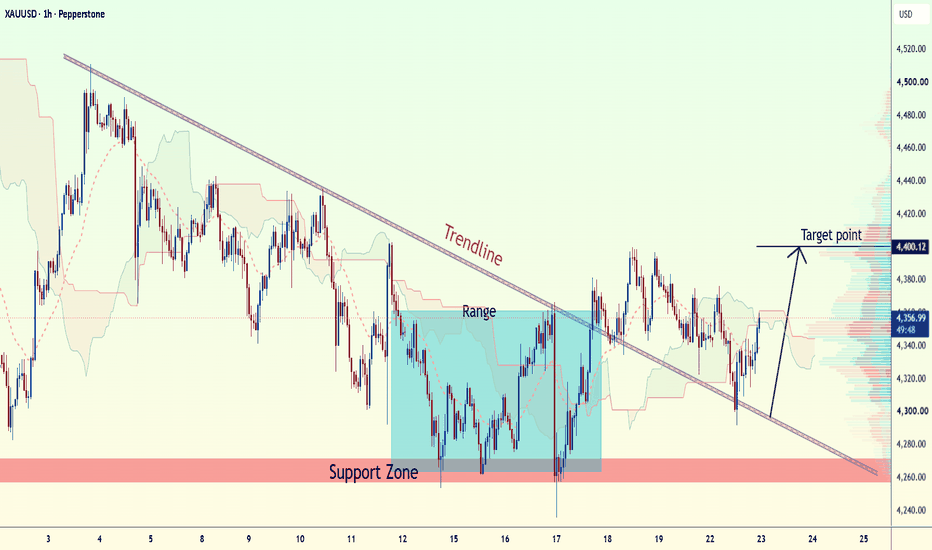
XAUUSD Bullish Breakout – Trendline Resistance RetestGold is showing a potential bullish setup after breaking above the descending trendline and holding the breakout area as support. Price is consolidating above the **4,300–4,320 support region**, while the previous range resistance has been challenged. A sustained move above **4,360** could strengthen the bullish continuation toward the marked target.
🎯 **Target: 4,400**
🛡️ **Key Support: 4,300–4,320**
📌 **Confirmation: Break and hold above 4,360**
This setup remains dependent on price maintain
GBPJPY Bearish Rejection – Resistance to SupportGBPJPY is approaching a strong **resistance zone around 211.50**, where price may face selling pressure. The chart shows a potential rejection from this resistance, with the projected move targeting the rising trendline/support area around **209.58**. A confirmed bearish rejection could open the path toward the target while price remains below the resistance zone.
**🎯 Target:** **209.58**
**🔴 Resistance:** **211.50**
**📌 Key Support:** **209.58**
**Bias:** Bearish below the 211.50 resistance z
BITCOIN - A strong market. Retest of resistance BINANCE:BTCUSDT.P is maintaining its local bullish trend, while the five-week consolidation following the strong rally — during which the coin broke its medium-term bearish trend — points to underlying market strength
After breaking the trend and staging a strong rally, Bitcoin has been consolidating for five weeks. Negative news failed to trigger a decline, while the long squeeze became a technical catalyst for further upside.
The coin continues to confirm its bullish market structure. Th
EURUSD: 4H Major Demand (SUP 78) Meets 1H Falling Wedge BreakoutEURUSD Technical & Order-Flow Analysis | 4H Tactical · 1H Trigger
━━━━━━━━━━━━━━━━━━━━━━━━━━━━━━━━━━━━━━━━━━━━
QUICK SPECIFICATIONS
━━━━━━━━━━━━━━━━━━━━━━━━━━━━━━━━━━━━━━━━━━━━
• Asset: EUR/USD (Spot FX)
• Bias: Tactical Bullish (Long / Mean Reversion)
• Entry Zone: 1.1478 – 1.1485
• Structural Invalidation (SL): 1.14470 (~35 pips)
• Target 1: 1.15000 (+18–20 Pips · First hurdle & BE trigger)
• Target 2: 1.15300 (+48–50 Pips · Tactical intermediate target)
• Target 3: 1.15550 (+72–75 Pips · Fro
XAUUSD-GOLD | 15M | My Key Level This Week Guys, greetings,
Every Monday I share new key levels with you, and these levels remain valid until Friday.
Those who have followed my previous key levels know very well that they worked with pinpoint accuracy.
This week for XAUUSD-GOLD, I’ve set the key zone at 4355 and 4321.
Above 4355 we’ll consider buy trades, below 4321 we’ll consider sell trades.
So, for gold to start an uptrend it must break above 4355, and for selling pressure to be confirmed it must stay below 4321.
Guy
GBP/CHF Idea: Bullish Rebound at Key Demand ZoneTrading Overview
Direction: Long (Buy)
Entry Zone: $1.0990 - 1.1015
Target (TP): 1.10561 (Intermediate) / 1.11000 (Major Resistance)
Invalidation / Stop Loss (SL): Below 1.09000 (Clear break & close)
Technical Analysis
Trendline Confluence:
The price continues to respect a long-term ascending trendline extending from mid-August.
The recent pullback tested both the ascending trendline and horizontal support simultaneously, offering a high-confluence entry area.
Falling Wedge / Bull Flag
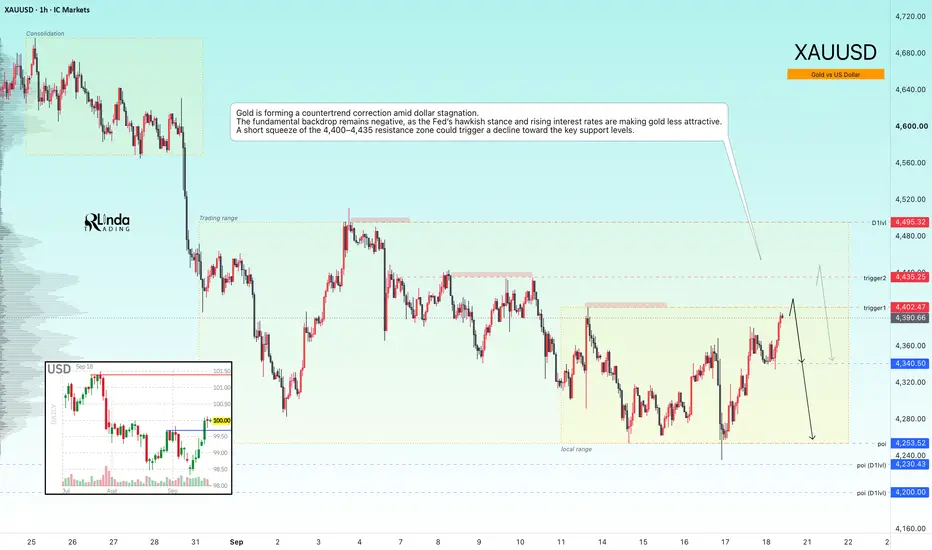
GOLD - The Hunt for Liquidity Ahead of a Decline ICMARKETS:XAUUSD continues to form a countertrend correction, driven by the decline in oil prices. The fundamental backdrop remains weak...
The dollar is stagnating after a strong rally triggered by the Fed’s hawkish stance and rising interest rates. However, the Dollar Index remains strong, which continues to put pressure on gold. At the same time, the decline in oil prices has given the metal some room to recover. The market remains highly dependent on geopolitical developments.
There is
GOLD 4H: Retest of Falling Wedge & Trendline Support for LONGOverview
Technical Analysis
Market Structure & Trend: On the 4-hour timeframe, Gold (XAU/USD) remains in a overall macro bullish structure, defined by a major multi-month Ascending Trendline originating from below $4,000.
Chart Pattern: After reaching peak liquidity near the major overhead Resistance Zone ($4,580 – $4,600), price underwent a corrective pullback. This correction formed a classical Falling Wedge Formation, which recently broke out to the upside.
Key Support Confluence (Bu
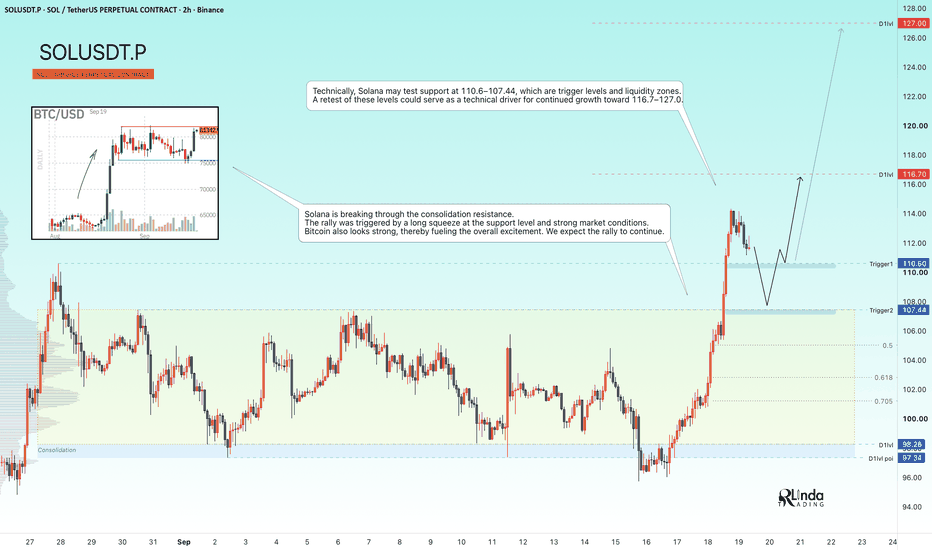
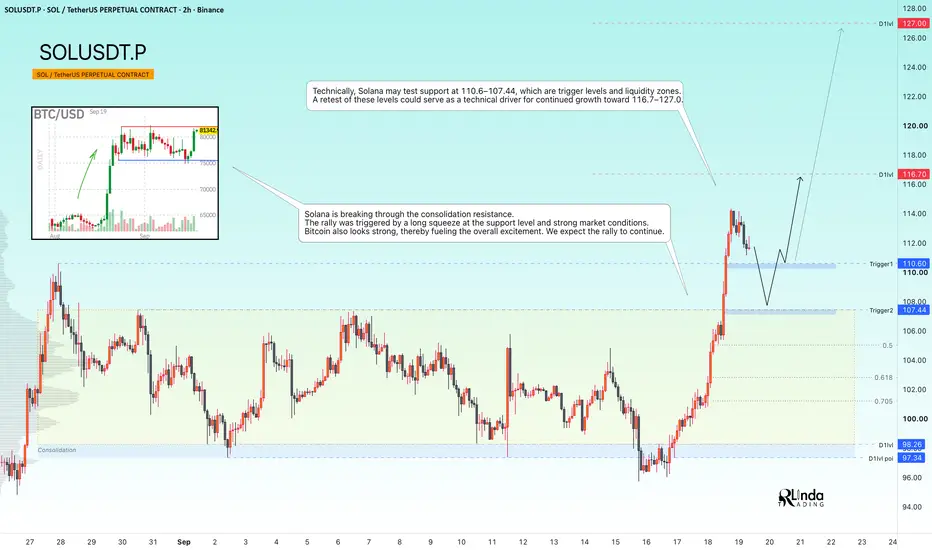
SOLUSDT - A hunt for liquidity ahead of the rally's continuationBINANCE:SOLUSDT confirms its bullish market structure. The long squeeze of support that we expected in the previous analysis played out perfectly. The bulls quickly took control of the situation and strengthened their positions...
Previously, we discussed how the market turned out to be stronger than expected: Bitcoin showed virtually no reaction to higher interest rates, the Fed’s hawkish stance, or the fact that the CLARITY Act was not passed. Consolidation continued, which further confi
BTC/USD: Descending Trendline Breakout targeting $85,000Overview
Bitcoin ( BITSTAMP:BTCUSD ) on the 4-hour chart has broken out above a key descending trendline and reclaimed the major $81,000–$81,500 horizontal resistance zone. Price action is currently consolidating just above the breakout point, setting up two high-probability paths toward the major upside target at $85,000.
Technical Analysis Breakdown
1. Trendline Breakout & Consolidation
Descending Trendline Break: Bitcoin held dynamic resistance along a clear downward trendline throughout
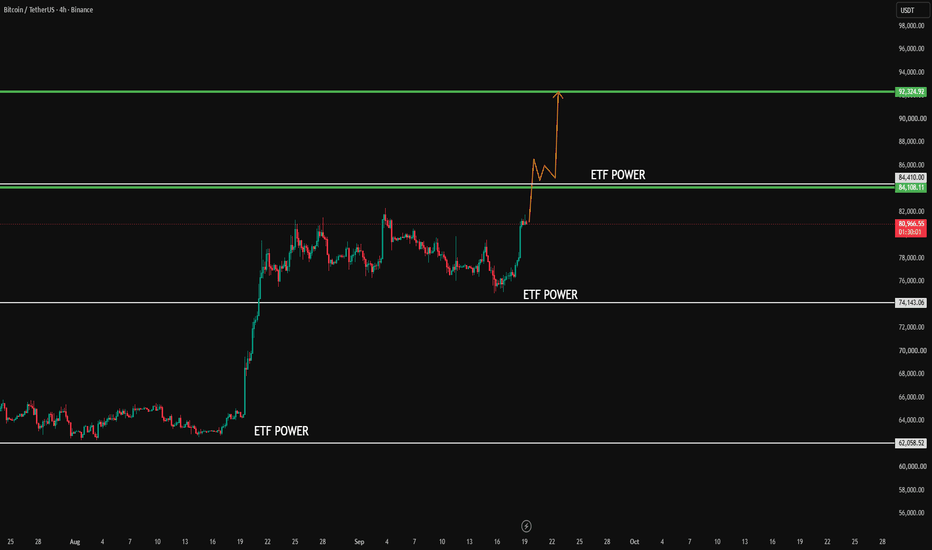
ETF POWER CAN GAIN BTC TO 92K + INTO 2026 BULLRUN ALREADY STARTThe ETF structure is one of the strongest structures Bitcoin can have. Based on the data, we are seeing steady ETF inflows into BTC, step by step. If this trend continues, our next target could be $84K. With strong ETF volume and continued institutional demand, Bitcoin could potentially reach $92K+ in the coming period.
Bitcoin is processing to create the 81K zone as support, which it make it as normally zone and high chance of increase to 84K, after 84K, the space trend is open to 92k+
Afte
XAUUSD — Sell Pressure Below 4,300
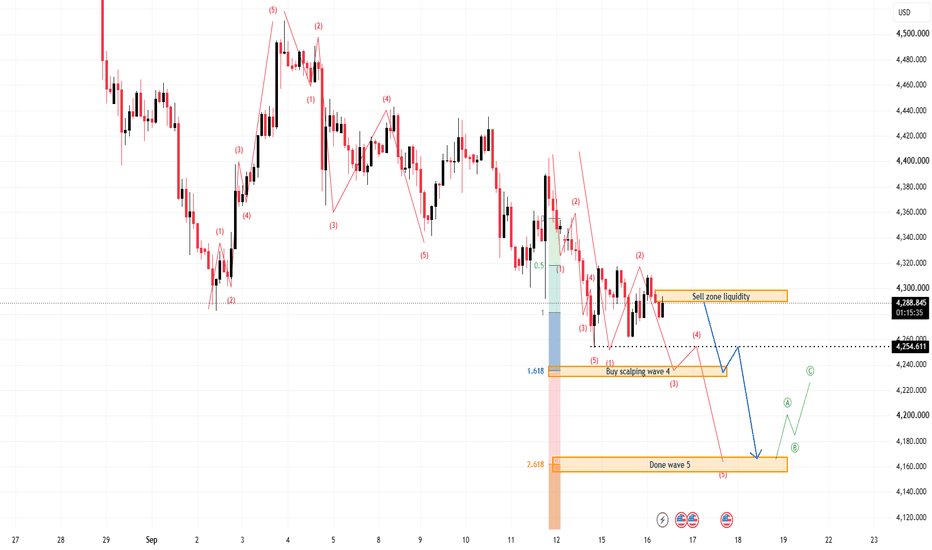
Gold is still trading with a bearish intraday structure after failing to reclaim the upper liquidity zone. From Kelly’s view, the chart suggests that XAUUSD remains under selling pressure, and the current rebound is likely just a temporary pause before price continues lower.
The key idea is simple: as long as gold stays capped below the 4,290–4,300 sell zone, the market may continue rotating down toward the 4,254 support, then extend lower into the 4,235 area and possibly the final wave targe
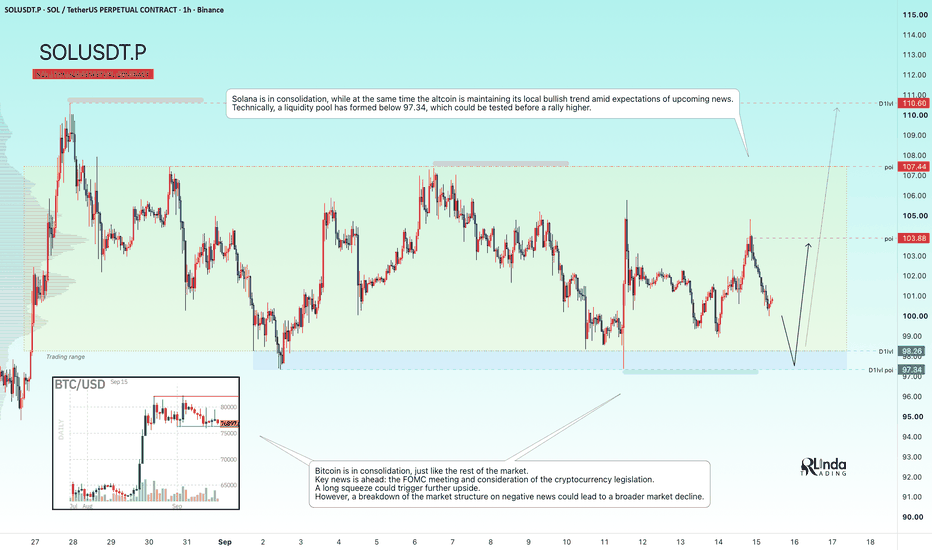
SOLUSDT - The Hunt for Liquidity Before Growth Resumes BINANCE:SOLUSDT.P continues to consolidate, just like the rest of the market. Technically, this is a favorable sign for further upside. However, important news is ahead...
Bitcoin is in consolidation, as is the rest of the market. Key news is ahead: the FOMC meeting and consideration of the cryptocurrency legislation.
Solana is also consolidating, while at the same time maintaining its local bullish trend amid expectations of upcoming news. Technically, a liquidity pool has formed below 97
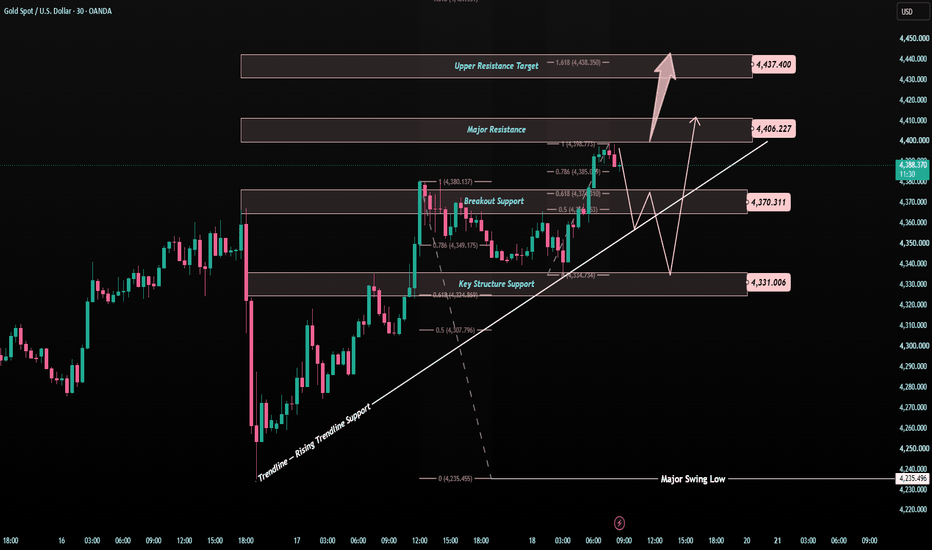
XAUUSD — 4,370 Retest Before 4,406?
Gold is trading around 4,386 after extending the M30 recovery above the rising trendline.
The short-term structure remains constructive, but price is now approaching an important resistance area.
The simple read
4,370 is the key breakout support.
If buyers defend this zone, Gold may continue toward 4,398–4,406.
A clean break above 4,406 could open the way toward the upper resistance around 4,437.
If 4,370 fails, the deeper structure support around 4,331 becomes the next important reaction
GOLD - A countertrend correction aimed at liquidity huntingICMARKETS:XAUUSD has been forming a countertrend correction toward the 4,400–4,430 liquidity zone since the session opened. The fundamental backdrop remains weak, and the market is still in a bearish trend
The dollar is stagnating after breaking through local resistance levels. The Fed’s hawkish stance and rising rates are supporting the Dollar Index, which is putting medium-term pressure on the metals market. However, the correction in oil prices is giving gold some room to recover as it
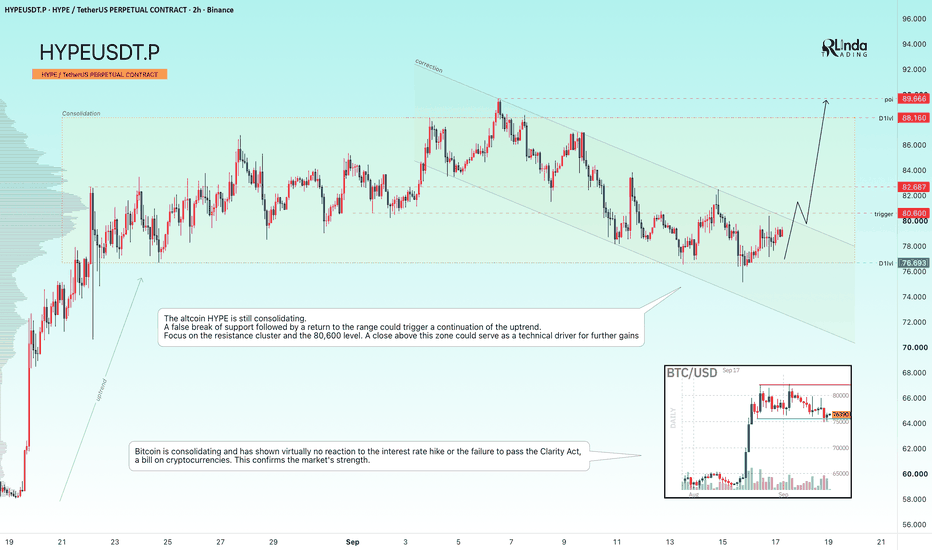
HYPEUSDT - Consolidation in a bull market...BINANCE:HYPEUSDT.P is consolidating within the 76.70–90.0 range. The altcoin is maintaining its bullish trend, while the current range following the strong rally suggests that this coin is stronger than the broader market
Bitcoin remains in consolidation and has shown virtually no reaction to higher interest rates or the failure of the CLARITY Act to pass. This confirms the strength of the market.
HYPE is also still consolidating. A false breakdown of support followed by a return to the ra
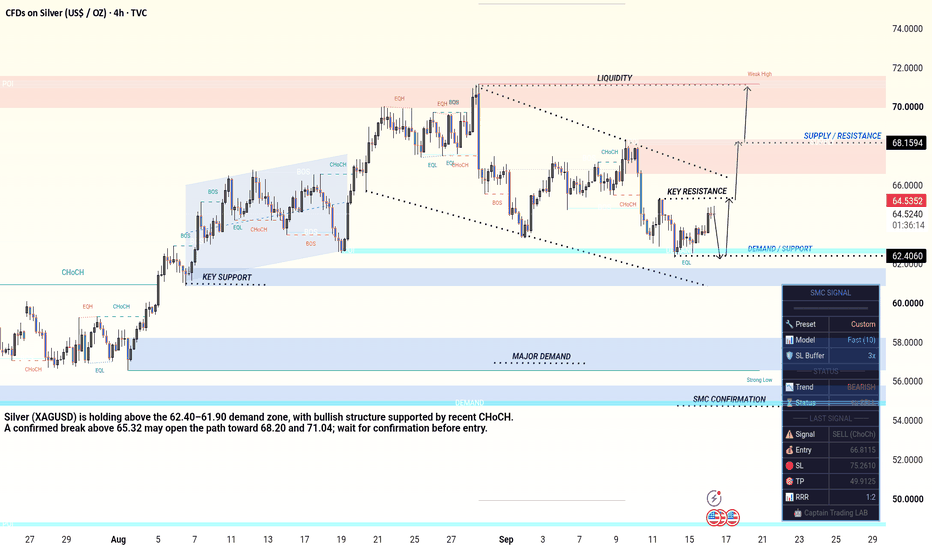
XAGUSD 4H | Demand Zone Reaction & Bullish Continuation SetupXAGUSD 4H — Smart Money Structure & Key Levels
Silver is currently trading around 64.63, with price reacting from the marked demand/support area around 62.40–61.90. The recent structure shows a recovery from the lower demand zone, while the chart is approaching important resistance levels.
Market Structure
Previous price action established multiple BOS and CHoCH formations, showing shifts in market structure.
The recent reaction from the 62.40–61.90 demand zone indicates that buyers are def
XAUUSD — 4,290 Retest Before the Next Push?
Gold is trading around 4,317 after a strong post-Fed recovery.
M30 structure is improving, but price is still sitting inside a near-term decision area.
A bounce is not enough.
The pullback will tell us more.
The simple read
The key zone today is 4,285–4,298.
If buyers defend this pullback area, Gold may recover toward 4,335 first, then challenge the major resistance around 4,357–4,367.
A clean breakout above that zone could open the way toward 4,396–4,399.
If 4,285 fails, the 4,277 OB b
XAUUSD — Bullish Recovery Toward 4,410Gold is showing a bullish recovery after reacting strongly from the lower liquidity area. From Kelly’s view, the chart suggests that XAUUSD may be forming a new upside Elliott Wave structure after breaking out from the lower side of the previous bearish channel.
The key idea is simple: if gold continues to hold above the Buy zone liquidity, the recovery structure can continue toward the next resistance levels.
⟡ Market structure
Gold is currently trading around 4,310–4,318, after bouncing fro
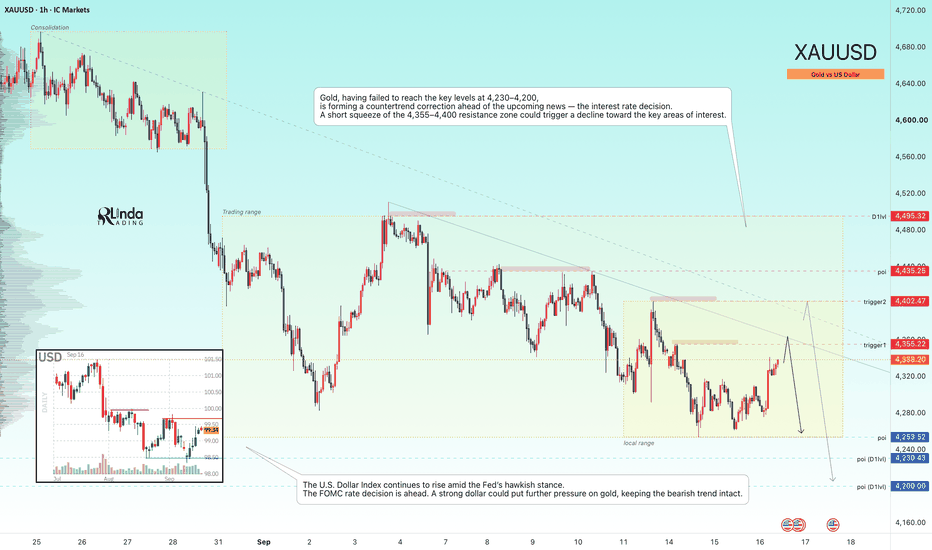
GOLD - A countertrend correction ahead of the news ICMARKETS:XAUUSD is bouncing from support ahead of the news and forming a countertrend correction amid the dollar’s stagnation following a five-day rally. The FOMC meeting and comments from the regulator are ahead...
Technically, most of the hawkish risks have already been priced in, but gold will remain vulnerable if the Fed signals that it intends to keep rates elevated for an extended period. Geopolitical risks and high energy prices are providing support. Gold is caught between expecta
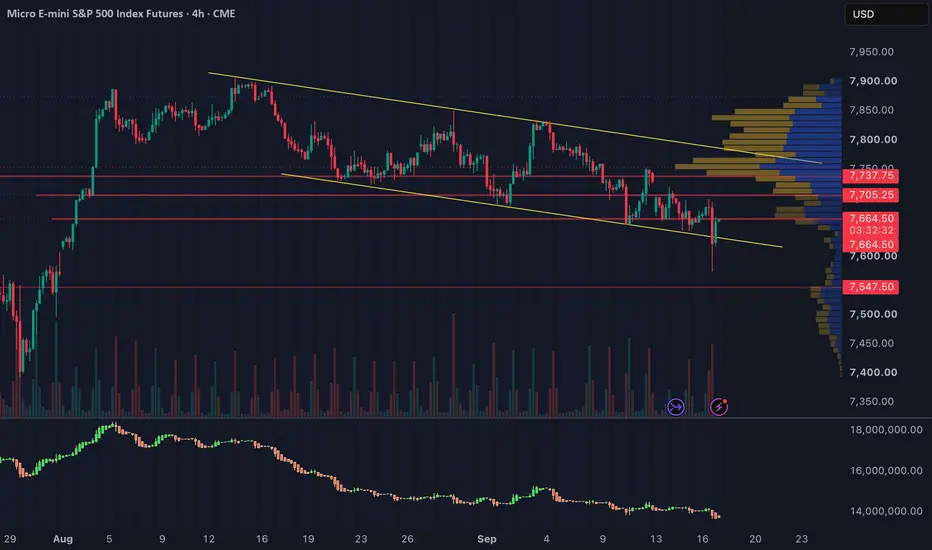
Post-FOMC Repricing Keeps MES in Tactical Risk-Off Post-FOMC Repricing Keeps MES in Tactical Risk-Off — Repair Rally Reaches Its First Test
Market Regime: Tactical Risk-Off / Hawkish Post-FOMC Price Discovery
Systemic Stress: Not confirmed
Confidence: High
Wednesday’s FOMC meeting produced a unanimous 25-basis-point rate increase, lifting the target range to 3.75%–4.00%. Policymakers’ projections also left another increase possible before year-end.
The market’s initial response was a sharp downside repricing followed by a meaningful after-hou
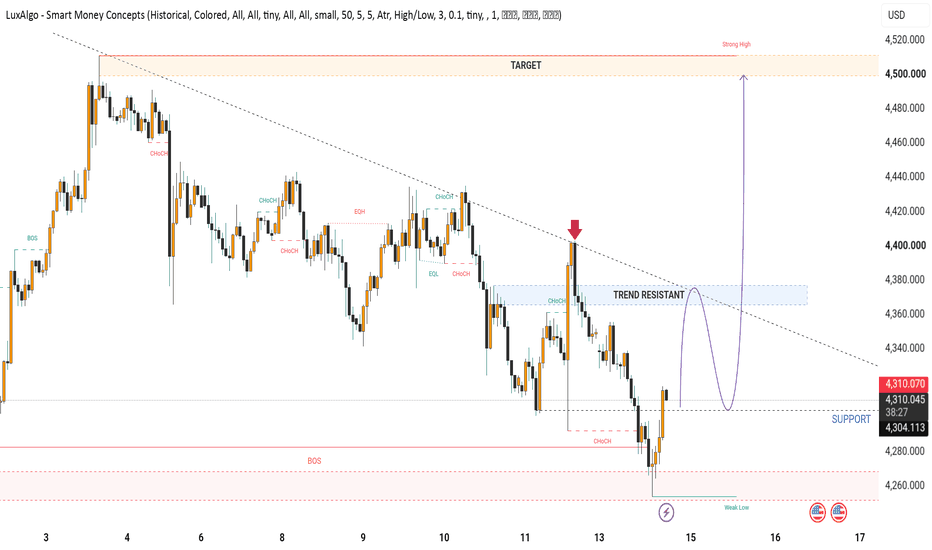
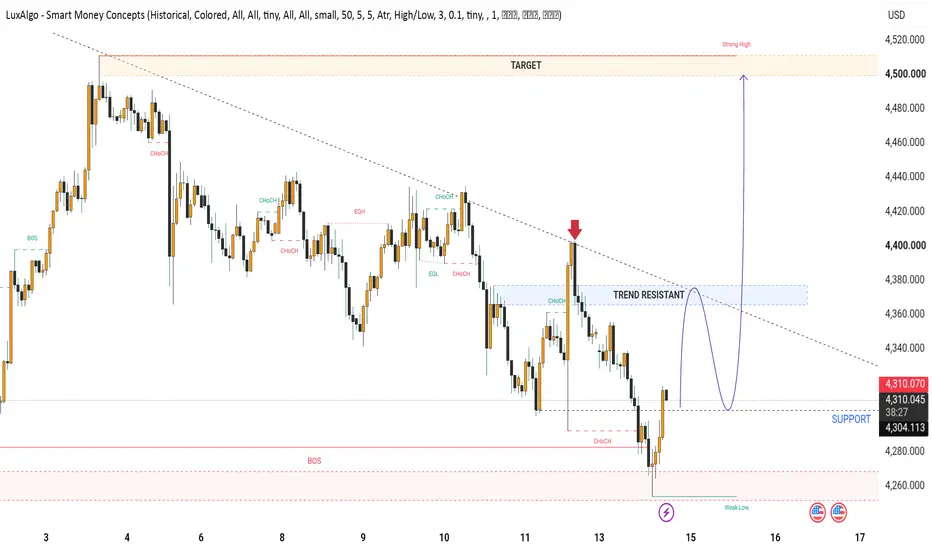
XAUUSD Market Structure Support, Resistance & Breakout Scenario
Gold is currently showing a recovery from the 4250–4275 support area after a strong bearish move. Price has bounced back toward the 4310 region, but the overall structure remains cautious because price is still trading below the descending trendline and the major 4365–4380 resistance zone.
Market Structure
The recent price action shows lower highs and lower lows, indicating that sellers still have control of the broader structure. The latest bounce from the 4250–4275 area suggests that buyers a
Market Concepts · Lesson 18 — Channels, Wedges & TrendlinesLesson 18 - Channels, Wedges and Trendlines: Trading Structured Price Patterns
Difficulty: Intermediate
Not every move happens in random chop. Sometimes price organizes itself into clean geometric patterns — channels, wedges, trendlines — that tell you exactly where reactions are likely. Learning to read these patterns adds a whole layer of structure to your chart.
🔵 TRENDLINES: THE FOUNDATION
A trendline is a diagonal line connecting two or more swing points that move in the same