GOLD - Correction before the fallICMARKETS:XAUUSD continues its plunge: down 8% on Monday, extending its decline of more than 10% from the previous week. Sellers face little resistance as the dollar and oil strengthen amid the escalating conflict in Iran
The dollar dominates as the primary safe-haven asset. Oil continues to rise due to the escalating situation. Gold’s appeal is waning.
The escalation of the conflict heightens risks of energy disruptions and inflation → markets are pricing in rate hikes → yields are rising → gold is under pressure.
If the tit-for-tat continues, a broad market sell-off will begin, and gold will be sold to cover losses on other assets.
Gold is caught in a trap: the geopolitics that should be supporting it are now working against the asset, strengthening the dollar and expectations of rate hikes. As long as the “war for the strait” continues, the dollar and oil remain the main beneficiaries. A rebound is possible only on technical oversold conditions, but the fundamental bearish trend persists
Resistance levels: 4330, 4380
Support levels: 4220, 4163, 4100
A retest of the key zone of interest and a short squeeze could trigger a decline. Locally, gold may consolidate within the 4400–4150 range; however, the technical and fundamental backdrop is bearish, so selling should be prioritized!
Best regards, R. Linda!  Short
Short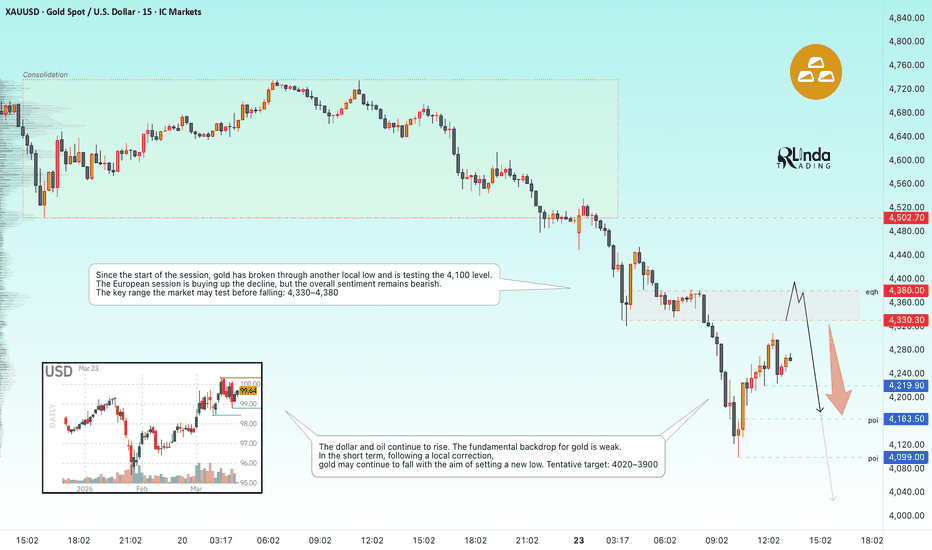
 Short
Short
AUD/USD: Downside opens as triangle support failsAUD/USD has broken out of the symmetrical triangle it had been coiling in over the past two weeks on the H4 timeframe, slicing through uptrend support earlier Monday before retesting and failing at the level again as losses mounted across major Asian equity markets. That saw price break beneath the March 14 swing low of .6980 before extending lower.
.6957 is the next downside level to watch, marking the start of the triangle structure along with the double bottom seen on March 9. Having already moved well away from .6980, I’m not inclined to chase the move at these levels. However, if we were to see a retracement and rejection at .6980, it would provide a decent entry for shorts, allowing for a stop to be placed above for protection, targeting .6957.
The message from the oscillators is consistent with playing the pair from the short side for now. RSI (14) is trending lower but is not yet oversold, while MACD has staged a bearish crossover, confirming downside pressure is building and favouring shorts over longs.
Should .6957 be reached, traders could assess whether to square, flip or hold, looking for a retest of the .6945 low set when the Iran conflict first escalated.
If price were to reverse back above former triangle support and hold there, the bearish bias would be invalidated.
Good luck!
DS  Short
Short
BTCUSDT: Trend Support Retest Could Drive Price Back to 74.5KHello everyone, here is my breakdown of the current BTCUSDT setup.
Market Analysis
BTC broke out of a descending triangle and formed a bullish trend with higher lows along an ascending trend line. Price reached the 74,500 resistance, where a rejection occurred.
Currently, BTC is pulling back toward the 71,300 support zone, which aligns with the rising trend line and previous breakout area, creating a key confluence.
My Scenario & Strategy
As long as price holds above the 71,300 support and respects the ascending trend line, the bullish bias remains valid. A bounce from this area could push BTC back toward the 74,500 resistance zone, which is the main upside target.
However, if price breaks below 71,300, the bullish structure would weaken and could lead to a deeper correction.
That’s the setup I’m tracking. Thank you for your attention, and always manage your risk.  Long
Long
BTC bearish (Updated BTC view)The earlier long thesis is invalid because the daily setup was not equivalent. Those 2 candles were not the same, and after that candle we got an inside bar, which changed the context into compression rather than a direct reversal setup.
On the 4H, we can see the third failed breakout attempt inside the triangle. In the context of a mature broad bull channel, where we are already in a 3rd push phase both up and down, that increases the probability of a trading range or a bearish second leg rather than clean bullish continuation.
On the 15m, the failure becomes clearer in detail: bulls failed twice to take control, then formed a bear flag, and then we got the bear breakout.
So the market has shifted from a “buy support in a broad bull channel” idea to a “respect the failed bullish structure and expect either a trading range or a second leg down” idea.
That opens the door for a measured move lower, with 67.6k and 66.8k as nearer magnets, and 63.5k as the larger downside objective. Short 
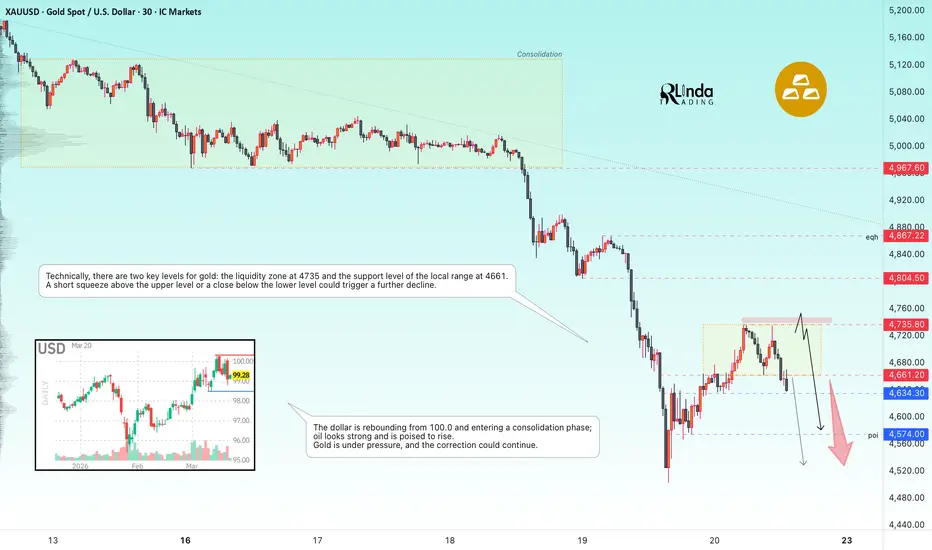
GOLD - The decline may continue ICMARKETS:XAUUSD is correcting after a 7% drop over the week and is testing 4,735, forming a key liquidity zone. The correction is linked to profit-taking and a weaker dollar, but the move may be temporary...
Traders are closing short positions ahead of the weekend and next week’s PMI data. The end-of-week effect is adding volatility.
The escalation of the war (strikes on energy facilities, Iran’s retaliatory strikes) has intensified risk-off sentiment, but gold was sold to cover losses in other markets.
Major central banks have adopted a cautious stance, delaying rate cuts amid the energy shock.
Markets are beginning to rule out expectations of rate cuts this year → negative for gold.
The dollar weakened following central bank decisions (the euro and yen rose), but this did not save gold from a collapse.
Resistance levels: 4661, 4735, 4804
Support levels: 4634, 4574
Technically, there are two key levels for gold: the liquidity zone at 4735 and the local range support at 4661. A short squeeze above the upper level or a close below the lower level could trigger a further decline.
Best regards, R. Linda! Short 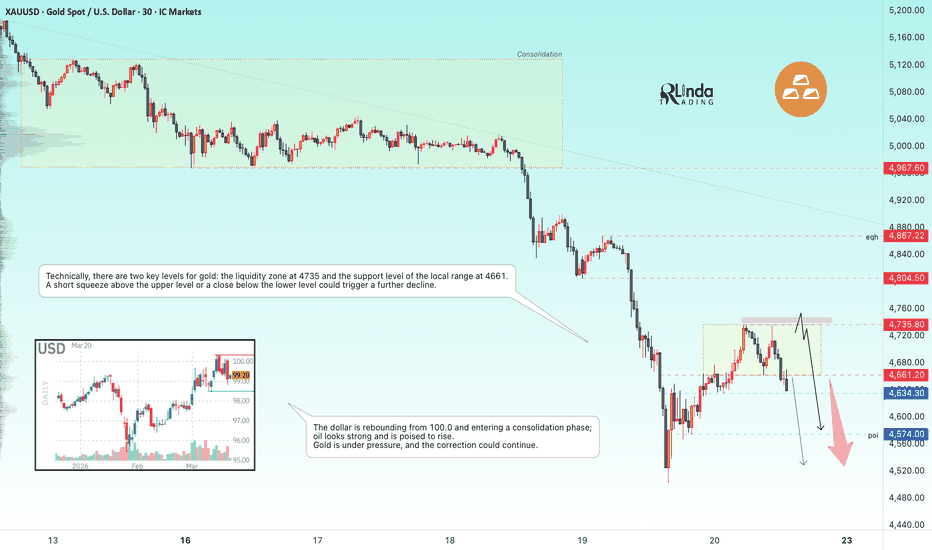
BITCOIN - A hunt for liquidity ahead of a drop to $69000BINANCE:BTCUSDT.P was unable to sustain the previous week’s gains and, following weak economic data, entered a distribution phase from 74,000, testing an intermediate low of 69K. A correction is taking shape...
The global trend is bearish, with pressure on the market coming from weak U.S. indices and the Fed’s hawkish stance. Bitcoin has failed to confirm its status as a safe-haven asset amid the current tense geopolitical situation.
After the sell-off, the price is finding support in the 69,100 zone, confirming the local trend line and forming an additional area of liquidity to which the market may still return
A local rebound and correction toward the 72,400 zone are forming. A short squeeze and bears holding the key zone could trigger a move toward the 69,100 support level.
Resistance levels: 71,750, 72,400
Support levels: 70,220, 69,100
As part of the correction, the price may test the 71,750–72,400 imbalance zone, while a liquidity squeeze and a false breakout could trigger another sell-off and a drop toward the key support level of 69,100
Sincerely, R. Linda! Short 
 Short
Short
 Short
Short
 Short
Short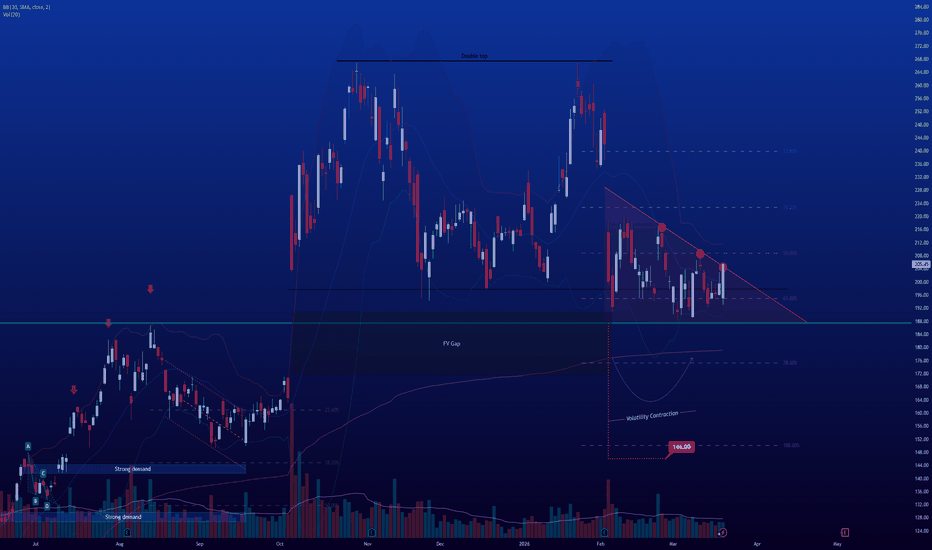
Short 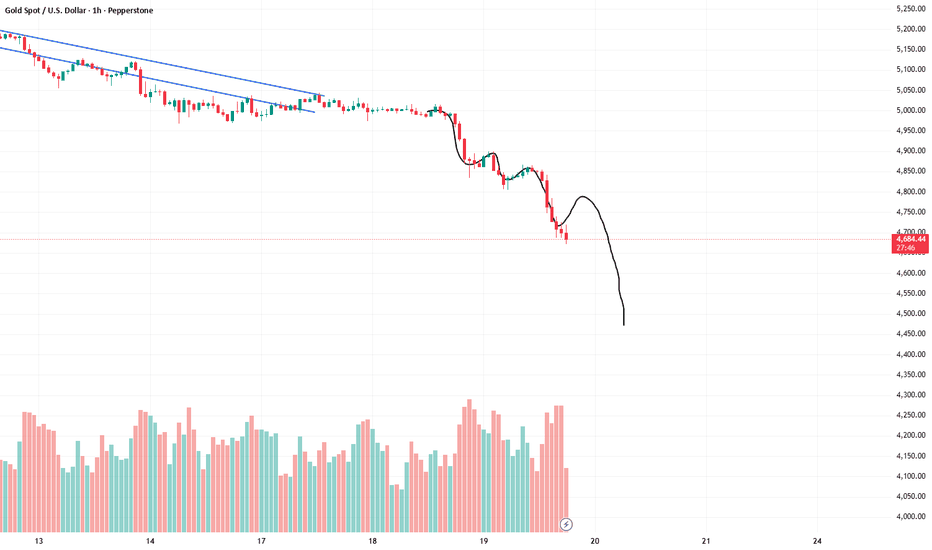
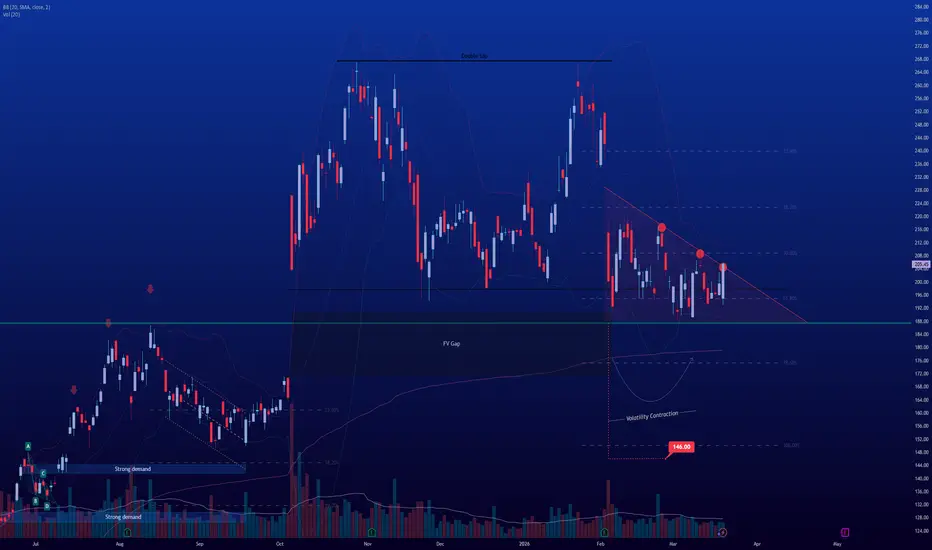
Charter Communications: Potential DowntrendCharter Communications has been sliding for years, and some traders may see further downside risk.
The first pattern on today’s chart is the $244.20 level, the weekly close from Friday, October 24. CHTR fell below that level and rebounded to stall at it last month. That may suggest the cable-and-broadband company faces long-term resistance.
Second, consider the series of lower highs resolving to the downside this month. That descending triangle is a potentially bearish continuation pattern.
Third, the 50- and 100-day simple moving averages are near each other. Prices have dipped back below both. That may suggest a longer-term downtrend remains in effect.
Next, the 8-day exponential moving average (EMA) is under the 21-day EMA. MACD is also falling. Those signals may reflect short-term bearishness.
TradeStation has, for decades, advanced the trading industry, providing access to stocks, options and futures. If you're born to trade, we could be for you. Learn more here about TradingView’s Broker of the Year!
Past performance, whether actual or indicated by historical tests of strategies, is no guarantee of future performance or success. There is a possibility that you may sustain a loss equal to or greater than your entire investment regardless of which asset class you trade (equities, options or futures); therefore, you should not invest or risk money that you cannot afford to lose. Online trading is not suitable for all investors. View the document titled Characteristics and Risks of Standardized Options at www.TradeStation.com . Before trading any asset class, customers must read the relevant risk disclosure statements on www.TradeStation.com . System access and trade placement and execution may be delayed or fail due to market volatility and volume, quote delays, system and software errors, Internet traffic, outages and other factors.
Securities and futures trading is offered to self-directed customers by TradeStation Securities, Inc., a broker-dealer registered with the Securities and Exchange Commission and a futures commission merchant licensed with the Commodity Futures Trading Commission). TradeStation Securities is a member of the Financial Industry Regulatory Authority, the National Futures Association, and a number of exchanges.
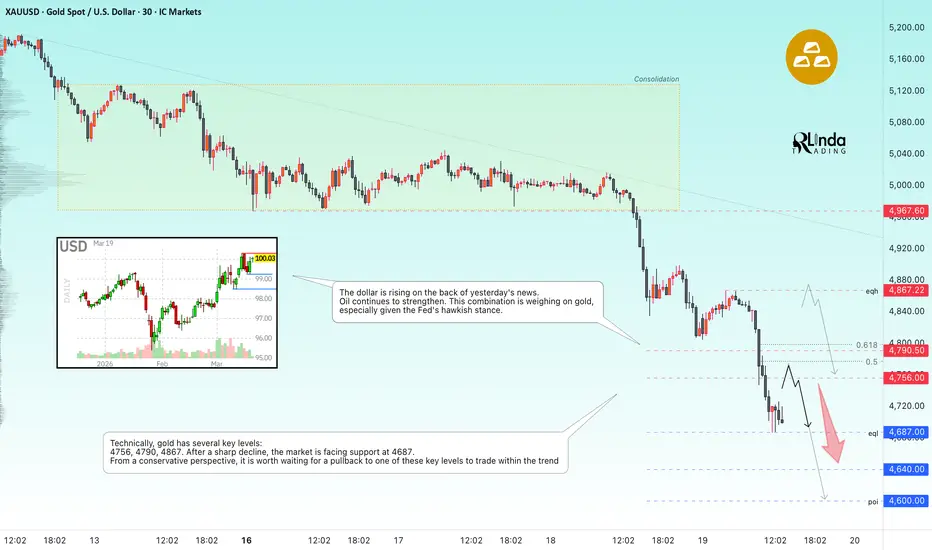
TradeStation Securities, Inc. and TradeStation Technologies, Inc. are each wholly owned subsidiaries of TradeStation Group, Inc., both operating, and providing products and services, under the TradeStation brand and trademark. When applying for, or purchasing, accounts, subscriptions, products and services, it is important that you know which company you will be dealing with. Visit www.TradeStation.com for further important information explaining what this means. GOLD - Correction before the decline ICMARKETS:XAUUSD , currently in a sell-off phase, is testing the intermediate low of 4,685. Triggers include a new escalation of the war in Iran and the Fed’s relatively hawkish stance
The escalation of the conflict in the Middle East is only intensifying; against this backdrop, oil and gold may continue to rise, which will negatively impact the price of the metal.
The Fed kept rates unchanged and confirmed only one cut in 2026.
The dollar remains the primary safe-haven asset, especially if the U.S. strikes Iran’s oil and gas facilities.
Today, the BoJ will announce its rate decision (expected to remain unchanged). Rhetoric regarding inflation could impact USD/JPY and, indirectly, the dollar and gold.
Resistance levels: 4756, 4790, 4867
Support levels: 4867, 4650, 4600
Since the session opened, gold has fallen quite sharply, and trading in the direction of the current trend is quite risky. Technically, the ideal scenario is to wait for a pullback and a retest of key levels before making decisions.
Best regards, R. Linda! Short 
USDJPY - Long squeeze before the trend continues FX:USDJPY is testing the key level of 159.19 as part of a counter-trend correction. A long squeeze could trigger an upward rally.
The dollar is testing its highs and poised to continue its rise following yesterday’s news.
The Fed kept rates unchanged, hinting at maintaining the current rate in the medium term amid high inflation. Against the backdrop of a strong DXY, the Japanese yen may continue to weaken. However, as Japan’s national currency weakens, the risk of intervention by the Bank of Japan is growing.
The currency pair is forming a trading range of 158.6–159.8. The trend is bullish, the dollar is strong, and the probability of the uptrend continuing after the long squeeze is quite high.
If the bulls hold the 159.2–159.0 area, the price will have strong support for an upward move.
Resistance levels: 159.75, 159.85
Support levels: 159.19, 159. 0
A long squeeze (false support breakout) and consolidation above 159.19 could support further growth
Sincerely, R. Linda! GOLD - Consolidation amid a downtrend. Waiting for Powell...ICMARKETS:XAUUSD is hovering around the psychological $5,000 level, forming a trading range with narrowing boundaries, as the market awaits a key event—the Fed’s rate decision and signals regarding its future policy direction.
The war in Iran continues to support oil prices, fueling inflationary expectations.
Markets are pricing in a “hawkish” Fed scenario, which is negative for gold.
The dollar is pulling back from 10-month highs on profit-taking ahead of the Fed meeting, though this is largely a technical narrative—a false breakout of the psychological 100.0 level.
Today, the Fed will announce its rate decision (expected to remain unchanged at 3.50–3.75%). However, the focus will be on Powell’s remarks.
PPI (Producer Price Index) data will be released ahead of the Fed meeting, but the reaction may be temporary.
Technically, the market is weak and in a downtrend; the fundamental backdrop is not favorable for gold, though no one has ruled out force majeure events...
Resistance levels: 5015, 5036, 5055
Support levels: 4967, 4909
Technically, consolidation is forming within the downtrend to build momentum for the continuation of the main trend. A break and close below 4967 could trigger a further decline to 4900–4850. However, there is an area of interest at 5015 on the chart, which the market may test before falling. A short squeeze could activate the trigger...
Sincerely, R. Linda! Short 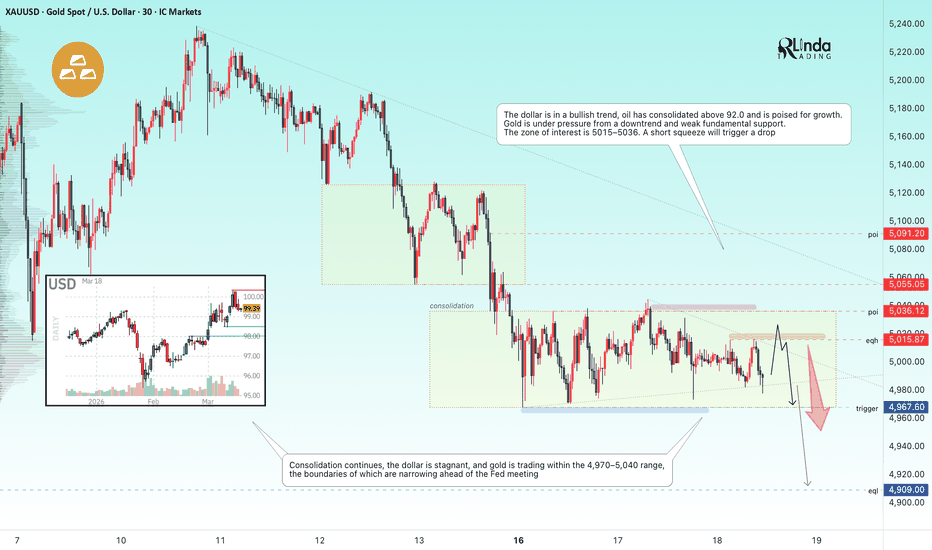
 Long
Long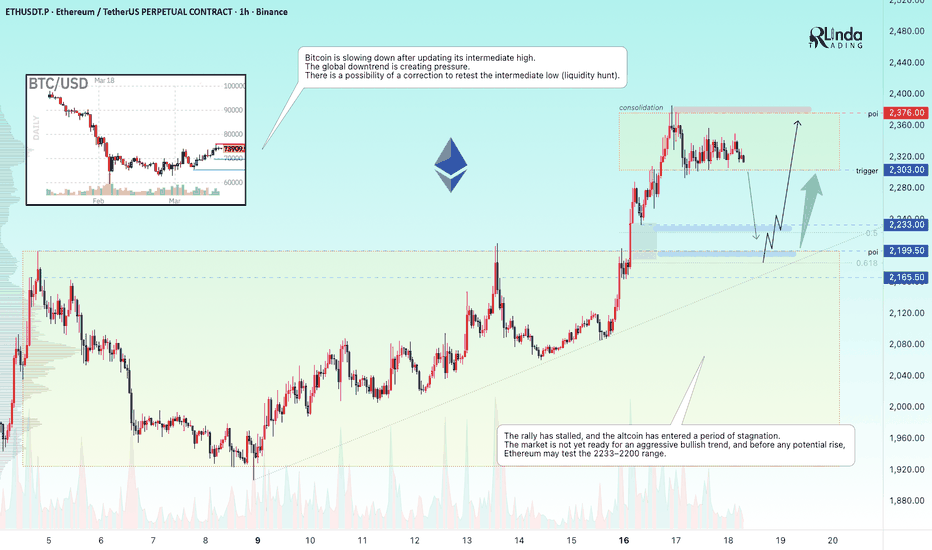
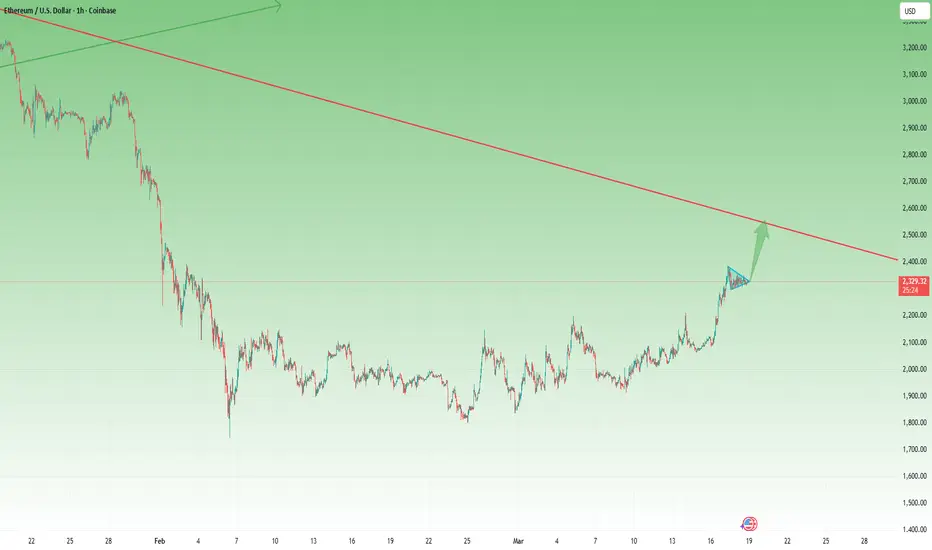
Eth- Another push to 2500?In my previous Ethereum analysis, I mentioned that the 1800 zone had a high probability of acting as a temporary low, with good chances for an upside reversal.
So far, the market has behaved in line with that expectation.
ETHUSD reacted well from that area and moved higher, and since my entry, the position is currently up around 15%, confirming that buyers were indeed willing to step in at those levels.
A Reversal… But Not the Bottom
That being said, it is important to separate a tradable reversal from a long-term bottom.
In my view, this move does not represent the end of the broader bear market. Rather, it appears to be a corrective phase within a larger structure, which is something we often see after extended declines.
And this naturally leads to the key question:
Does Ethereum still have room for another push higher?
Reading the Current Structure
Looking at the recent price action, the structure remains constructive in the short term.
Ethereum has been holding its gains relatively well, without giving back much of the move. This kind of behavior often suggests that the market is not rushing to exit positions, but rather building pressure for continuation.
More importantly, the recent consolidation near the local highs appears to be forming a pennant-type structure, which is typically considered a continuation pattern.
This suggests that the market may simply be pausing before attempting another move higher.
What Could Come Next
If this structure continues to develop and eventually resolves to the upside, Ethereum could see another leg higher, extending the current corrective move.
From a technical perspective, the 2500 zone becomes the next logical area of interest. A move toward that level would represent a more complete upside correction, following the initial rebound from 1800.
The Bigger Context
However, it is important to remain grounded in the broader context.
Even if Ethereum pushes higher from here, this should still be viewed as a correction within a larger bearish environment, rather than the start of a new long-term bullish cycle.
This distinction is essential for managing expectations and risk.
Conclusion
Ethereum has delivered a solid bounce from the 1800 zone, validating the idea of a short-term reversal and providing a strong move for those positioned early.
At the same time:
- The broader market structure still suggests a corrective phase
- The current consolidation resembles a continuation pattern (pennant)
- There is still potential for another push higher toward 2500
For now, the structure allows for further upside — but within the context of a market that may not yet have formed its final bottom. 🚀
Long 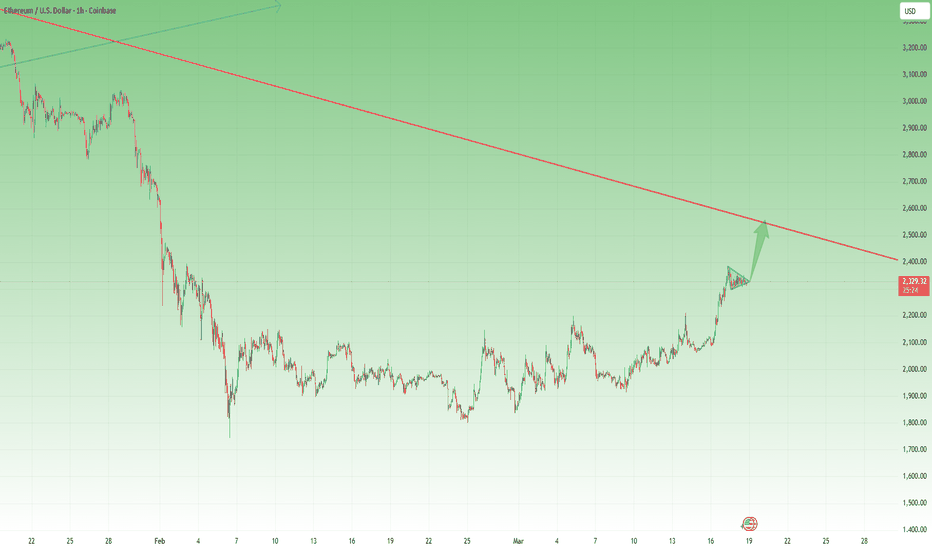
Short 
 Short
Short