Long
Long
 Long
Long
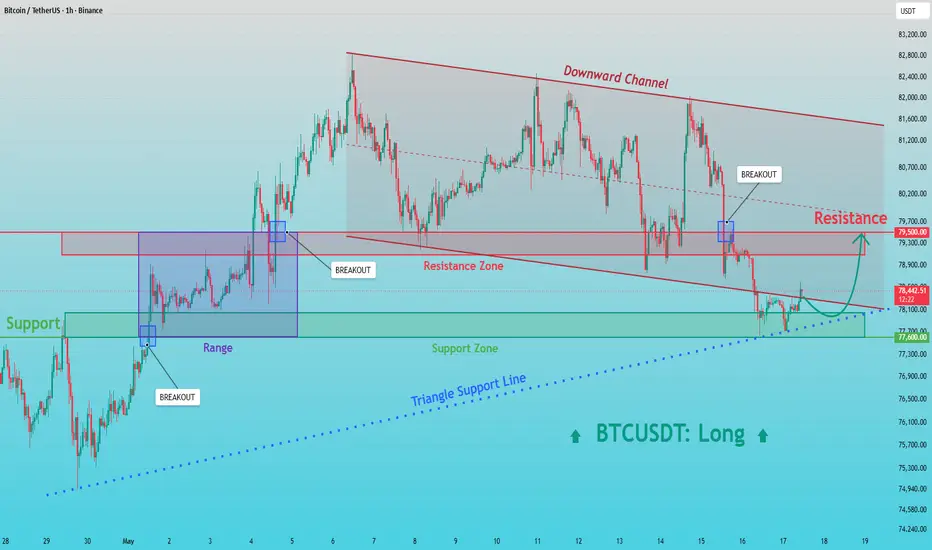
BTCUSDT: Price Holds Above 77,600 While Buyers Regain ControlHello everyone, here is my breakdown of the current BTCUSDT setup.
Market Analysis
Bitcoin previously traded inside a descending channel, confirming short-term bearish pressure. After several failed attempts to break above the resistance zone, price declined toward the lower boundary of the structure and formed a rising triangle support line near the 77,600 buyer zone.
Currently, BTCUSDT is trading above the 77,600 support zone while remaining below the 79,500 resistance level. Price recently rebounded from the triangle support structure and is attempting to recover after a strong bearish impulse, signaling that buyers are becoming active near the lower boundary of the pattern.
My Scenario & Strategy
As long as BTCUSDT remains above the 77,600 support zone and continues to respect the ascending triangle support line, the bullish recovery scenario remains valid. A continuation higher could push price toward the 79,500 resistance zone (TP1).
However, if price breaks below the 77,600 support level and loses the triangle support structure, the bullish outlook would be invalidated, opening the path for a deeper bearish continuation.
That’s the setup I’m tracking. Thank you for your attention, and always manage your risk.  Long
Long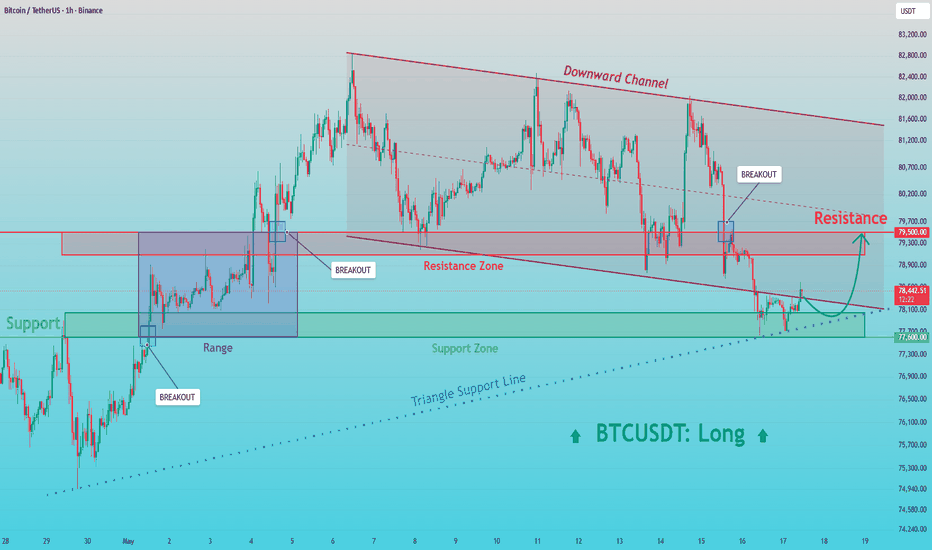
GOLD - Bear market. Trigger at 4,510 ICMARKETS:XAUUSD is under pressure again. The market is bearish. A false breakout of the trend resistance triggered a 3% drop on Friday; it will test key support. Friday’s session is closing on a weak note for the market...
The dollar has entered a bullish range. Momentum remains intact. The market is pricing in interest rate hikes; a new batch of “hot” economic data could support the index’s growth. The nearest catalysts are the release of the minutes from the Fed’s May meeting on May 20 and PCE data on May 28. Escalating geopolitical tensions will push the dollar even higher, intensifying pressure on gold.
Technically, gold is under pressure. The market is testing 4510; a close below this support level will open a new range of 450–4400 (4350). A close below 4510 could become a technical driver for the continuation of the decline
Resistance levels: 4588, 4607, 4646
Support levels: 4510, 4400, 4350
From the opening of the session, the market may form a local pullback aimed at liquidity hunting. As part of the correction, gold may test the resistance zone of 4588–4607 or the upper boundary of the range at 4646 before continuing its decline. A breakdown, close, and consolidation below 4510 could trigger a continuation of the decline.
Best Regards, R. Linda!  Short
Short
 Short
Short
Best Price Action Pattern For GOLD Trend Following Trading
This bullish pattern is very powerful .
Being spotted on a daily/4h/1h, any time frame, it will help you to accurately predict a strong bullish movement on Gold.
In this article, I will teach you to identify a buying volumes accumulation on Gold chart and as a bonus, I will show you how I predicted a bullish rally with this price action pattern.
The initial point of this pattern will be a completion point of a strong bullish impulse.
At some moment, the price finds a strong horizontal resistance, stops growing and retraces .
The second point of the pattern will be a completion of a retracement.
It should strictly be a higher low - it should be higher than the low of an initial bullish impulse.
After a retracement, the price should return to a horizontal resistance and set an equal high, that will be the third point of the pattern.
Then, the price should retrace AT LEAST one more time from a horizontal resistance and set a new higher low.
After that, the price should set one more equal high.
3 equal highs and 2 higher lows will compose a bullish accumulation pattern.
Please, note, that the price may easily set more equal highs and more consequent new higher lows and keep the pattern valid.
Above is the example of a bullish accumulation pattern on Gold on an hourly time frame. The price set 3 equal highs and 3 consequent higher lows.
This pattern will signify the weakness of sellers and the accumulation of buying volumes.
The point is that each consequent bearish price movement from a resistance is weaker than a previous one. It means that fewer sellers are selling from the resistance and more buyers start buying, not letting sellers go lower.
In our example, we can clearly see the consequent weakening, bearish price movements.
This pattern indicates a highly probable breakout attempt of the resistance. A candle close above that provides a strong bullish signal.
The broken resistance will turn into support and will provide a safe point to buy the market from.
In our example, the market broke the underlined horizontal resistance and closed above that. It indicates the completion of a bullish accumulation and a highly probable bullish trend continuation.
You can see that Gold retested a broken structure and then a strong bullish wave initiated.
In a strong bullish market that we currently contemplation on Gold, this bullish pattern will provide a lot of profitable trading opportunities.
No matter whether you are scalping, day trading or swing trading Gold, this bullish accumulation pattern will help you to predict long-term, mid-term and short-term bullish movements.
❤️Please, support my work with like, thank you!❤️
I am part of Trade Nation's Influencer program and receive a monthly fee for using their TradingView charts in my analysis. Education 
The Illusion of Funded Capital: Anatomy of the Prop FIrm modelThe exponential growth of retail proprietary trading firms (*prop firms*) has fundamentally altered how retail traders perceive access to market capital. The initial premise is highly appealing: pay a nominal, upfront evaluation fee to secure an operational loss limit (*drawdown*) that is 10 to 20 times greater than the initial outlay. From a strict personal risk management perspective, this setup appears to be an optimal asymmetric bet.
However, a structural, financial, and operational analysis of this business model reveals an architecture identical to that of the commercial gambling industry.
---
## 1. Statistical Asymmetry and the True Source of Revenue
Retail prop firms operate under an actuarial model highly similar to insurance companies or casinos: their financial viability depends entirely on the failure rate of the participants.
* **The Real Success Rate:** Audited data derived from regulatory liquidations and legal proceedings (such as the CFTC cases against major industry players) demonstrate that **fewer than 1% of applicants (approximately 0.7%) ever reach their first payout**.
* **Monetizing Failure:** The primary revenue stream for these entities does not originate from net capital gains generated in the live market. Instead, it is fueled almost exclusively by the application and evaluation fees (*challenge fees*) paid by unsuccessful traders.
---
## 2. The Simulation Model (B-Book) and Structural Conflict of Interest
The vast majority of retail prop firms do not route or replicate their traders' orders into the actual interbank market or live exchanges. They operate within a pure simulation environment (*B-Book*).
* **Absence of Hedging:** Because there is no real-market hedging (*live replication*) of the positions, payouts distributed to profitable traders are financed directly out of the cash flow generated by the challenge fees of losing traders.
* **The Zero-Sum Incentive:** This creates a structural conflict of interest. To the firm, a consistently profitable trader is a pure financial liability, not an asset. The firm’s net profit increases when the user breaches their account rules and forfeits their balance.
---
## 3. Operational Friction and Technical Asymmetry
To accelerate the failure rate of traders who demonstrate statistical consistency, the simulated environment is frequently manipulated via algorithmic friction. These tools alter price execution and risk parameters to ensure the house edge is maintained.
* **Artificial Slippage and Spread Widening:** Unlike a regulated broker connected to Tier-1 liquidity providers, prop firms control the proprietary data feed. Artificial slippage (price degradation) and the sudden, discretionary widening of spreads during high-volatility events are deployed to trigger stop-loss orders that would remain untouched in an efficient, live market.
* **Induced Latency and Simulated Outages:** Brief, engineered server disconnections during critical macroeconomic releases or market opens prevent active trade management, forcing the trader to maintain involuntary risk exposure.
* **The Mathematics of the Trailing Drawdown on Equity:** This is the most aggressive statistical optimization tool in the industry. While traditional drawdown is calculated based on the closed balance of the previous day, a trailing drawdown on equity tracks the highest peak of unrealized profits (*floating equity*).
> **Example of Trailing Equity Drawdown:** If a $100,000 account opens a position that floats to +$5,000 but subsequently retraces and is closed at breakeven ($0), the maximum loss limit of the account permanently locks onto that $5,000 floating peak. The trader has lost $5,000 of their allowable drawdown space without realizing a single dollar of actual financial loss. This drastically narrows the operational margin, mathematically guaranteeing an increased probability of account termination.
* **Asymmetric and Inflated Swap Fees:** For swing traders holding positions overnight, firms frequently apply artificially inflated or multidirectional financing costs (*swaps*). This erodes the mathematical expectancy of medium-to-long-term strategies, turning winning setups into net losses purely through maintenance costs.
---
## 4. Administrative Suffocation of Profitable Operators
When technical hurdles fail to eliminate an advantage player, the firm transitions from automated friction to unilateral administrative intervention.
* **Discretionary Risk Restrictions:** Once a trader demonstrates a persistent payout history, the firm often modifies account parameters unilaterally—such as restricting the maximum risk per trade to a marginal threshold (e.g., 1%) or slashing available leverage. This effectively neutralizes the trader's edge.
* **Deliberate Payout Delays:** The withdrawal process is frequently subjected to prolonged, unjustified compliance audits. The objective is psychological: inducing fatigue and encouraging the trader to continue operating the account under psychological stress while waiting for funds, significantly increasing the likelihood of an unforced error.
* **Exploitation of Metadata (IP and VPN Bans):** Lacking valid technical grounds to ban a profitable operator, compliance departments often weaponize IP logs or Virtual Private Network (VPN) usage. The trader is formally accused of "account sharing," "suspicious access," or "IP latency arbitrage"—serving as a standard administrative pretext to deny payouts and confiscate accumulated earnings without recourse.
---
## 5. The Gambling Taboo and the "Right of Admission"
Within the financial retail community, there is a profound taboo surrounding the word *gambling*. Most market participants prefer to view trading as a purely academic, analytical endeavor. However, in terms of probability theory, professional trading is the exact functional equivalent of professional advantage play (such as card counting in blackjack or quantitative sports betting). It is the exploitation of a positive expected value ( SEED_ALEXDRAYM_SHORTINTEREST1:EV > 0$) through strict capital allocation.
In a commercial casino, any player who demonstrates a persistent mathematical advantage is banned via the "right of admission." The retail prop firm industry executes the exact same defensive mechanism:
* **Ambiguous Terms of Service (T&C):** Operating as technology service providers rather than regulated investment firms, their legal contracts contain intentionally vague clauses prohibiting "aggressive strategies," "toxic trading style," or "exploitative patterns."
* **Unregulated Environment:** Because these firms operate outside the jurisdiction of major financial regulators (such as the SEC, CFTC, or ESMA), consumers lack institutional protection. This regulatory void is precisely why major jurisdictions have increasingly restricted or banned these entities from soliciting citizens within their borders.
* **Reputation Management and PR Networks:** To counter legitimate exposure, the industry allocates millions of dollars toward affiliate marketing and reputation control on platforms like Reddit and Discord. They utilize network nodes and sockpuppet accounts to systematically discredit the testimonies of traders whose accounts were wrongfully terminated.
---
## Conclusion
The modern retail prop firm ecosystem must be approached with the exact same mathematical skepticism one would bring to a high-limit blackjack table. While it is entirely possible for a disciplined operator to extract short-term capital from these entities, it must be done under the absolute realization that the system is structurally, technically, and legally rigged to ensure the house wins over a sufficient sample size.
When an entity offers to absorb virtually all your financial risk for a small entry fee, the structural risk has not disappeared; it has simply been transformed into counterparty risk.
*This post was fully authored by me and enhanced with AI. Education 
XAUUSD: Triangle Breakout Could Trigger Rally to 4,800$Hello everyone, here is my breakdown of the current XAUUSD setup.
Market Analysis
Gold previously traded inside an upward channel, confirming strong bullish momentum. After breaking above the channel, price entered a consolidation phase and formed a large triangle pattern, where the ascending support line continues to hold the market structure.
Currently, XAUUSD is holding above the 4,630 support zone while trading below the 4,800 resistance zone. Price recently bounced from the triangle support line and remains compressed beneath the descending triangle resistance line, signaling that buyers are still active despite the ongoing consolidation.
My Scenario & Strategy
As long as XAUUSD remains above the 4,630 support zone and respects the ascending triangle support line, the bullish scenario remains valid. A continuation higher could push price toward the 4,800 resistance zone (TP1).
However, if price breaks below the 4,630 support and loses the triangle support structure, the bullish outlook would be invalidated, opening the path for a deeper pullback.
That’s the setup I’m tracking. Thank you for your attention, and always manage your risk. Long 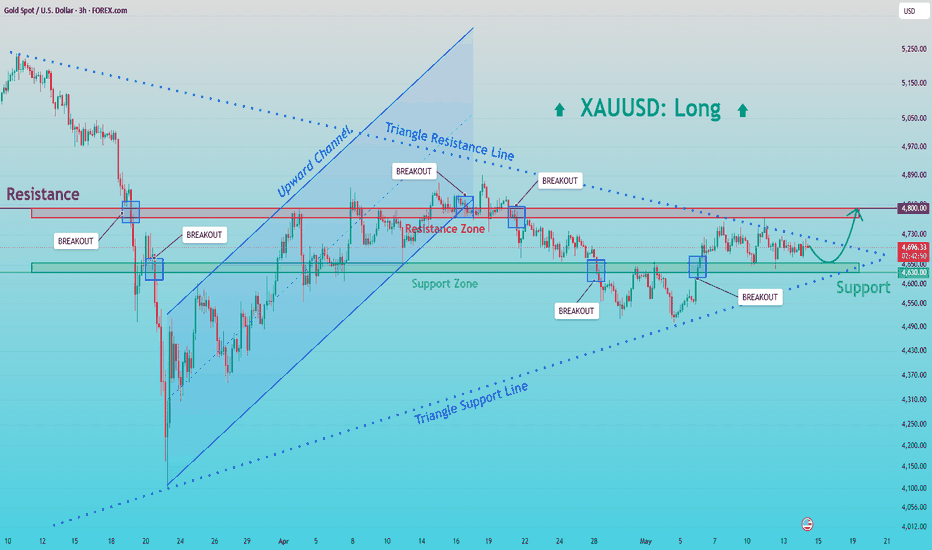
BITCOIN - Bullish trend. The hunt for liquidity ahead of a rallyBINANCE:BTCUSDT.P is trading within the range of 79,500–82,800. The trend is bullish; the price continues to maintain this momentum and test the 200-day moving average, a breakout of which could strengthen the trend—though this will require patience...
May began with a strong institutional inflow: in the first 10 days of May, spot ETFs attracted over $1.25 billion, marking the sixth consecutive week of net capital inflows. The movement was spurred by progress on the CLARITY Act—the main legislative initiative to regulate digital assets in the U.S.
Bitcoin maintains a bullish trend. A long squeeze of the key support zone at 79,500 is bringing the price back into a range where a local bullish structure is being confirmed. Locally, Bitcoin is attempting to close the imbalance zone and test the liquidity zone before rising.
Resistance levels: 82,000, 82,460, 82,830
Support levels: 80,220, 79,960, 79,500
A retest of support, a liquidity capture, and the bulls holding the price above 80K could become the next technical driver for growth
Best Regards, R. Linda! Long 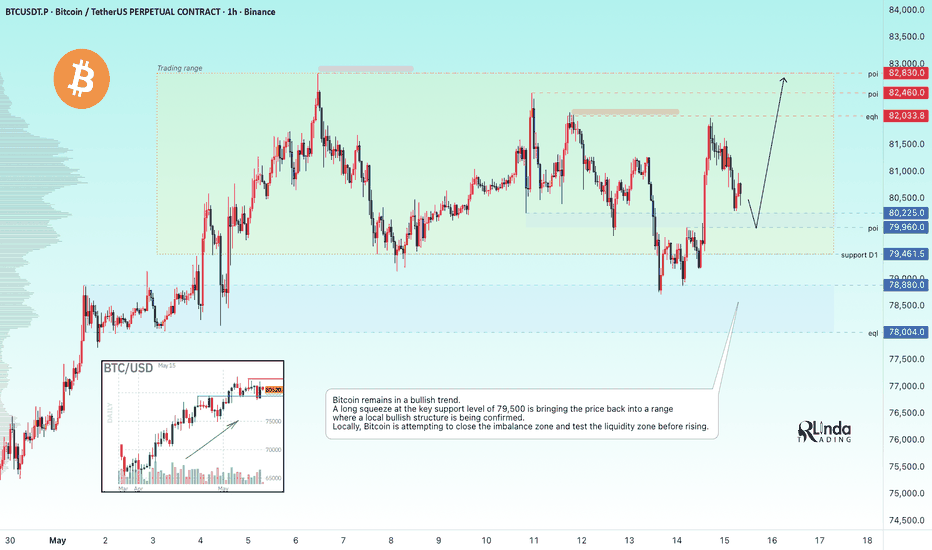
Short 
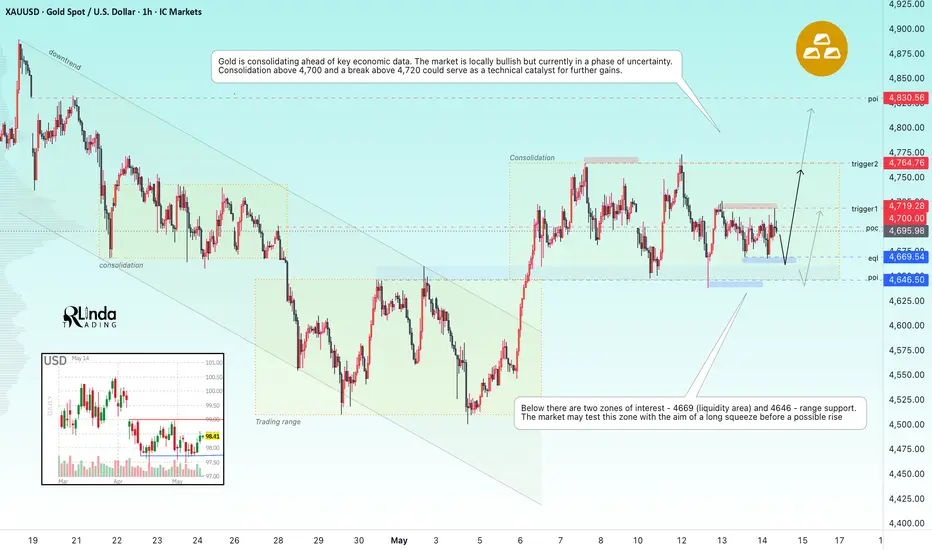
GOLD - Consolidation before a strong moveICMARKETS:XAUUSD is in a bullish consolidation phase, trading within the 4,650–4,750 range. The market is awaiting the outcome of the meeting between Trump and Xi Jinping, as well as the release of the latest economic data.
The lack of progress in U.S.-Iran negotiations and rising inflation expectations have increased bets on a Fed rate hike this year. Inflation confirms the impact of the trade war: CPI (3.8% y/y). The data reinforces hawkish expectations. However, Kevin Warsh’s confirmation as Fed chair offers a glimmer of hope. The market is anticipating a rate cut...
Gold is stuck at the lower end of its weekly range, awaiting a catalyst. Key variables include the outcome of the Trump-Xi summit, U.S. retail sales data, and the geopolitical backdrop regarding the conflict in the Middle East.
Technically, gold is consolidating after breaking through global downward resistance. Essentially, the current consolidation is a step toward a strong move...
Resistance levels: 4700, 4720, 4764
Support levels: 4669, 4646
Before rising, the market may test the support cluster located at the bottom of the range—4669, 4646 (a long squeeze would provide an opportunity for growth). However, if the bulls keep the price above 4700, this could become another technical driver for growth
Best Regards, R. Linda! Long 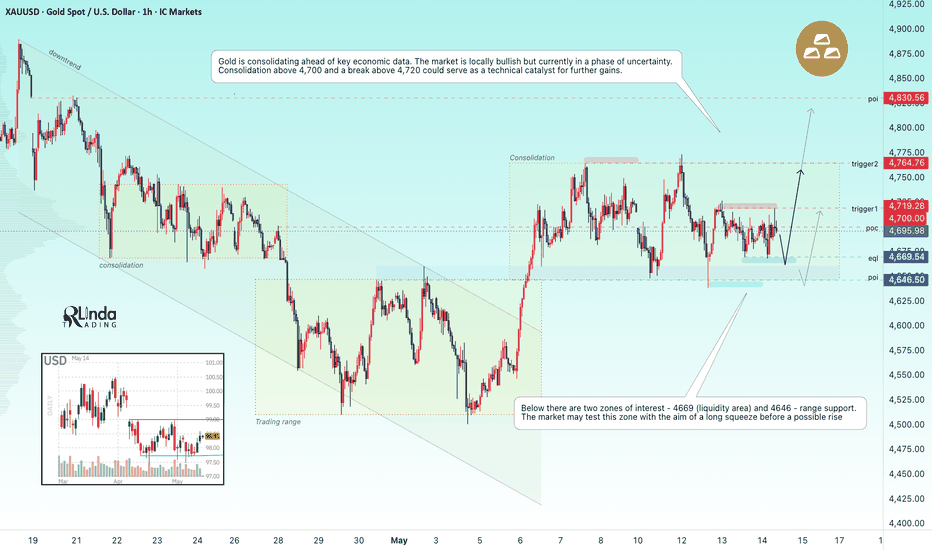
 Long
Long
 Long
Long
GSSC – Post-Triangle Retest at SupportGSSC – Post-Triangle Retest at Support 📉🌾
The Reality: I see a "Strategic Utility" that serves as the backbone of Egypt’s food security. 🏛️✨
As the primary custodian of the nation’s grain reserves, GSSC operates a high-volume, thin-margin model where performance is tied to government wheat cycles and the modernization of storage logistics.
The Cash Engine: I recognize a company with a strong ability to convert operating profits into cash, free from "financial engineering".
However, I find that a significant portion of liquidity is consistently tied up in receivables from state entities, making collection delays the primary drag on its cash position.
The Growth Drivers: I observe that the expansion of "Silo Complexes" across the Delta and Upper Egypt is increasing throughput and discharge fees, which are largely shielded from local inflation.
While GSSC doesn't own the grain, higher global wheat prices increase the "Security and Insurance" value of its operations, often triggering fee adjustments.
The Dividend Play: I find that GSSC remains a "Dividend King" with a high payout ratio (recently ~EGP 4.25 per share).
In a sideways market, it acts as a defensive yield play, particularly attractive to domestic pension funds seeking stability.
Sharia Status: ✅ Confirmed Compliant.
I confirm that GSSC is Sharia compliant, meeting the necessary financial and activity-based criteria.
However, it is not currently included in the EGX33 Shariah Index, which typically highlights the most liquid compliant stocks.
Technical Analysis:
The Pattern Exit: I noticed the stock successfully hit its target following the ascending triangle breakout and is now undergoing a healthy technical reset.
The Support Cluster: I’ve identified a strong support zone between 265 and 271. 🩹📈
If the price can stabilize and close above 271, the "take profit" phase is likely over.
The Correction Target: Should the 265 level fail, I am eyeing the 249 mark as a high-conviction entry point, which aligns with historical price action and the lower boundaries of the current trend.
The Red Line: I am keeping a close watch on the 200MA. A break below this would signal a transition into a downtrend, invalidating the current defensive thesis.
Liquidity Note: I note that volume is decreasing during this pullback, which I find encouraging for a potential reversal.
Verdict: The Infrastructure Anchor. ⚓🌾
I view GSSC as a low-beta, high-reliability hold.
I am watching for a close above the 271 main support to signal a safe entry.
If the correction deepens, I see the 249 level as a secondary "Value" entry point, provided it stays above the 200MA.
Do you think the current decrease in volume suggests that the "take profit" phase is reaching its end, or is there more room for a slide to 249? 🤔🔍📈
If I like my posts, I follow and boost 🙌✨
🎁 Get a $15 discount on my next subscription:
🔗 www.tradingview.com ✨💸  Long
Long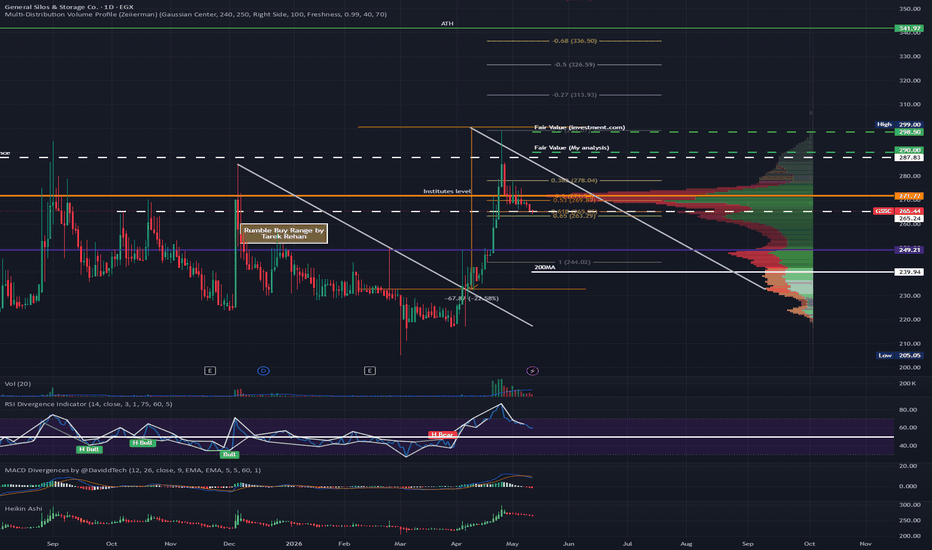
Oil Is Pressing a Major Resistance — Breakout Next?Before we start the technical analysis of oil ( FX_IDC:USDBRO ), we should mention that the main moves in oil over the past two to three months have been driven by developments in the Middle East—especially tensions between Iran, the U.S., and Israel. Right now, the key issue remains the Strait of Hormuz, which is a point of contention between Iran, the U.S., and other Middle Eastern countries. A major portion of oil and its products passes through this strait, which is subject to military tensions. Thus, any news about agreements or heightened conflict can quickly affect oil prices—so managing risk ahead of time is crucial.
Currently, oil is moving near a resistance zone($106-$102).
From a classical technical analysis view, it seems oil has been moving in a symmetrical triangle over the past two months. Since a symmetrical triangle is a continuation pattern—and the prior move was bullish—we could expect a continuation of the bullish trend for oil.
From an Elliott Wave standpoint, it seems oil has completed its main wave 4, and this wave four structure was a Zigzag correction(ABC/5-3-5).
I expect that oil can break the resistance zone($106-$102) and rise at least up to $107. If the breakout has strong momentum, we could see a move toward the upper line of the symmetrical triangle in the coming weeks.
First Target: $107.00
Second Target: Upper line of symmetrical triangle
Stop Loss(SL): $94.70
Points may shift as the market evolves
What’s your view on oil? Can it hit new all-time highs, or not?
💡 Please respect each other's opinions and express agreement or disagreement politely.
📌U.S. Dollar/Brent Crude OIL Analysis (USDBRO), 4-hour time frame.
🛑 Always set a Stop Loss(SL) for every position you open.
✅ This is just my idea; I’d love to see your thoughts too!
🔥 If you find it helpful, please BOOST this post and share it with your friends.  Long
Long

 Long
Long