 Short
Short

DOGE - Elon Musk will pump the coin! (Time to buy)The bear market in the crypto market is slowly but surely coming to the end. We have seen major drops in altcoins and in Bitcoin. Buying at the current price is 100% worth it, because the discount is huge and we will see much higher prices in the next years! DOGE is among coins that have a very promising future, not only because of the extremely strong community but also because of current major players pushing the price higher, such as Elon Musk. This coin is not going anywhere; it's not going to die like other altcoins. Buying this coin is something like a certainty and a good investment (if the network keeps running).
This is a short-term analysis - on the chart we see a falling wedge - bullish reversal pattern. That's a very classic reversal pattern on the crypto market with a very high probability of success. We already saw a retest of the wedge, so this is a great opportunity to buy DOGE without frustration about retests.
Utility and adoption microtransactions: Fast transaction speeds and low fees keep DOGE viable for tipping and online small-value payments. Platform integration: Speculation persists around potential future utility integration into mainstream social and payment platforms like X.
ETF Accumulation: steady asset inflows into recently listed spot DOGE investment vehicles provide long-term structural demand, helping to absorb its native 5-billion annual coin inflation.
Multiple standalone spot ETFs are fully operational on U.S. markets, including funds from Grayscale (GDOG), Bitwise (BWOW), and 21Shares (TDOG), which trades directly on Nasdaq with backing from the official Dogecoin Foundation.
Write a comment with your altcoin + hit the like button, and I will make an analysis for you in response. Trading is not hard if you have a good coach! I am very transparent with my trades. Thank you, and I wish you successful trades!  Long
Long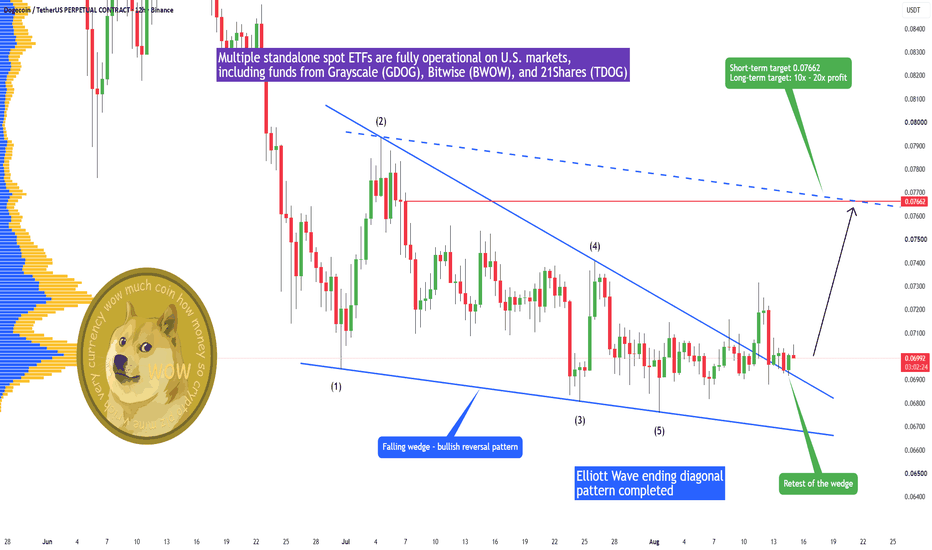
BNB IS QUIETLY TURNING BULLISH, ARE BEARS ABOUT TO GET CAUGHT?Yello, Paradisers! are BNB bears about to get trapped while price prepares for another push higher?
💎BNBUSDT is currently showing a strong bullish structure after forming a bull flag combined with a falling-wedge-type pattern following the previous impulsive move. At the same time, price is showing a clear rejection from the 1H POI zone, increasing the probability of a bullish reaction from this area.
💎The higher-timeframe structure is also supporting this scenario. BNB remains bullish on the Daily, 4H, and 1H timeframes, giving us proper multi-timeframe alignment. More importantly, the previous 4H resistance has now turned into a potential support zone, and this area overlaps with the 1H POI where we are currently seeing buyers stepping in.
💎Another factor supporting this setup is the current money-flow rotation across the market. While BTC has been showing weakness, capital has been rotating into other parts of the market, including exchange-related assets such as HYPE. If this rotation continues, BNB could become one of the next assets to receive stronger inflows. When we combine this possibility with the bullish technical structure, the probability of a continuation move becomes even more interesting.
💎If buyers maintain control, the first major upside objective sits around the next liquidity area and 1H resistance near $615.40. Above that, the next important target is the 4H resistance and liquidity zone around $620.79.
💎For this bullish idea to remain valid, BNB needs to protect the recent swing low. Our key invalidation level is around $605.30, including a small buffer below the structure. We would want to see a confirmed candle close below this level before considering the bullish scenario invalidated.
💎The structure currently favors the bulls, but the market still needs to confirm the move. Do you think BNB will sweep the liquidity around $620 next, or will buyers lose control before reaching it?
As always, patience and confirmation are essential. A good-looking setup is never a reason to force a trade. Protect your capital, respect the invalidation, and focus only on high-probability opportunities. Strive for consistency, not quick profits. Treat the market as a businessman, not as a gambler.
MyCryptoParadise
iFeel the success 🌴  Long
Long
Bitcoin Coils Inside a Triangle — Is a Major Breakout Coming?Bitcoin ( BINANCE:BTCUSDT ) is currently trading near the Support Lines while forming a Symmetrical Triangle close to the upper trendline of the Descending Channel.
Over the weekend, price action has remained compressed, suggesting that a larger directional move could be approaching.
Can Bitcoin hold the Support Lines and break above the Descending Channel?
Technical Analysis
From an Elliott Wave perspective, Bitcoin also appears to be forming a Contracting Triangle, which could complete Wave B and set the stage for the next Impulsive Wave.
Inside the triangle, BTC is trading near the key trading level of $63,345.
💡 Educational Note: A Contracting Triangle often develops during corrective phases and typically precedes the final move in the direction of the larger structure once price breaks out.
I expect Bitcoin to break above the upper trendline of the Descending Channel and rise at least toward $63,400.
If BTC successfully breaks the key trading level of $63,500, the bullish move could extend toward the Cumulative Short Liquidation Leverage zone.
Trade Setup
First Take Profit(TP): $63,400
Second Take Profit(TP): Cumulative Short Liquidation Leverage($63,680-$63,550)
Stop Loss(SL): $62,767
Key Trading Levels: $63,345 _ $63,500
Which level do you think Bitcoin will reach first?
🟢 $63,680
🔴 $62,767
📌 Bitcoin Analysis(BTCUSDT), 1-hour time frame.
🛑 Always use proper risk management and set a Stop Loss(SL) for every position.
🚀 If this analysis helps your trading plan, a BOOST would help more traders discover it.  Long
Long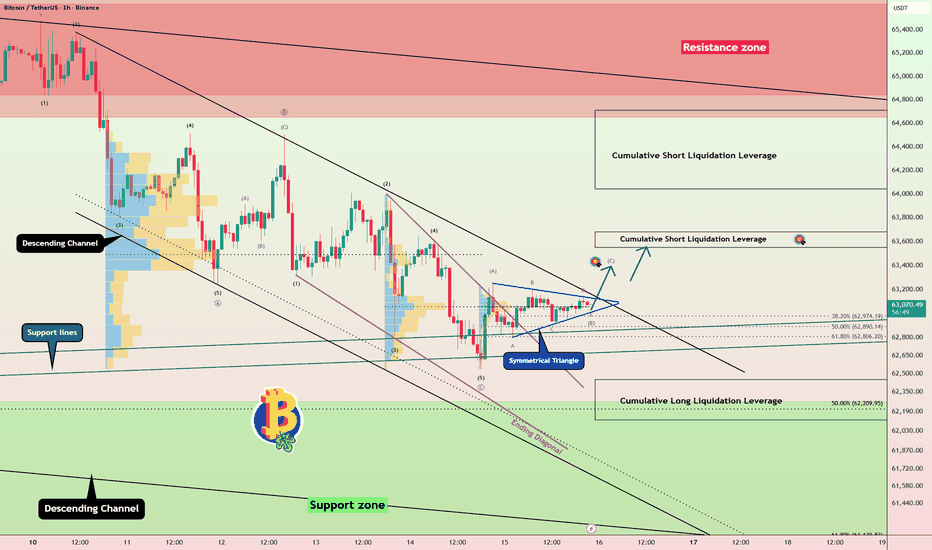
MU: Falling Wedge Breakout – Scaling Toward $1,680MU has completed a textbook Falling Wedge breakout on the Daily chart. The June ATH was followed by a sharp correction, which transitioned into a descending wedge – a classic bullish continuation structure.
The macro structure is undeniably bullish.
The recent correction served its purpose—to shake out weak hands and create liquidity for the next leg up.
With the pattern now broken, the 873.80 level is transitioning from resistance into structural support.
📉 4H Execution & Entry Filter:
For the professional trader, the daily pattern is the macro signal, but the 4H timeframe is where we confirm and execute.
Price is currently sitting right at the 873.80 breakout zone.
We do not pre-empt the move.
We wait for a clear Market Structure Shift (MSS) on the 4H chart—specifically, either a clean impulsive rejection off this 873.80 level, or a liquidity sweep (fakeout) below it followed by a sharp reclaim.
The setup offers an asymmetrical R:R, making it a high-probability tactical play.
Here are the exact parameters of this tactical setup:
Entry Area: 873.80 (Wait for 4H candle close confirmation).
Invalidation (SL): 769.0. This is the structural floor. If price breaks this level, the wedge breakout thesis is completely void.
Mid-Term Target: 1,259.0 (ATH & 61.8% Fibonacci extension).
Long-Term Target: 1,680.0 (100% Fib extension & psychological round number).
💡 Execution Mindset:
No predictions. No forced entries. Let the lower timeframe structure confirm the daily signal. The trend is up; we simply wait for price to offer us a protected entry.
⚠️ Risk Warning:
This content is for educational purposes only and is not financial advice. MU is a highly volatile tech stock with strong fundamental and macroeconomic correlations. Always manage your position sizing strictly according to your personal risk tolerance, respect your invalidation level without hesitation, and never risk capital you are not fully prepared to lose.  Long
Long
360 ONE: Fresh Weekly HVF Breakout | Indian Wealth Proxy Ready to launch. 🚀🚀🚀
360 ONE WAM Limited (NSE: 360ONE) is executing a fresh weekly breakout from a Hunt Volatility Funnel (HVF) consolidation, functioning as one of the purest structural proxies for the Indian bull market.
@TheCryptoSniper
Why This Company Can Thrive Over the Next 12 Months
Direct Proxy for Indian Wealth Creation: As India’s top wealth manager for HNIs and Ultra-HNIs, 360 ONE’s revenue is tied directly to the growth of domestic equity markets and wealth expansion.
When the market moves up, their Assets Under Management (AUM) automatically expand, driving higher management fee collection.
Shift from Physical to Financial Assets: Indian household savings are structurally shifting out of physical assets like real estate and physical gold into financial markets—specifically Equities, Alternative Investment Funds (AIFs), and Portfolio Management Services (PMS).
360 ONE is the market leader capturing these flows.
Sticky, High-Margin Recurring Revenue: Over 70% of the company's income comes from recurring annual advisory fees (ARR) rather than one-off transaction commissions.
This gives the business predictable, high-margin earnings that compound cleanly over time.
Expanding Ecosystem & Market Share: Through strategic acquisitions and partnerships, 360 ONE has built a full-stack ecosystem catering to both first-generation tech entrepreneurs and multi-generational family offices, locking in client capital for the long term.
Technical Targets
Breakout Zone: ₹1,180 – ₹1,190 weekly compression zone
Linear Target 1 (T1): 1,225.8
Linear Target 2 (T2): 1,558.2
Linear Target 3 (T3): 1,633.3
Logarithmic Target (T4): 1,857.5
Educational Technical Breakdown (NFA)
Pattern Mechanics: High Volatility Flag (HVF)
Volatility Compression: An HVF occurs when price consolidates tightly following an initial expansion move. As the range narrows within the weekly compression zone (₹1,180–₹1,190), volatility contracts, building energy for the next directional leg.
Liquidity Absorption: The breakout above resistance signals that overhead selling pressure has been fully absorbed, opening the door for trend continuation.
Linear vs. Logarithmic Target Projections
Linear Scale (T1–T3): Derived from absolute point-distance projections from the base structure. Linear targets are ideal for short-to-medium-term structural levels and milestone tracking.
T1 (Linear): 1,225.8
T2 (Linear): 1,558.2
T3 (Linear): 1,633.3
Logarithmic Scale (T4): Measures constant percentage-based gains rather than fixed rupee moves. On multi-month macro charts, log projections account for compounding growth and give a far more realistic target during strong secular trends.
Disclaimer: This idea is shared strictly for educational and analytical purposes.
It does not constitute financial or investment advice.
Always manage your own risk.
#360ONE #IndianStockMarket #TechnicalAnalysis #HVF #PriceAction #TradingView #NSE #Nifty #WealthManagement  Long
Long
Short 
EGX30 index - Is a rising wedge pattern forming?Is the EGX30 index potentially forming a rising wedge?
On the daily chart, the EGX30 is showing what could be a rising wedge — the price is moving between two upward-sloping lines that are gradually converging.
A rising wedge describes a market that is still climbing, but with steadily weakening momentum. This is reflected in the diminishing, overlapping price action and a tendency for trading volume to decline.
Looking at the current chart, we can see:
- An initial high near 54,000.
- A low near 45,500.
- A new high near 55,500.
- A higher low near 50,000.
- After which the index resumed its upward movement.
This structure fits the characteristics of a rising wedge quite well. However, it is still forming and has not yet been confirmed.
The key test will come at the lower boundary of the wedge:
- If EGX30 breaks the lower boundary with a clear daily close, the bearish signal becomes much stronger, and the probability of an uptrend reversal increases significantly.
- If, instead, the index breaks through the upper boundary and holds above it, the rising wedge pattern fails (or remains incomplete) and can no longer be treated as a bearish signal.
An important point:
Because the wedge appeared following an uptrend, a confirmed downward break would — according to John Magee's methodology — signal a bearish reversal rather than a continuation of the uptrend.
The current pattern is longer than the classic wedge Magee preferred, so I am treating it as a *potential* rising wedge rather than a confirmed one.
Additionally, the rise from point B to point C was shorter, and its trading volume was higher, than the move from point D so far. This supports the idea that the momentum behind the upward move is weakening.
That said, the MACD indicator is still positive and has not yet confirmed a peak. So we'll watch the next MACD peak to see whether it comes in lower than the previous one — which would signal continued weakness in momentum, as seen between peaks A and C — or whether the current, longer-lasting price rise gives the indicator more strength or support.
In summary:
- EGX30 is still rising, but there is a warning sign worth monitoring.
- The lower boundary of the wedge is the most important level to watch right now.
- A break of this boundary would be a significant bearish signal.
- A break of the upper boundary would invalidate the rising wedge scenario.
- Current resistance: 55,000 (already broken; we are awaiting confirmation of the breakout).
- Support levels: 52,800 and 49,700.
Source: This analysis is based on John Magee's theory in *Technical Analysis of Stock Trends*, specifically the rules for the Rising Wedge pattern and the price and volume behavior during its formation and breakout.
Note: This is based on the daily chart only and represents a personal opinion, not investment advice. Please consult your account manager before investing. Good luck! XAUUSD: Retest Scenario — $4,450 Resistance in FocusHello everyone, here is my breakdown of the current XAUUSD setup.
Market Analysis
XAUUSD previously traded inside a broad wedge before breaking above the resistance line and shifting bullish. After the breakout, price formed an upward channel and continued higher toward the 4,450 Resistance Zone.
Currently, XAUUSD is trading below the 4,450 Resistance Zone while holding above the 4,350 Support Zone and the rising channel support. The latest pullback appears to be a retest of support, keeping the bullish structure intact.
My Scenario & Strategy
As long as XAUUSD remains above the 4,350 Support Zone and respects the rising channel, the bullish scenario remains valid. A rebound from current levels could push price toward the 4,450 Resistance Zone (TP1).
However, a breakdown below 4,350 would weaken the bullish outlook and increase the risk of a deeper correction.
That’s the setup I’m tracking. Thank you for your attention, and always manage your risk.  Long
Long
BTCUSDT Bearish Outlook: Rejection Could Drive Price to $62.7KHello traders! Here’s my technical outlook based on the current BTCUSDT (2H) chart structure. BTCUSDT previously traded inside a descending structure before recovering toward the 64,600 Resistance Zone. After forming a range near resistance, price faced rejection and moved lower, suggesting that sellers are regaining control. Currently, BTCUSDT is trading below the 64,600 Seller Zone while holding above the 62,700 Buyer Zone. The recent rejection and breakdown from the range suggest that bearish momentum may continue. As long as BTCUSDT remains below the 64,600 Seller Zone and respects the descending resistance line, the bearish scenario remains valid. A rejection from current levels could push price toward the 62,700 Buyer Zone (TP1). However, a breakout above 64,600 would weaken the bearish outlook. Please share this idea with your friends and click "Boost" 🚀 Short 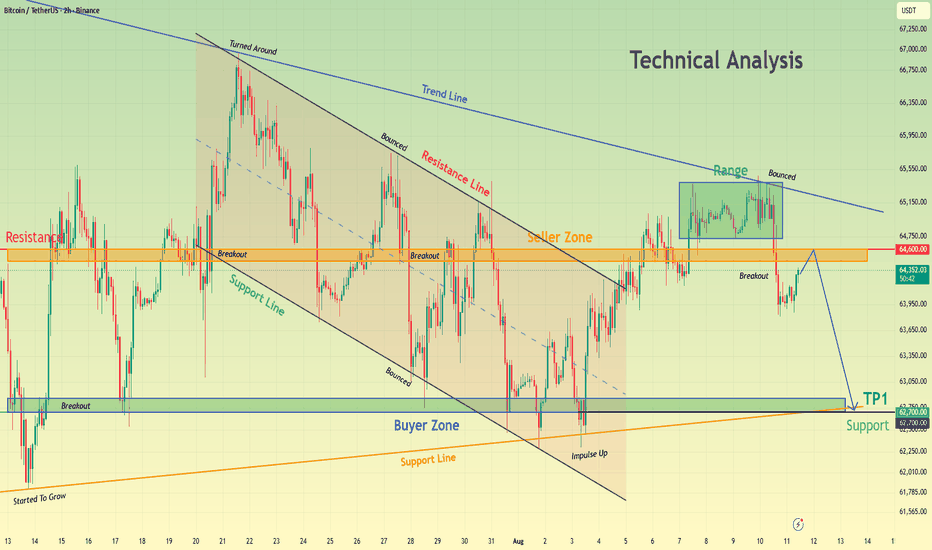
BTCUSDT 1H: Descending Wedge Breakout & Seller Trap (Long Setup)1. Market Context
On the 1H chart, Bitcoin (BTCUSDT) is compressing inside a blue descending wedge pattern. After executing a sweep of bottom liquidity down to 62,900 ("Liquidity Sweep" / "A Few Buyer"), price bounced and is now pressing directly against the upper trendline resistance near 63,580.
2. Trader Behavior & House Trap Analysis
• Where Traders Place Orders: Seeing the blue descending trendline holding, retail traders are opening SELL orders (marked "Seller"), expecting BTC to drop all the way to the major floor at 62,521.41 ("Buyer Wait Here").
• Trader Stop-Loss & Target: Shorters are placing their Stop-Loss orders immediately above the trendline around 63,800 – 64,000, targeting lower prices.
• How the House Plays It: The House previously flushed early buyers down at 62,900 ("Liquidity Sweep") to collect cheap liquidity. Now, with retail crowded into sell orders along the descending trendline, the House will push price up to break the pattern ("Break Signal"). The forced buy-stop market orders from trapped shorters cutting losses will fuel a sharp squeeze toward 64,150 (TP1) and 64,700 (TP2).
3. Trade Setup
• Entry: 63,580 (Confirmed 1H close above the blue trendline / Break Signal)
• Stop Loss (SL): 63,000.00 (Placed safely below the "Liquidity Sweep" low)
• Take Profit 1 (TP1): 64,150.00
• Take Profit 2 (TP2): 64,700.00
• Risk-to-Reward Ratio (R:R): Approx 2:1 (Calculated toward TP2) Long 
US30 1H: Descending Trendline Breakout & Seller Trap (Long Setup
1. Market Context
On the 1H chart, US30 is breaking out above its blue descending trendline after executing a fake breakdown sweep near 53,680.0. Price is now holding firmly above the trendline at 53,899.3, setting up a high-probability long trade.
2. Trader Behavior & House Trap Analysis
Where Traders Place Orders: Seeing the blue descending trendline and the recent drop toward the lower cyan support zone (53,200 – 53,400), retail traders opened SELL orders expecting US30 to continue crashing lower.
Trader Stop-Loss & Target: These short-sellers placed their Stop Loss orders immediately above the trendline around 53,900.0 – 54,000.0, targeting deeper support levels.
How the House Plays It: The House dropped price sharply down to 53,680.0 to flush out weak buyers and bait greedy shorters. Once retail filled sell orders at the bottom, the House aggressively pumped price back above the blue trendline (53,899.3). This traps all short-sellers, forcing them to buy back and cut losses, providing rocket fuel for a rally toward 54,250.0 (TP1) and 54,550.0 (TP2).
3. Trade Setup
Entry: 53,899.3 (Confirmed 1H close breaking above the blue trendline)
Stop Loss (SL): 53,680.0 (Placed safely below the bottom sweep low)
Take Profit 1 (TP1): 54,250.0
Take Profit 2 (TP2): 54,550.0
Risk-to-Reward Ratio (R:R): Approx 3:1 (Calculated toward TP2)  Long
Long
SOYUSD 1H: Ascending Trendline Breakdown & Buyer Trap
1. Market Context
On the 1H chart, Soybean Oil (SOYUSD) is compressing inside an ascending channel structure. Price was capped at 6,920.0 ("No Seller") without reaching the main overhead ceiling ("Seller Wait Here"), and is now pressing directly against the lower ascending trendline support around 6,820.0.
2. Trader Behavior & House Trap Analysis
Where Traders Place Orders: Seeing the blue ascending trendline hold multiple times, retail traders are opening BUY orders around 6,820.0 – 6,850.0 (marked "Buyer"), expecting another bounce up toward 7,000.0.
Trader Stop-Loss & Target: These buyers have stacked their Stop-Loss orders immediately below the trendline support, targeting profit at 7,000.0+.
How the House Plays It: The House capped the price early at 6,920.0 ("No Seller"), leaving retail buyers stranded without upward momentum. As retail crowds into buy orders on the trendline, the House will push price down to slice right through 6,820.0 ("Break Signal"). This triggers a cascade of buyer stop-losses (forced sell-stop market orders), driving price down rapidly toward 6,720.0 (TP1) and 6,590.3 (TP2).
3. Trade Setup
Entry: 6,820.0 (Confirmed 1H close breaking below blue trendline support / Break Signal)
Stop Loss (SL): 6,920.0 (Placed safely above the "No Seller" rejection high)
Take Profit 1 (TP1): 6,720.0
Take Profit 2 (TP2): 6,590.3
Risk-to-Reward Ratio (R:R): Approx 2:1 (Calculated toward TP2)  Short
Short
 Long
Long
 Long
Long
 Long
Long
BTCUSD: Futures are supporting the bounce📊 BTCUSD: Futures are supporting the bounce, but spot demand is still missing
Bitcoin is trading around $63,700, trying to stabilize after the recent drop, but the recovery still looks fragile.
The key news theme is that BTC is being supported more by the futures market than by real spot demand. CryptoQuant’s Ki Young Ju has warned that open interest is rising while on-chain spot demand remains weak or negative. That means traders are taking leveraged positions, but real cash buyers are not strong enough yet.
This matters because futures-led rallies can move fast, but they can also reverse fast. If funding gets crowded or liquidations start, the move can unwind quickly.
Swissblock’s view adds another defensive signal: high USDT dominance means capital is still parked in stablecoins instead of rotating aggressively into risk assets. Until that changes, BTC rallies may remain tactical rather than structural.
On the chart, BTC is still below the key resistance zone at $64,330-$64,400, where the 200 SMA is also sitting. Price is holding near EMA9/EMA20/SMA50, but bulls need a clean reclaim above $64,330 to prove that the bounce has real strength.
RSI is near 52, so momentum is neutral. MACD is improving, but not strong enough yet to confirm a full breakout.
Bullish: if BTC reclaims $64,330-$64,400, the next target is $65,250.
Rejection: if price fails below $64,330, BTC may stay trapped between $63,200 and $64,300.
Bearish: below $63,200, the recovery structure weakens and downside risk opens toward $62,600-$62,800.
⚠️ Not financial advice. Silver: breakout attempt or rejection at trendline?Silver: breakout attempt or rejection at trendline?
XAGUSD is trading near $61.80 after a strong rebound from the lower part of the descending structure. On the daily chart, silver is now testing a key resistance cluster: the falling trendline, SMA 50 near $62.38, and the current supply zone around $62.00–$63.00. RSI is above 50, which supports the rebound, but it is also approaching its own descending resistance line. So the next 24 hours look like a confirmation test, not a clean bullish signal yet.
Current situation — Ten of Stonks
Silver is trying to recover after a long corrective phase. Buyers have pushed price back above EMA 9, but the market is still below the major SMA 200 near $71.00. This suggests momentum is improving, but the bigger trend has not fully reversed yet.
Key factor — Page of Currencies
The key factor is whether buyers can turn this rebound into a confirmed breakout. A daily hold above $62.40–$63.00 would show that fresh demand is entering the market. If price fails there, the move may become only a short-term bounce inside the wider downtrend.
Probable scenario — Ten of Futures
The most likely scenario for the next 24 hours is volatility around resistance. Silver may try to break above $62.40–$63.00, but if buyers cannot hold that zone, a pullback toward $59.60 is possible. A stronger bearish reversal below $59.60 would open the way back toward $57.50–$55.00. If silver confirms above $63.00, the next upside zone is $65.00–$66.00.
Bottom line: silver has a bullish rebound setup, but confirmation is still missing. Ten of Stonks shows recovery potential, Page of Currencies asks for proof through resistance, and Ten of Futures warns not to fight the market if the breakout fails.
What does your analysis suggest: buy the breakout, wait for confirmation, or stay on the sidelines?
Tarot offers one possible perspective and is not a substitute for technical analysis. This publication does not constitute investment advice. Gold Holds Above 4,370 Support — Upside Potential RemainsHello traders! Here’s my technical outlook based on the current XAUUSD (1H) chart structure. XAUUSD previously traded inside a descending structure before breaking above the resistance line and shifting into a bullish trend. Price then formed an ascending channel and continued higher toward the 4,450 Resistance Level, where sellers may defend the upside. Currently, XAUUSD is trading below the 4,450 Seller Zone while holding above the 4,370 Buyer Zone and the ascending support line. The latest consolidation suggests that buyers remain active, with a possible pullback before another move higher. As long as XAUUSD remains above the 4,370 Buyer Zone and respects the ascending support line, the bullish scenario remains valid. A rebound could push price toward the 4,450 Resistance Level (TP1). However, a break below 4,370 would weaken the bullish outlook. Please share this idea with your friends and click "Boost" 🚀 Long 


