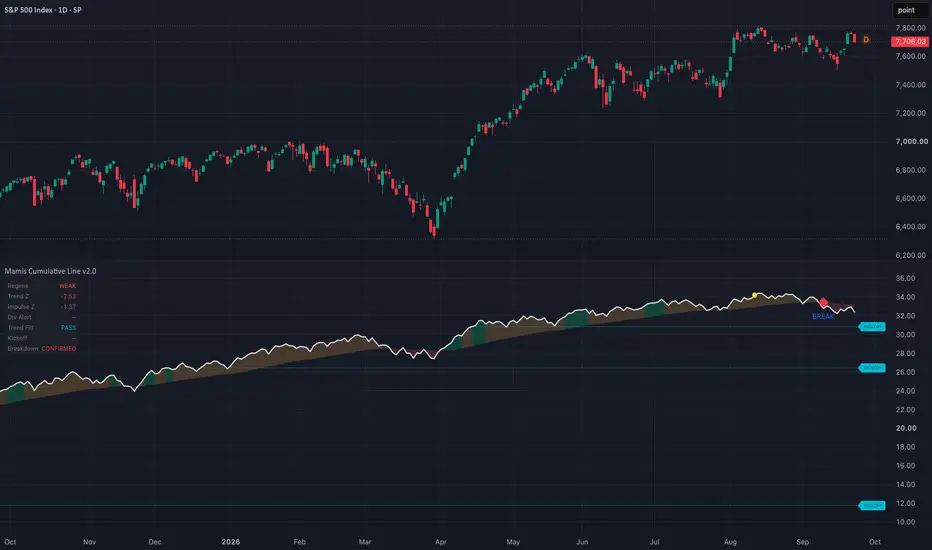
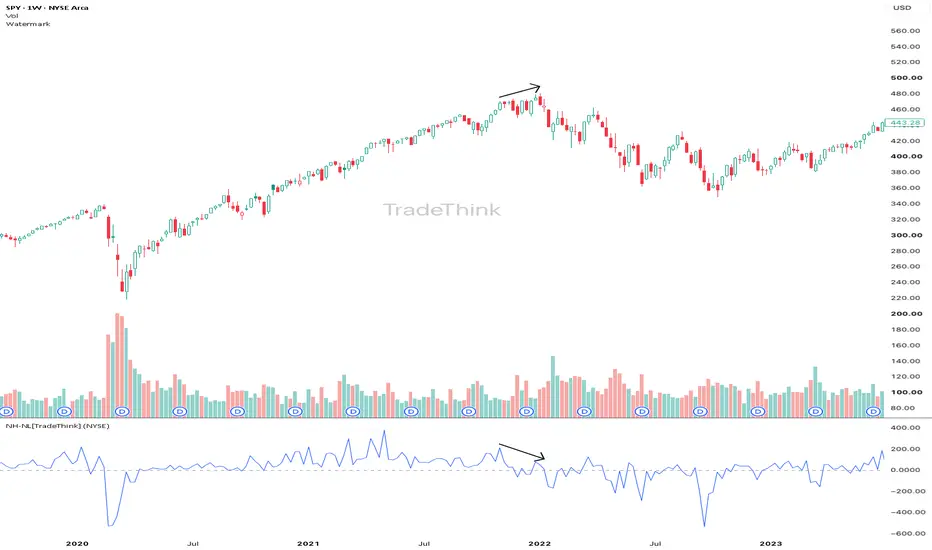
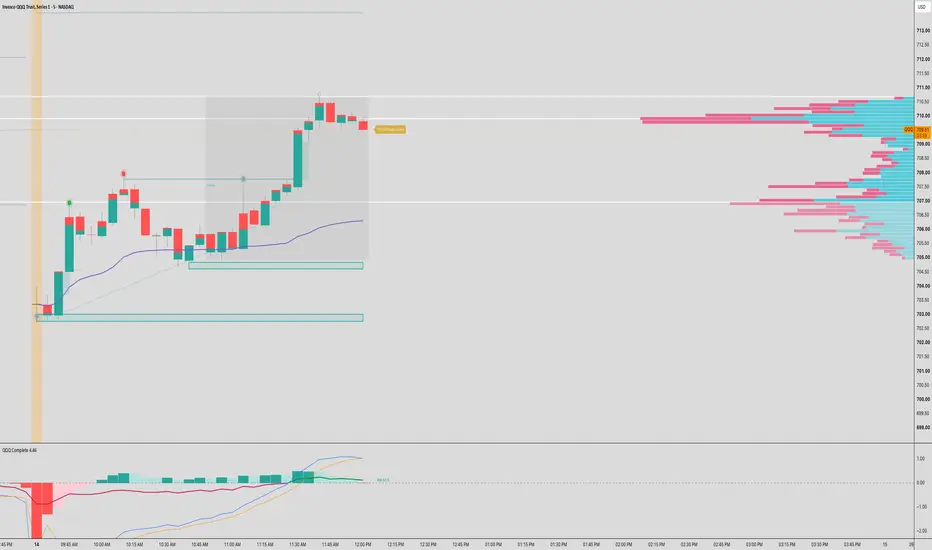
Mamis Cumulative LineOn a standard 1D chart, this indicator combines US breadth trend, thrusts and price divergence. It accumulates (advances − declines) / (advances + declines + unchanged issues) from the selected start year. Missing unchanged-issue data counts as zero.
Defaults use a 50-observation EMA and two observations to confirm regime changes. Green requires breadth at or above its EMA and above its previous three observations; amber stays at or above the EMA without the latter condition; red is below the E
Penunjuk