TradingView Stock Screener: trade smarter, not harder
The Stock Screener is a powerful financial analysis tool that helps you evaluate stocks using various ratios, timeframes, and indicators. Whether used as a standalone feature or alongside Supercharts, it allows you to filter thousands of stocks based on your specific investment criteria. With the Stock Screener, you can combine multiple filters to create comprehensive tables displaying stock metrics and fundamental data.
CONTENTS:
What is the Stock Screener?
In the Stock Screener, you can analyze common stocks, preferred stocks, and depositary receipts. It integrates both fundamental metrics and technical analysis, providing a wealth of data to inform your decisions. It is an excellent starting point for finding top gainers, industry leaders, or undervalued companies.
For example, if you are a day trader, the screener can quickly show you how stocks performed while you were away. You can also customize it to display watchlists containing your favorite securities.
While the screener provides a vast array of metrics from financial statements, technical traders will also find a comprehensive overview of key indicators and signals for their selected stocks.
How to access the Stock Screener
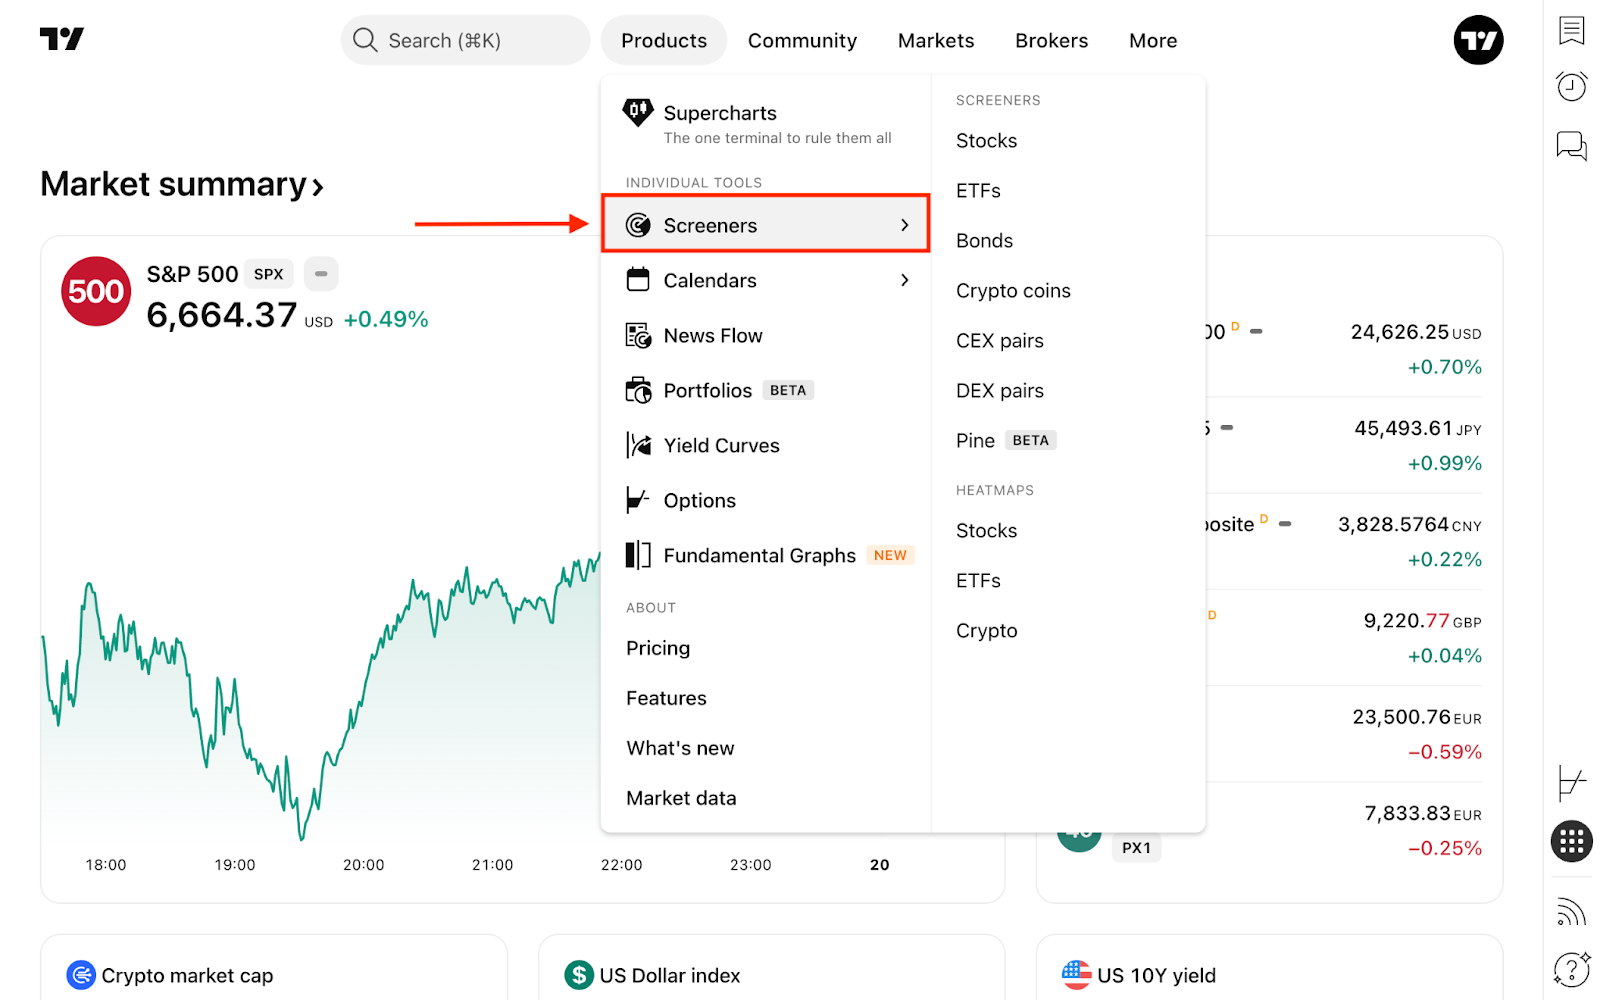
From the main page, click the Products dropdown, hover over Screeners, and select Stocks. Alternatively, clicking Screeners directly will also take you to the Stock Screener.
You can also access it directly from Supercharts. On the right-hand toolbar, click Products → Screeners.
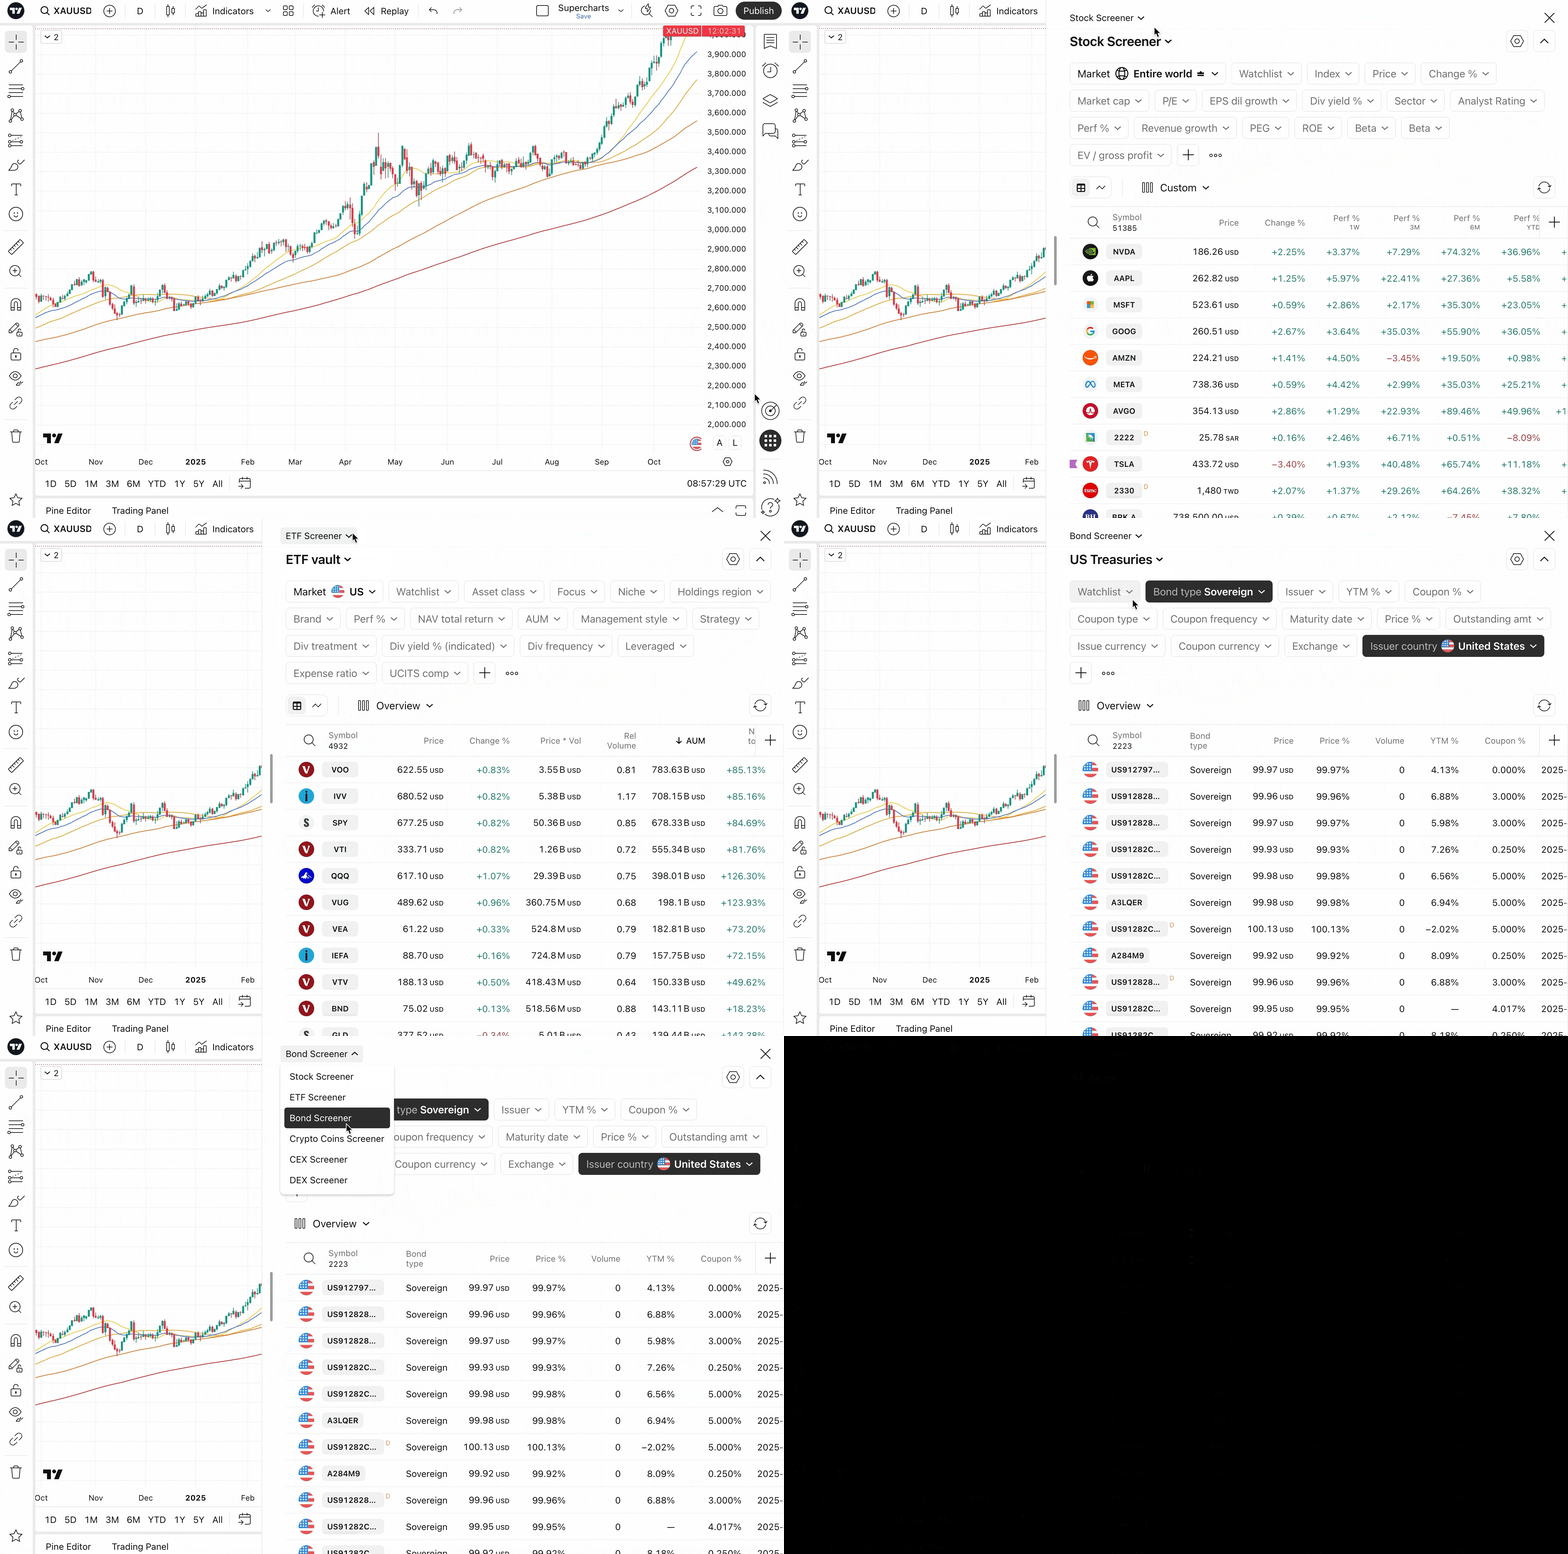
Both methods lead to the exact same tool with identical functionality, so choose the workflow that suits you best.
How to use the Stock Screener
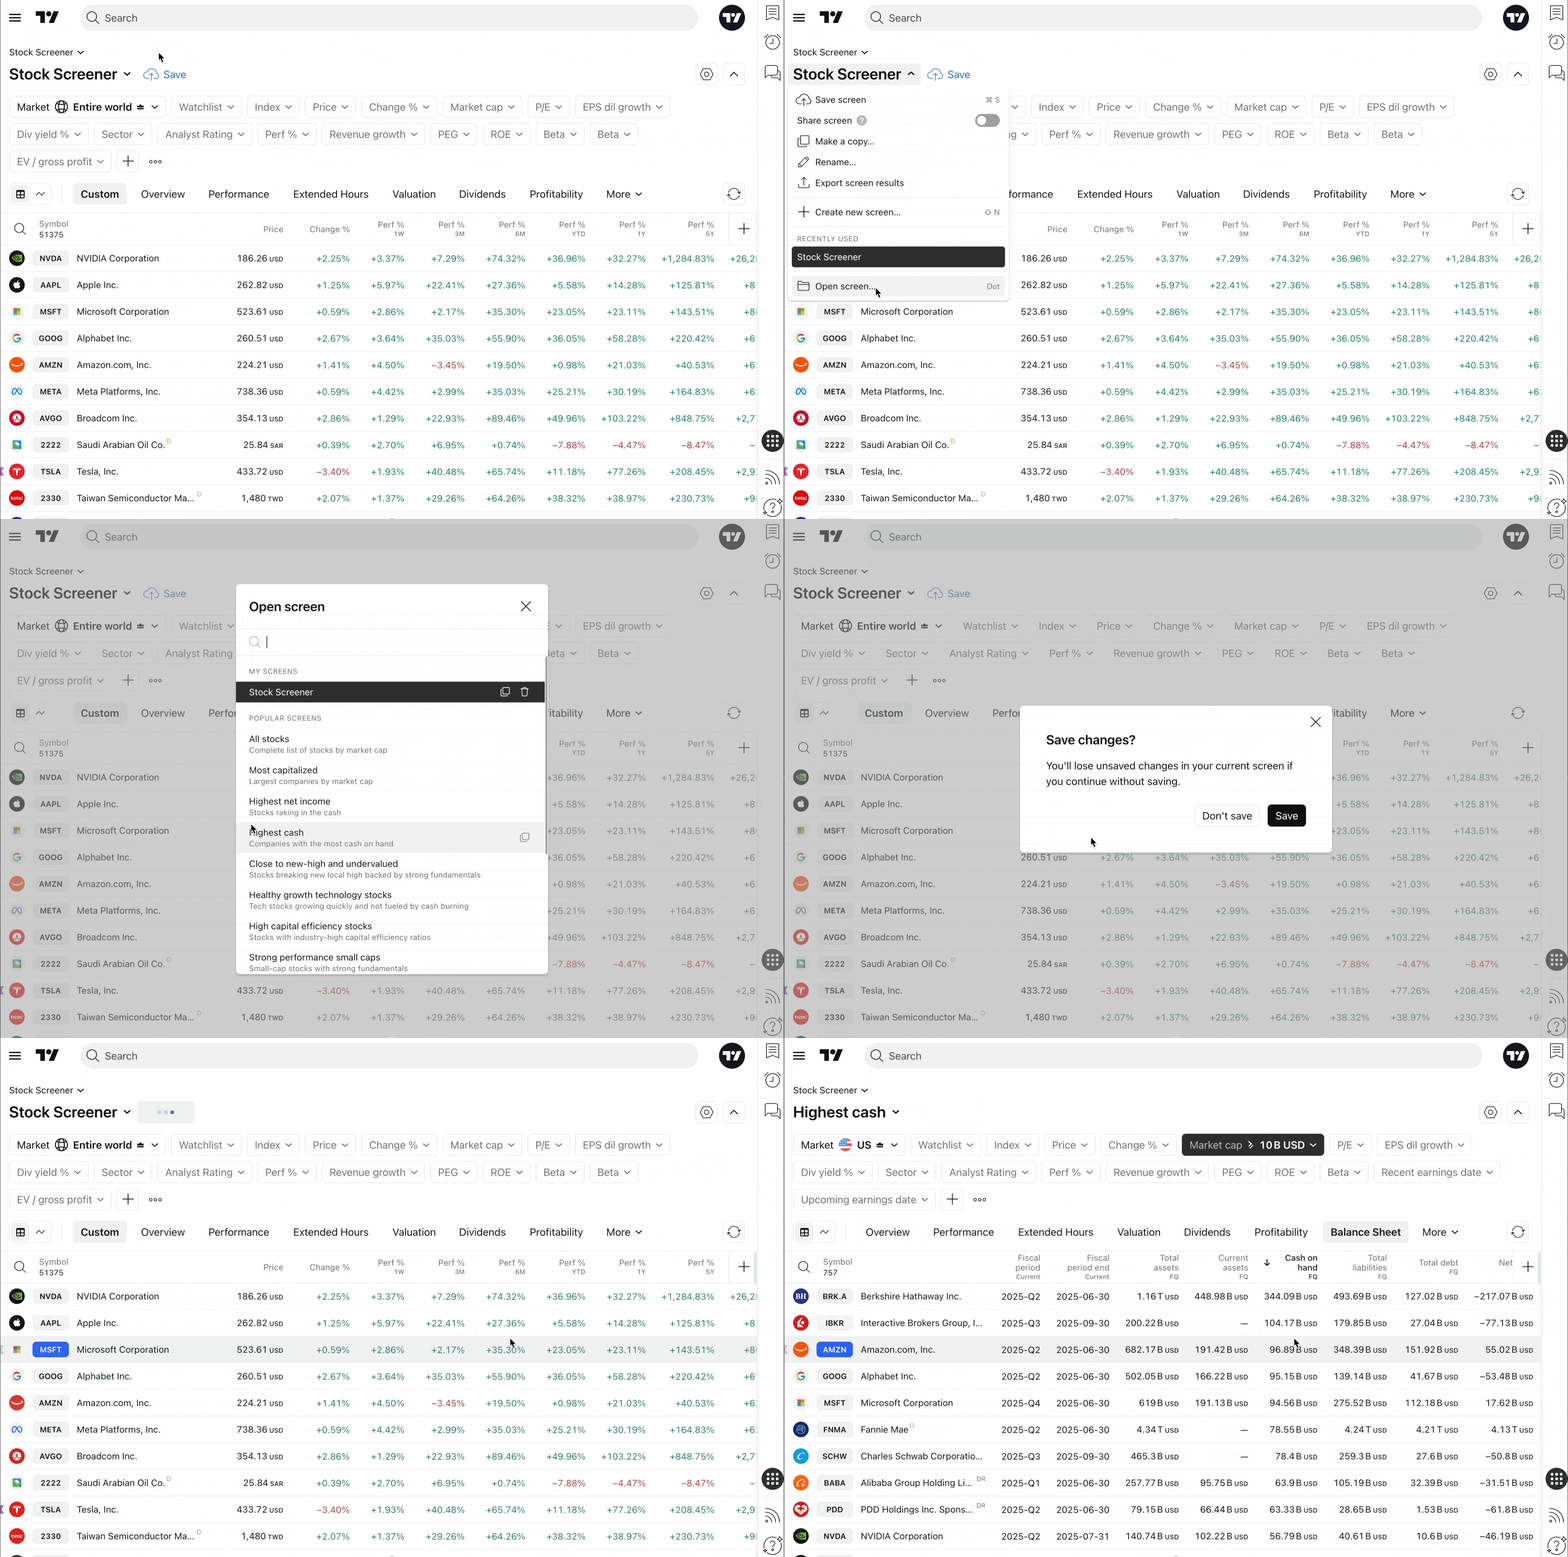
By default, the screener displays your local region's market, sorted by market capitalization. One of its core features is the ability to create and save multiple custom screens for future analysis. You can also use popular preset screens — carefully preconfigured filters designed to help you discover interesting companies.
To access these, click the current screen name in the top-left corner and select Open screen…
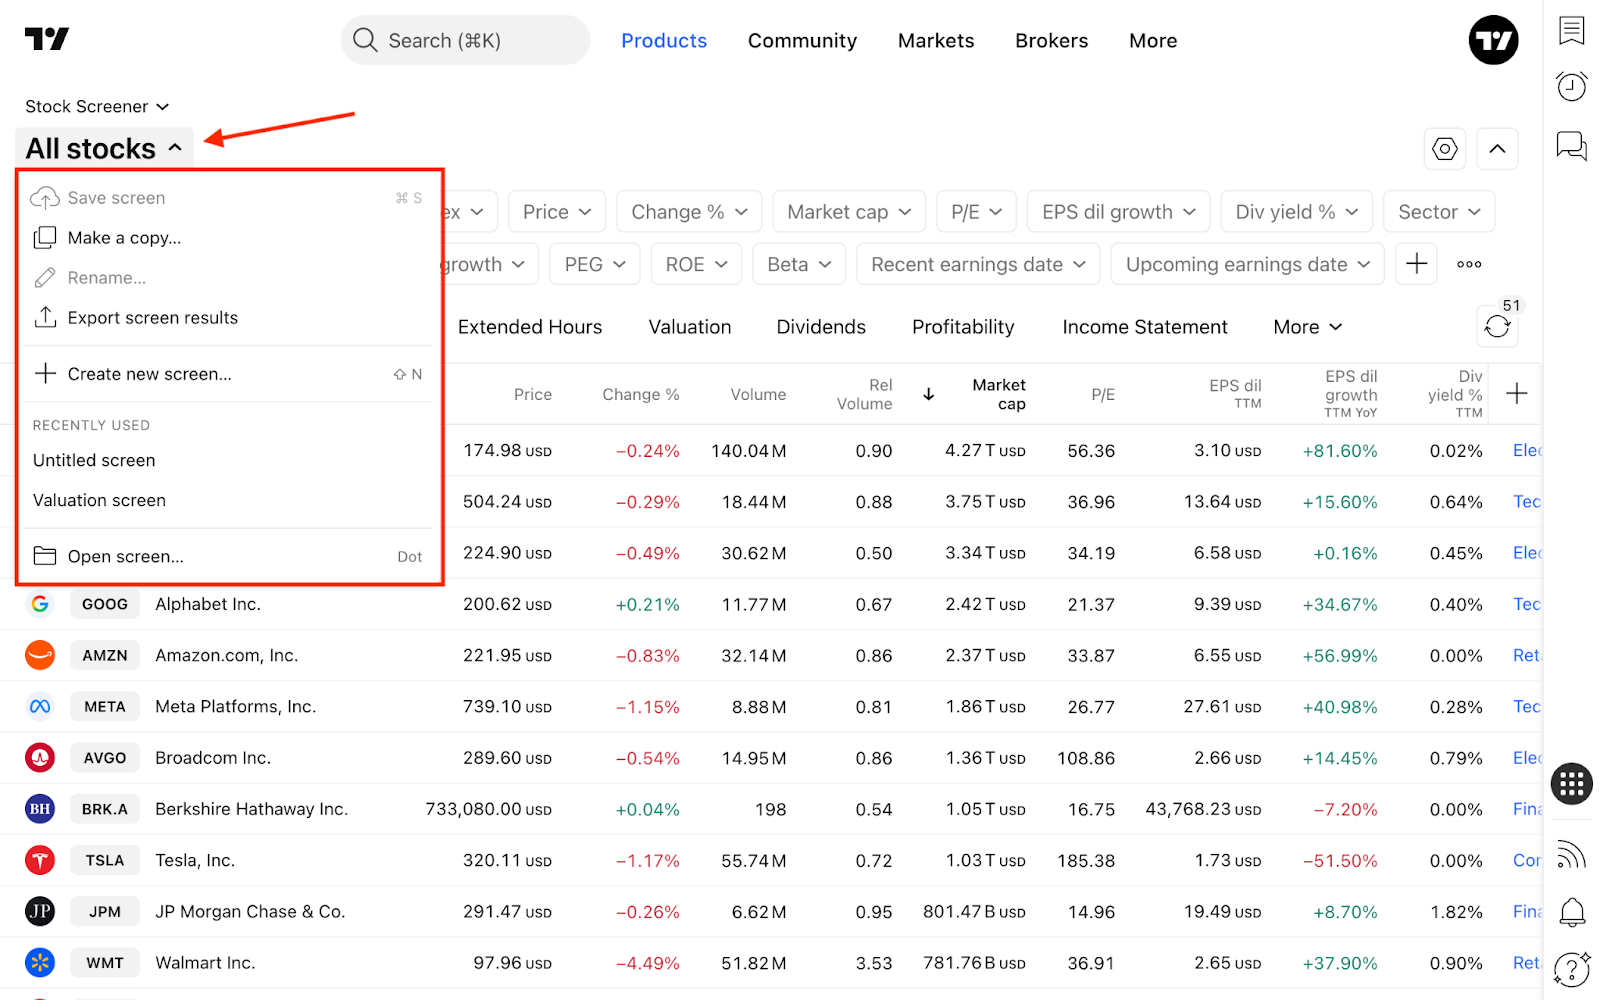
This dropdown also allows you to access recently used screens, export your results as a CSV file, or start a completely new screen.
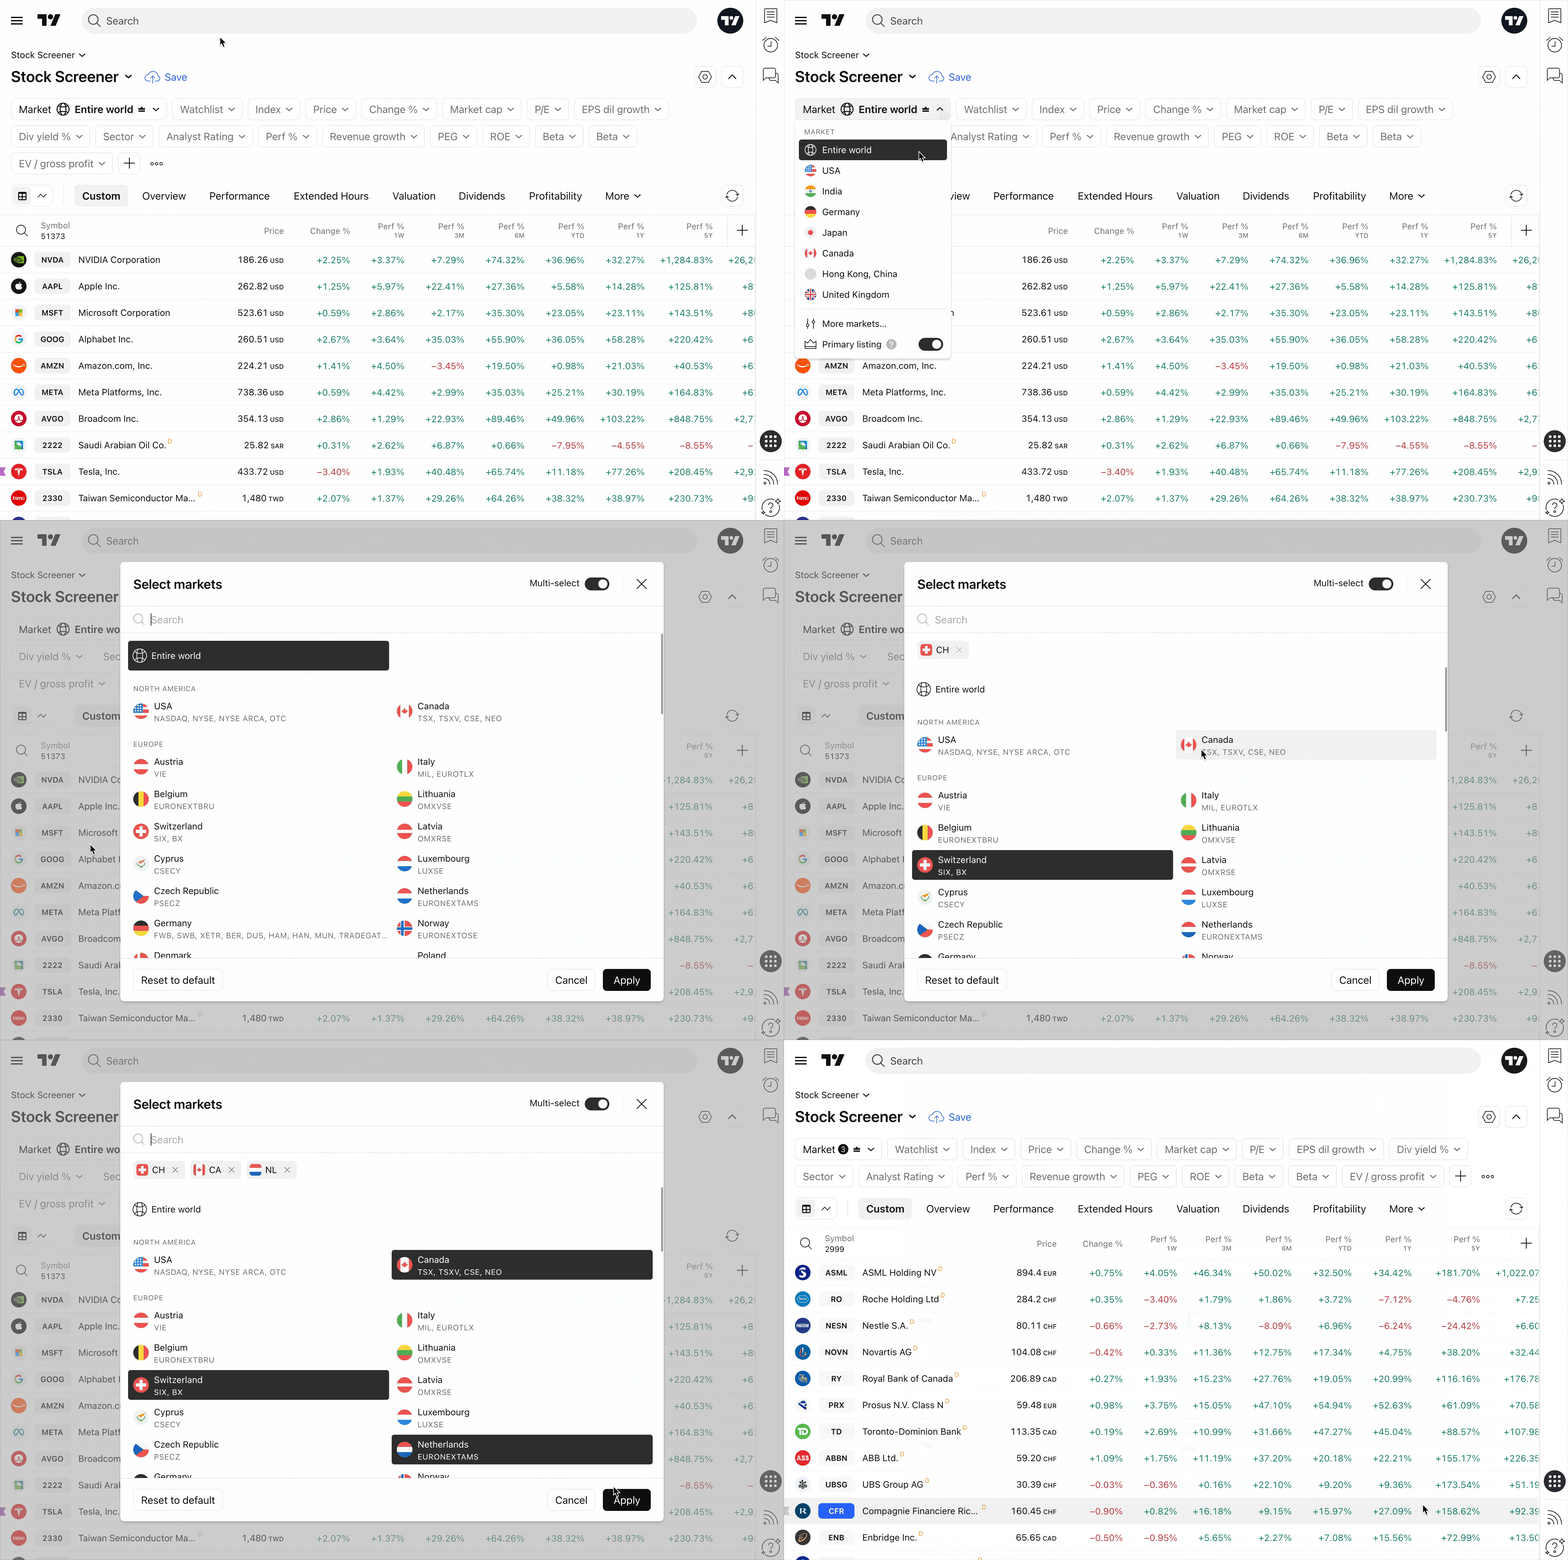
To change your market region, click the currently selected market and choose More markets… From the top-right corner of that menu, you can enable Multi-select to screen two or more regions simultaneously.
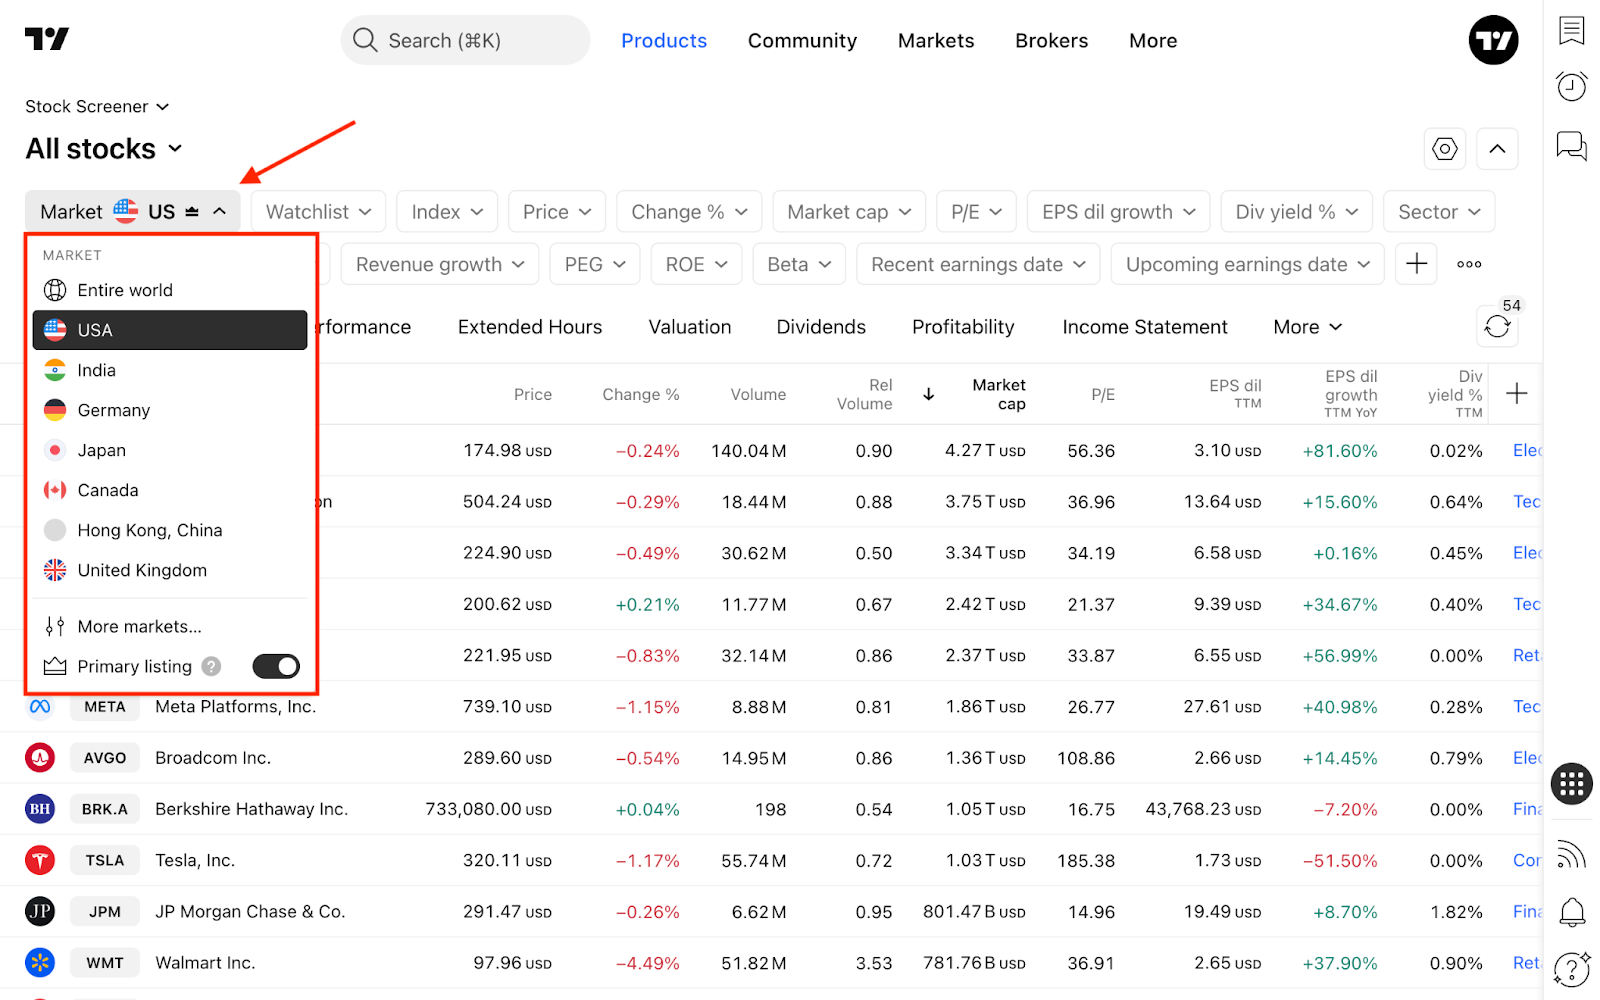
Consider toggling the Primary listing option. This ensures you only see stocks from their main exchange, keeping your workspace free of duplicate listings from secondary exchanges (though you can disable this depending on your analytical needs).
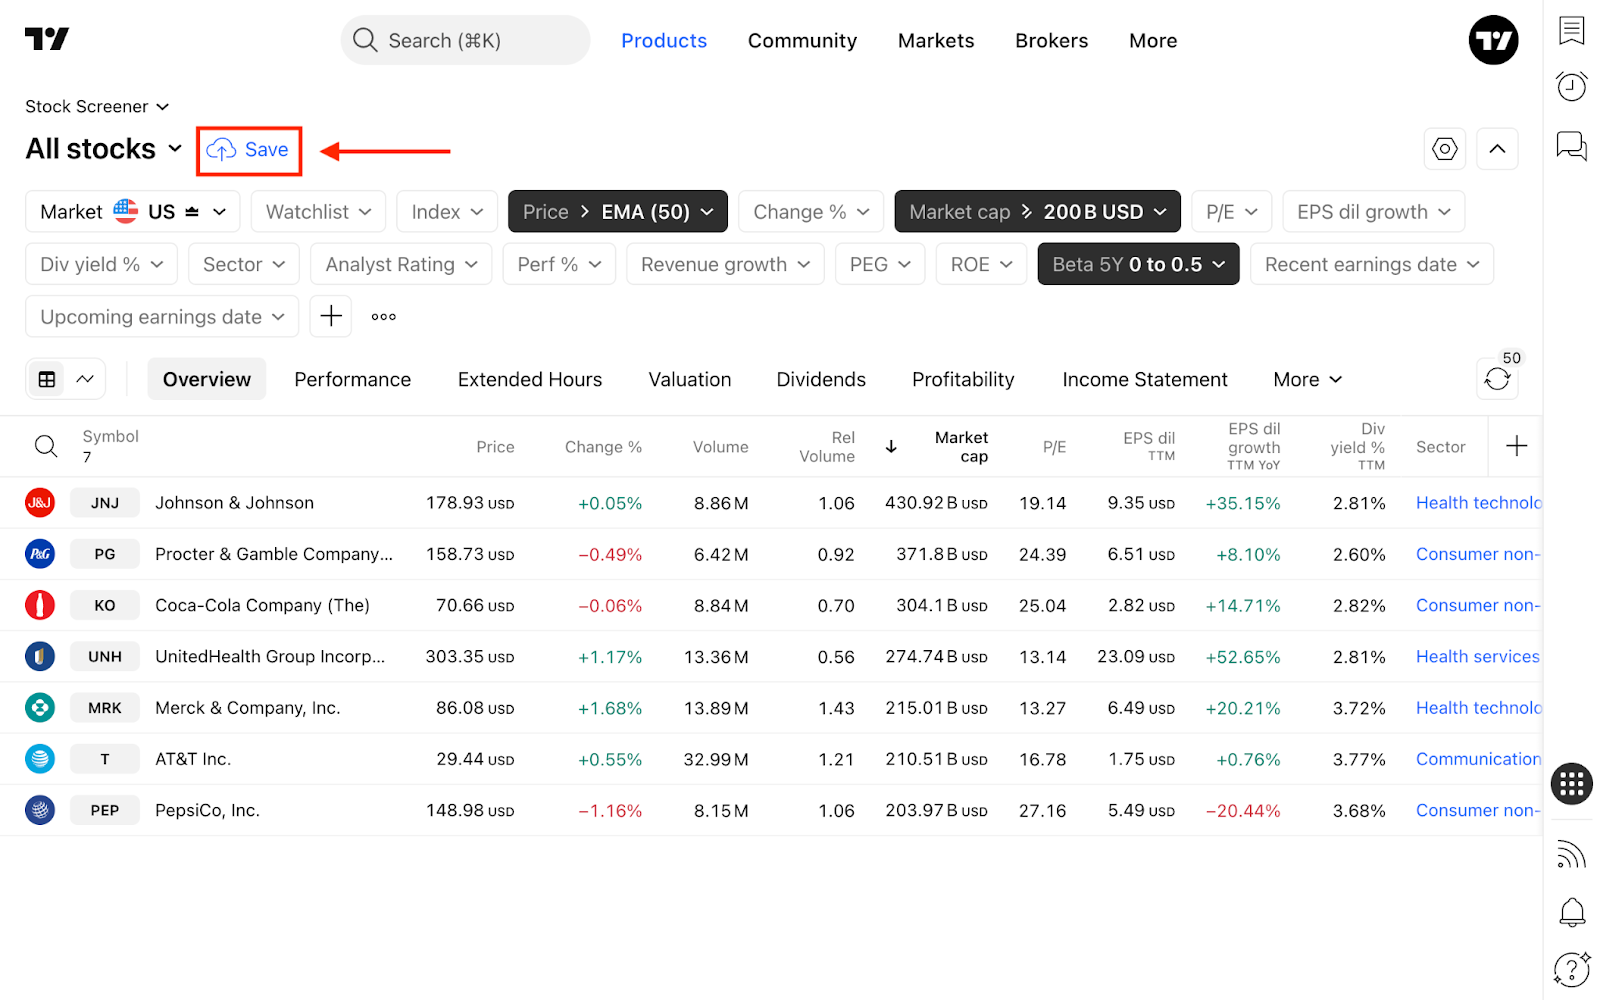
Creating a personalized screen is simple: configure your desired filters, click the blue Save button that appears, and give it a name.
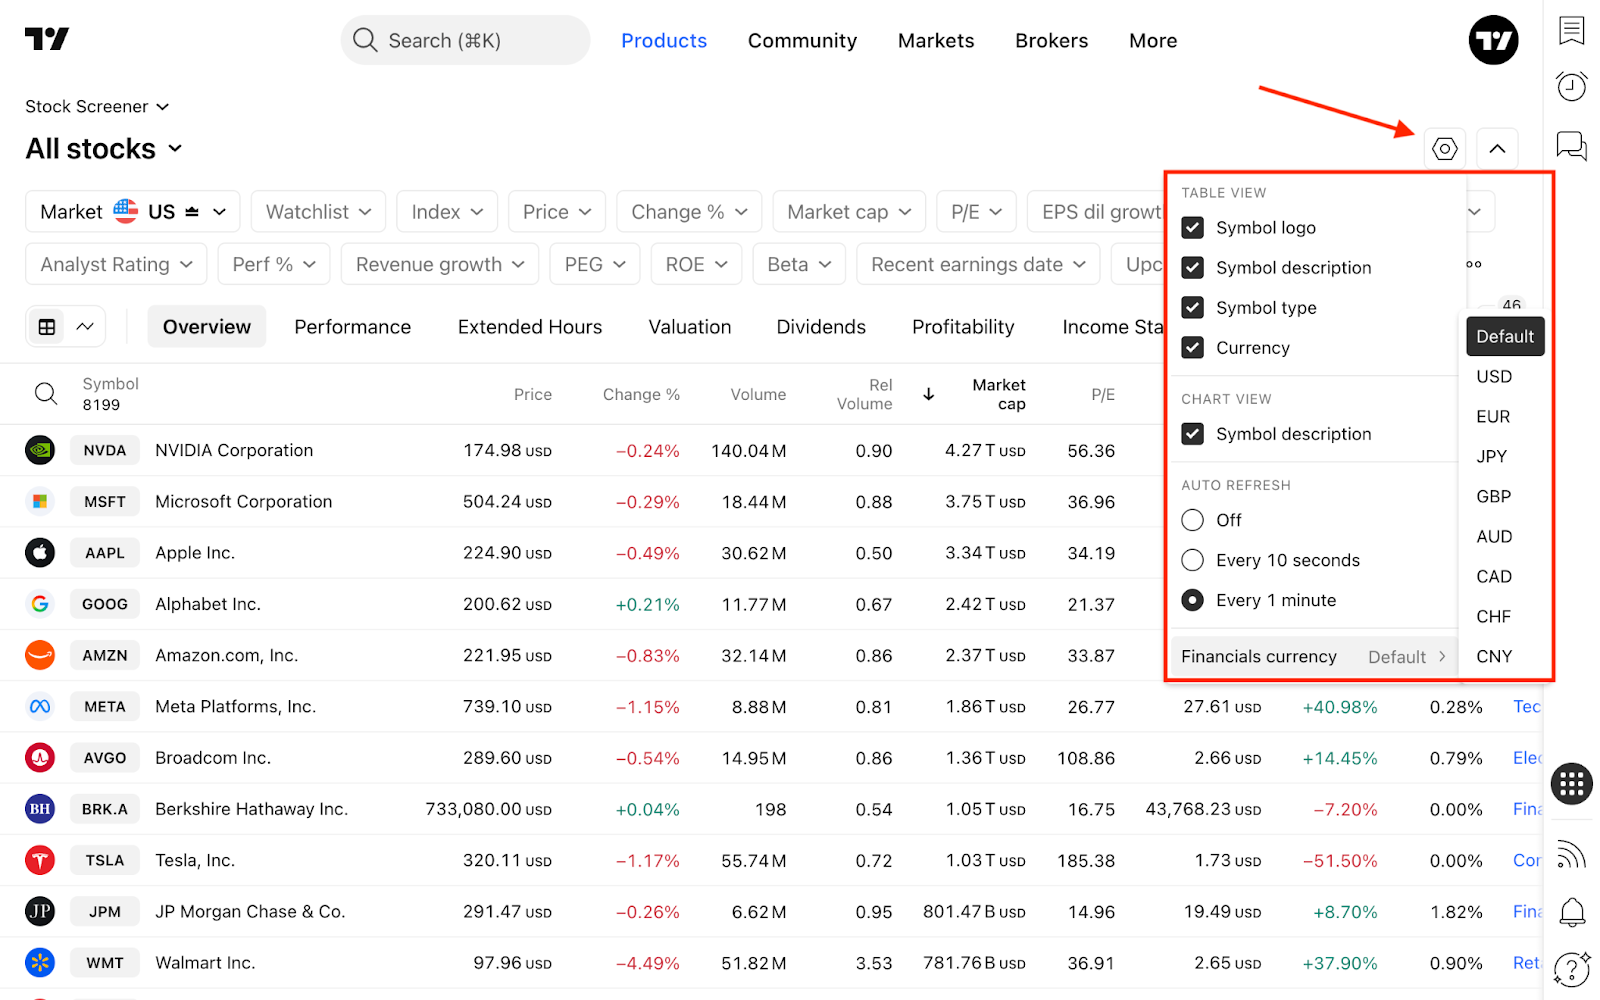
On the right side, you'll find the Screener settings. Here, you can customize the display (toggling symbol logos, descriptions, types, and currencies) and set the auto-refresh rate. You can also select your preferred base currency (USD, EUR, JPY, GBP, etc.) for financial metrics like market cap or diluted EPS.
Once your screener is perfectly configured, click the Hide filters button to collapse the top panel, giving you more screen space to analyze the results.
Filters
The Stock Screener offers a vast selection of metrics that can be applied as filters and added to your data columns. To do this, open the filter editing dialog and select your exact conditions.
To add new filter conditions, click the + button or press Shift + F.
- Security info: Key listing details, such as country, sector, exchange, issuer, and target price.
- Market data: Core trading metrics, including price, volume, turnover, beta, and gaps.
- Technicals: Studies and signals like moving averages, crossovers, oscillators, volatility bands, volume indicators, and popular candlestick patterns.
- Financials: Statement-driven metrics (P&L, Balance Sheet, Cash Flow) with period selectors for TTM, quarterly, semiannual, and annual data, plus per-share metrics.
- Dividends: Regular and special dividend data, including ex-dates, pay dates, yields, payout ratios, and continuous payout history.
- Valuation: Relative multiples and size metrics, such as P/E, EV/EBITDA, P/B, PEG, market cap, and enterprise value.
- Growth: Rates of change across key lines, including revenue, EPS, EBITDA, and FCF growth.
- Margins and ratios: Profitability and risk metrics, such as gross/operating/net margins, ROE, ROIC, and leverage.
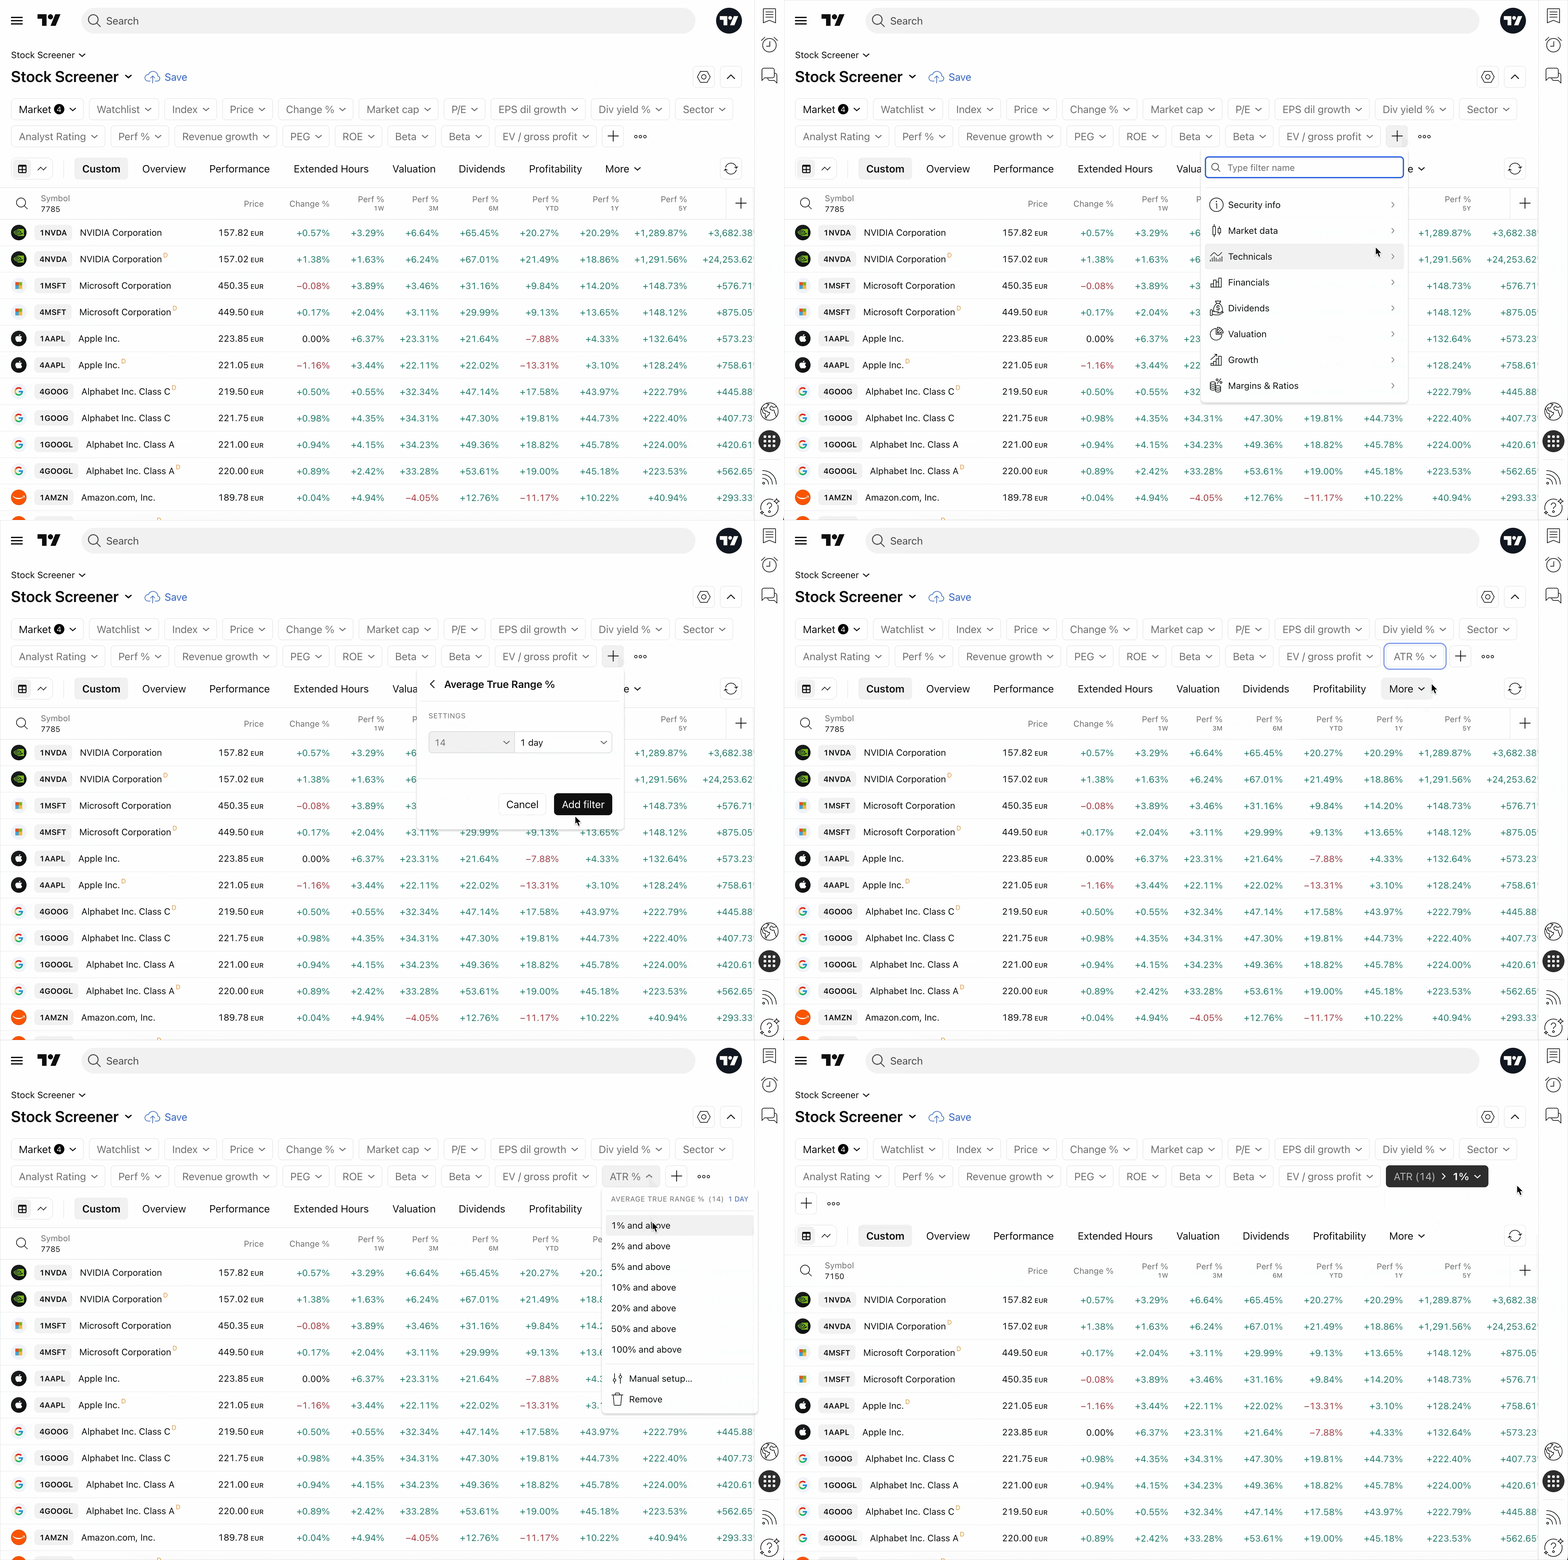
Beyond fundamentals, you can screen stocks using dozens of technical indicators. Many of these — like RSI, Momentum, EMA, SMA, and Keltner Channels — offer expanded parameters for deep customization.

Column sets
Below the filters, you will find column sets. Each set groups information tailored to a specific type of analysis or financial statement. You can always add a new column set using the + button on the right.
If a set includes the metric you want, but you need a different time period, simply click the column header, select Column settings, and adjust the interval.
Here is a breakdown of the default column configurations:
- Overview: A quick snapshot of price action, liquidity, size, and core earnings. Use it to check market cap, run a fast valuation check with P/E, or spot unusual activity via Relative Volume.
- Performance: Multi-horizon returns to gauge momentum and trend persistence. Ideal for ranking leaders and laggards or spotting breakouts.
- Technicals: Indicator and price-action signals, plus an aggregate technical rating. Useful for ranking setups, checking momentum, and spotting pattern entries without opening charts.
- Extended hours: A pre- and post-market snapshot. Helps you spot gappers before the open and track after-hours reactions to news or earnings.
- Forecasts: Forward-looking metrics to support your investment decisions, including consensus EPS estimates, forward EV/EBITDA, and other predictive ratios.
- Valuation: Relative pricing ratios and scale context (P/E, PEG, EV/EBITDA, P/FCF). Perfect for peer comparisons and spotting undervalued names.
- Dividends: Focuses on income level, sustainability, and growth. Use it to find attractive yields and screen for sustainable payout ratios.
- Profitability: Metrics covering business efficiency and returns on capital (ROIC, ROE, margins) to identify high-quality companies.
- Income statement: A PnL view of operating performance, including revenue, EBITDA, and diluted EPS. Great for assessing growth and earnings momentum.
- Balance sheet: A snapshot of resources, obligations, and liquidity. Helps gauge leverage, track cash-to-debt ratios, and identify balance-sheet strength.
- Cash flow: Tracks how companies generate and spend cash (operating, investing, financing, and free cash flow). Use it to find strong cash generators and assess dividend sustainability.
- Per share: Fundamentals normalized per share for clean comparisons regardless of company size (EPS, book value per share).
Oh, and one more Screener feature…
To the left of the column sets, you will find the Chart view and Table view toggle buttons. These allow you to instantly switch between the standard data grid and a visual grid of symbol charts. You can adjust the intervals, choose your preferred chart type (bars, candles, or lines), and visually navigate through your screened stocks with ease.
Also read: