Heatmap view mode
Heatmap view is a way to look at your screener results, alongside Table view and Chart view. It is available in the Stock, ETF, and Crypto Coins Screeners. The CEX and DEX Screeners offer Table and Chart views only.
In Heatmap view, every symbol your screen returns becomes a tile. Tile size shows scale, color shows performance, and grouping puts both in context, so you can spot leaders, laggards, and trends across hundreds of symbols at a glance.
To switch between these three modes, click Table view, Chart view, or Heatmap view in the top-left corner of the screener:
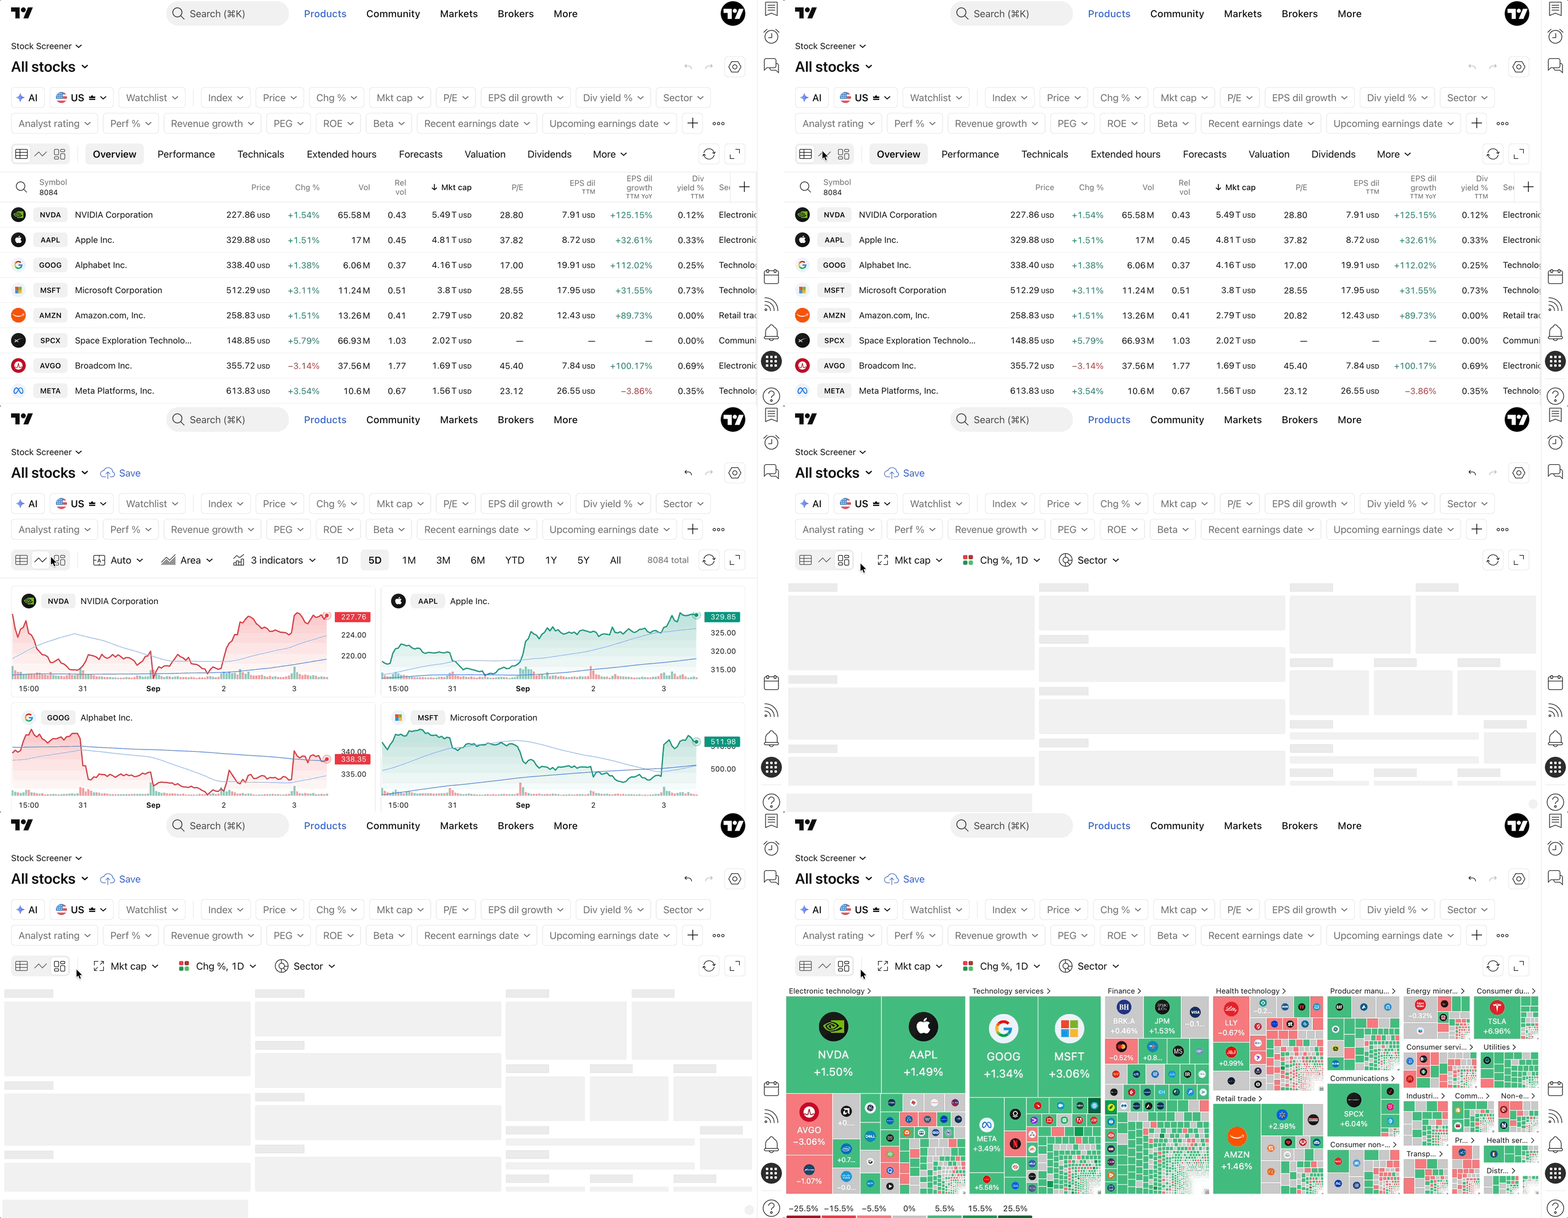
Switching between views does not change your filters or your set of symbols. The heatmap shows exactly what your screen returned: it adds no symbols and applies no filtering of its own.
Heatmap view mode in screener vs standalone heatmaps
The standalone Stock, ETF, and Crypto Coins Heatmaps in the Products menu work with predefined datasets. The heatmap in the Screener is built from your own selection instead: use any combination of Screener filters to define the universe, then switch to Heatmap view.
Heatmap view mode settings
Three dropdowns above the heatmap control what the tiles represent: Size by, Color by, and Group by. The options are the ones you know from the standalone Heatmap, matched to the screener you are using.
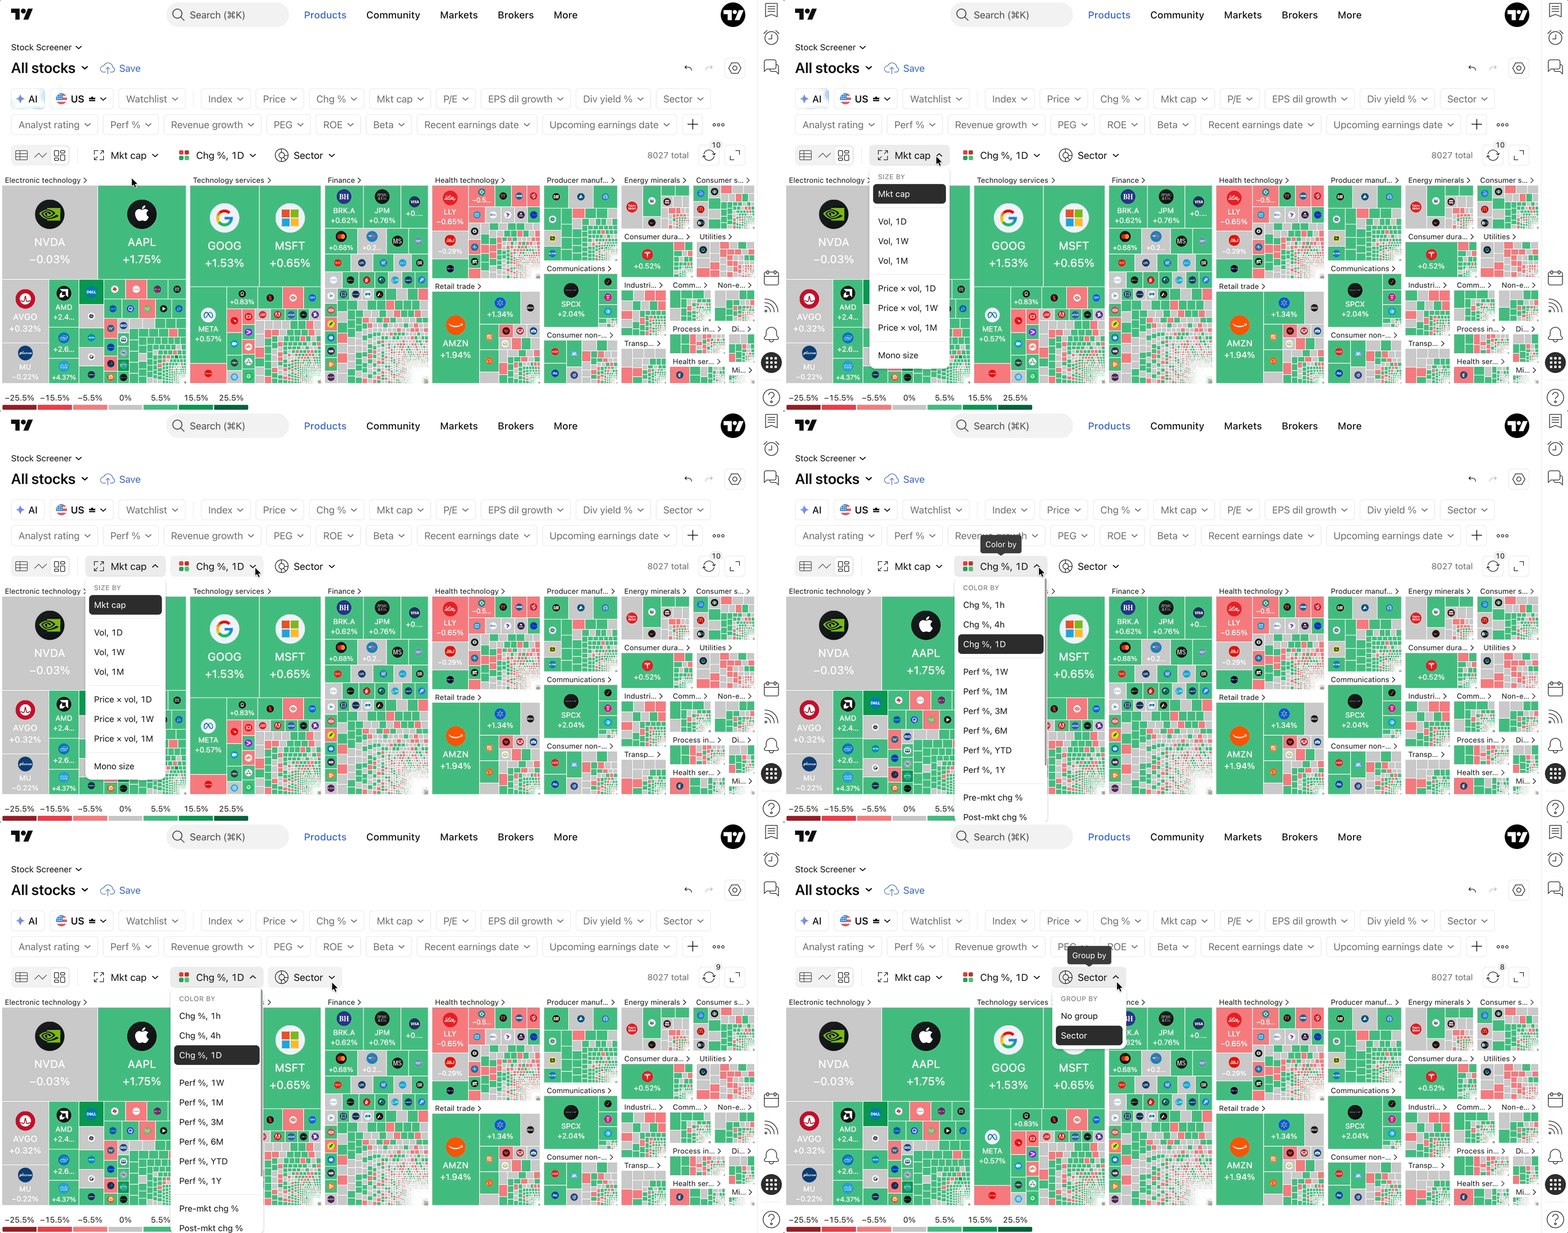
Size by
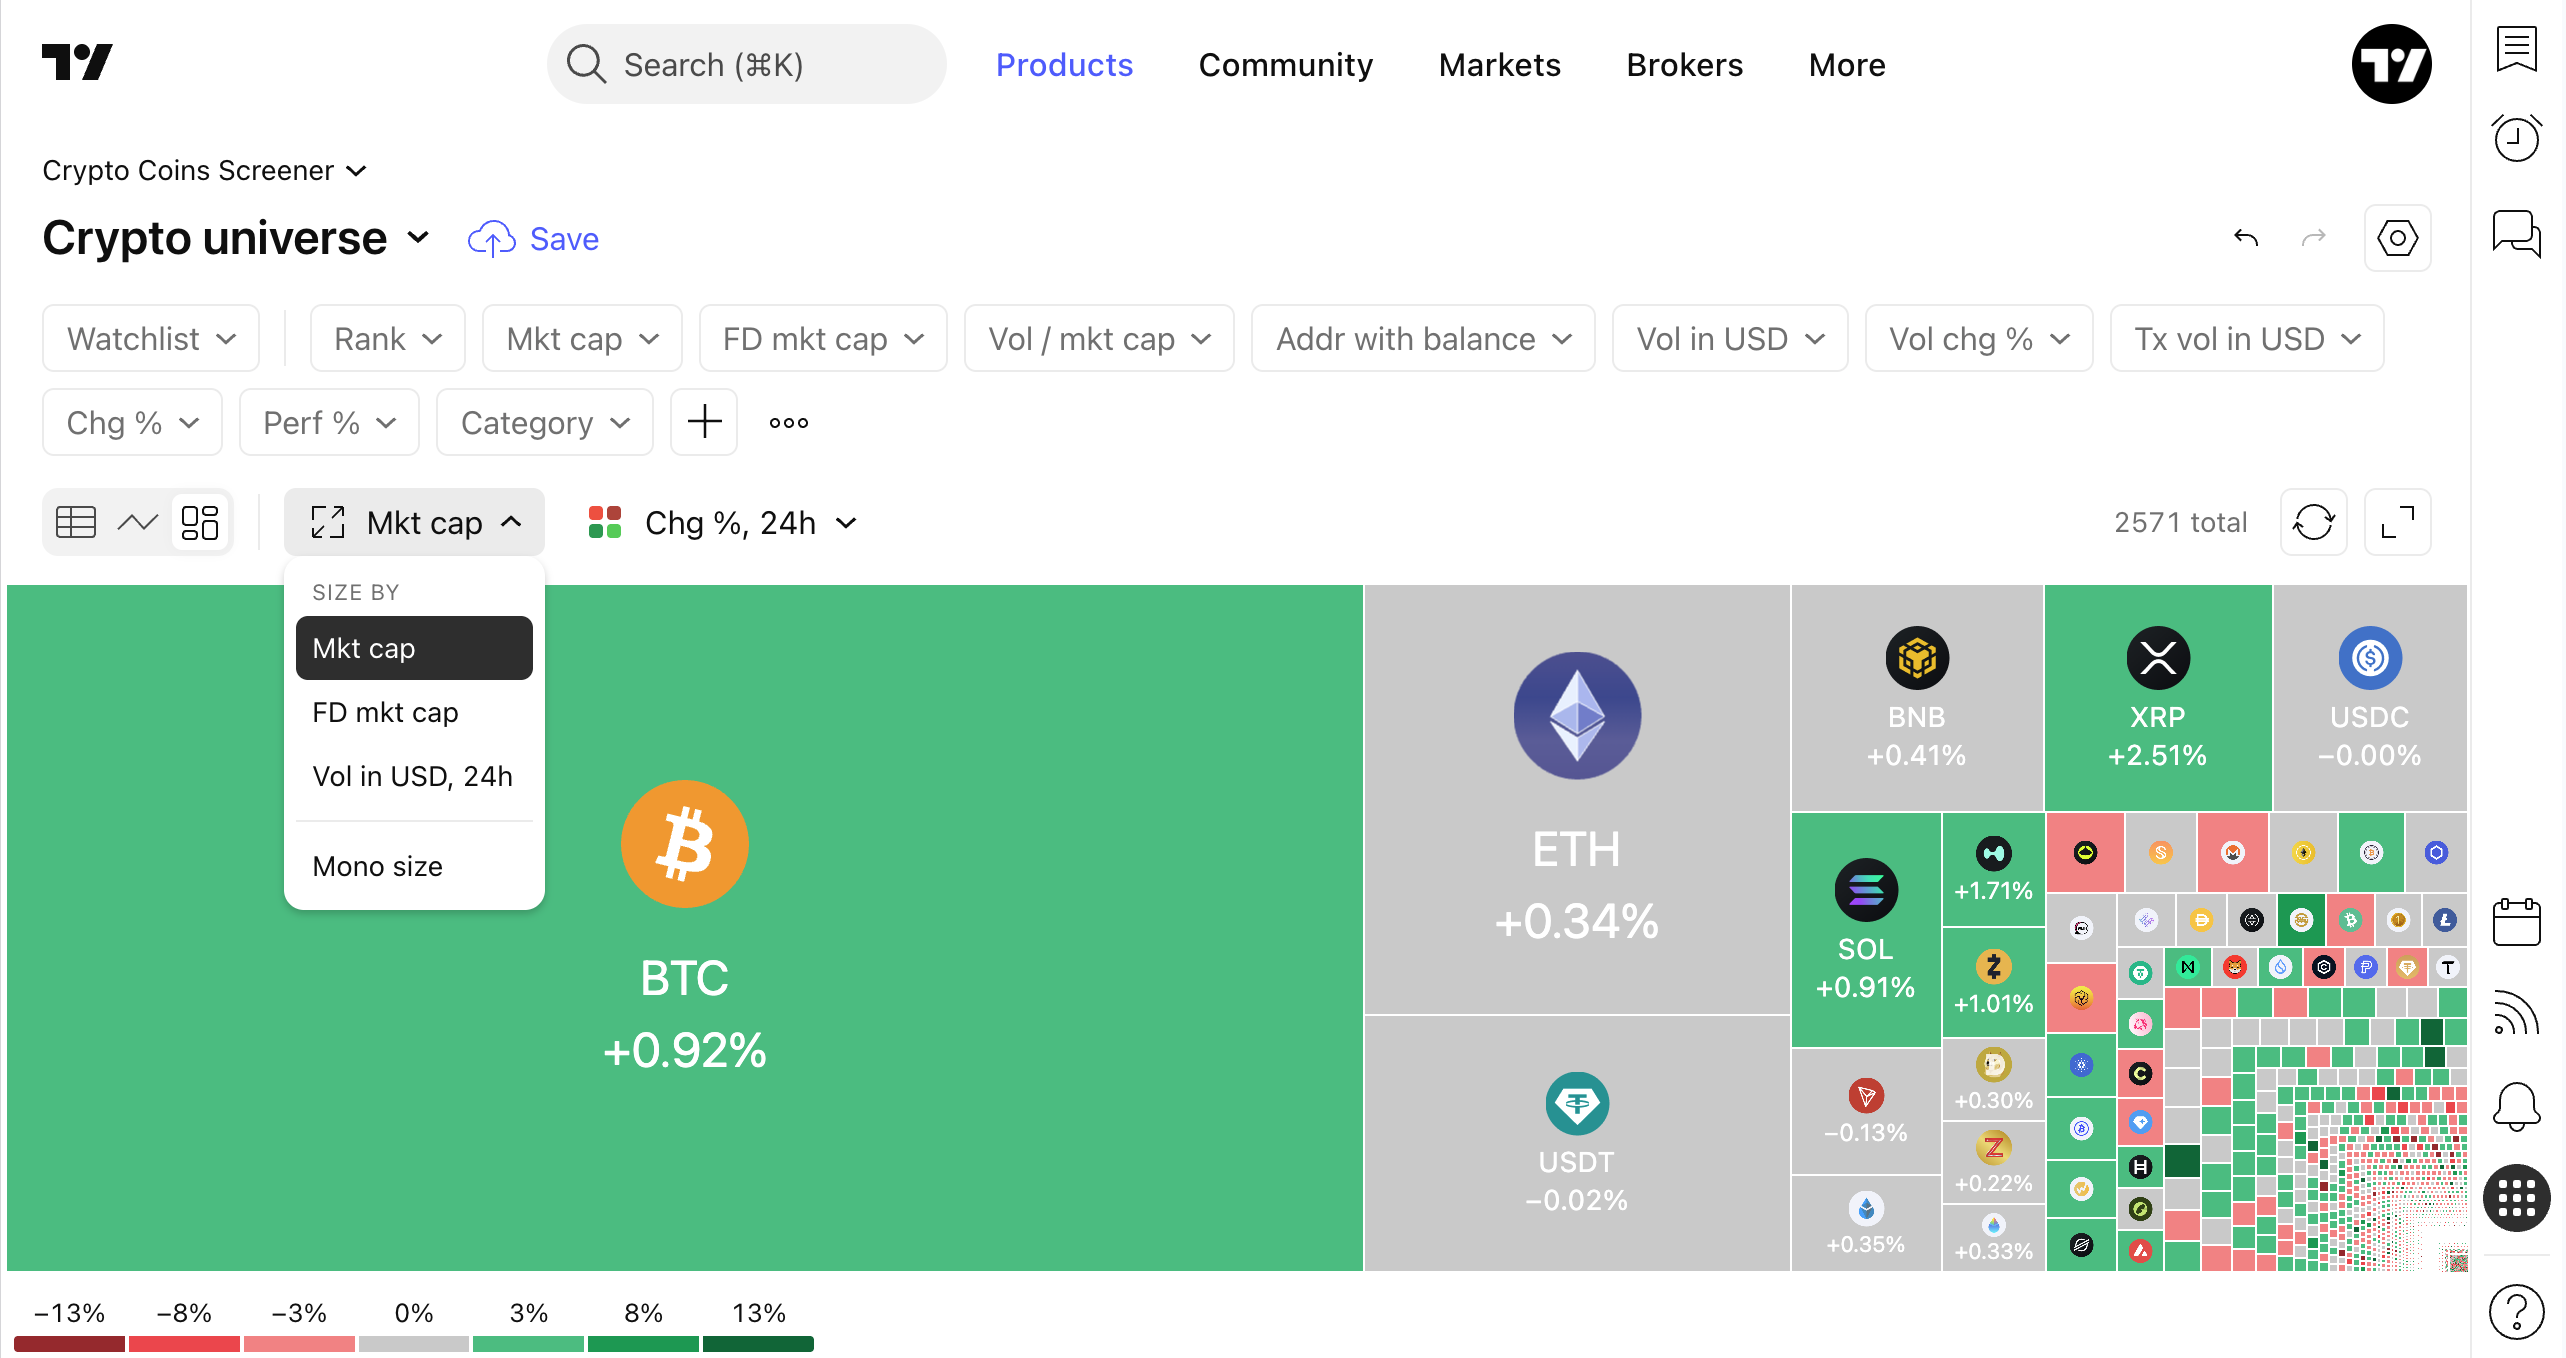
Size by sets the area of a tile: the higher the value of the selected metric, the bigger the tile.
In the Stock Screener you can size tiles by market cap, by volume over 1D, 1W, or 1M, or by turnover (price × volume) over the same periods.
Choose Mono size to give every tile the same size and compare symbols by color alone; Size by then only sets the sort order.
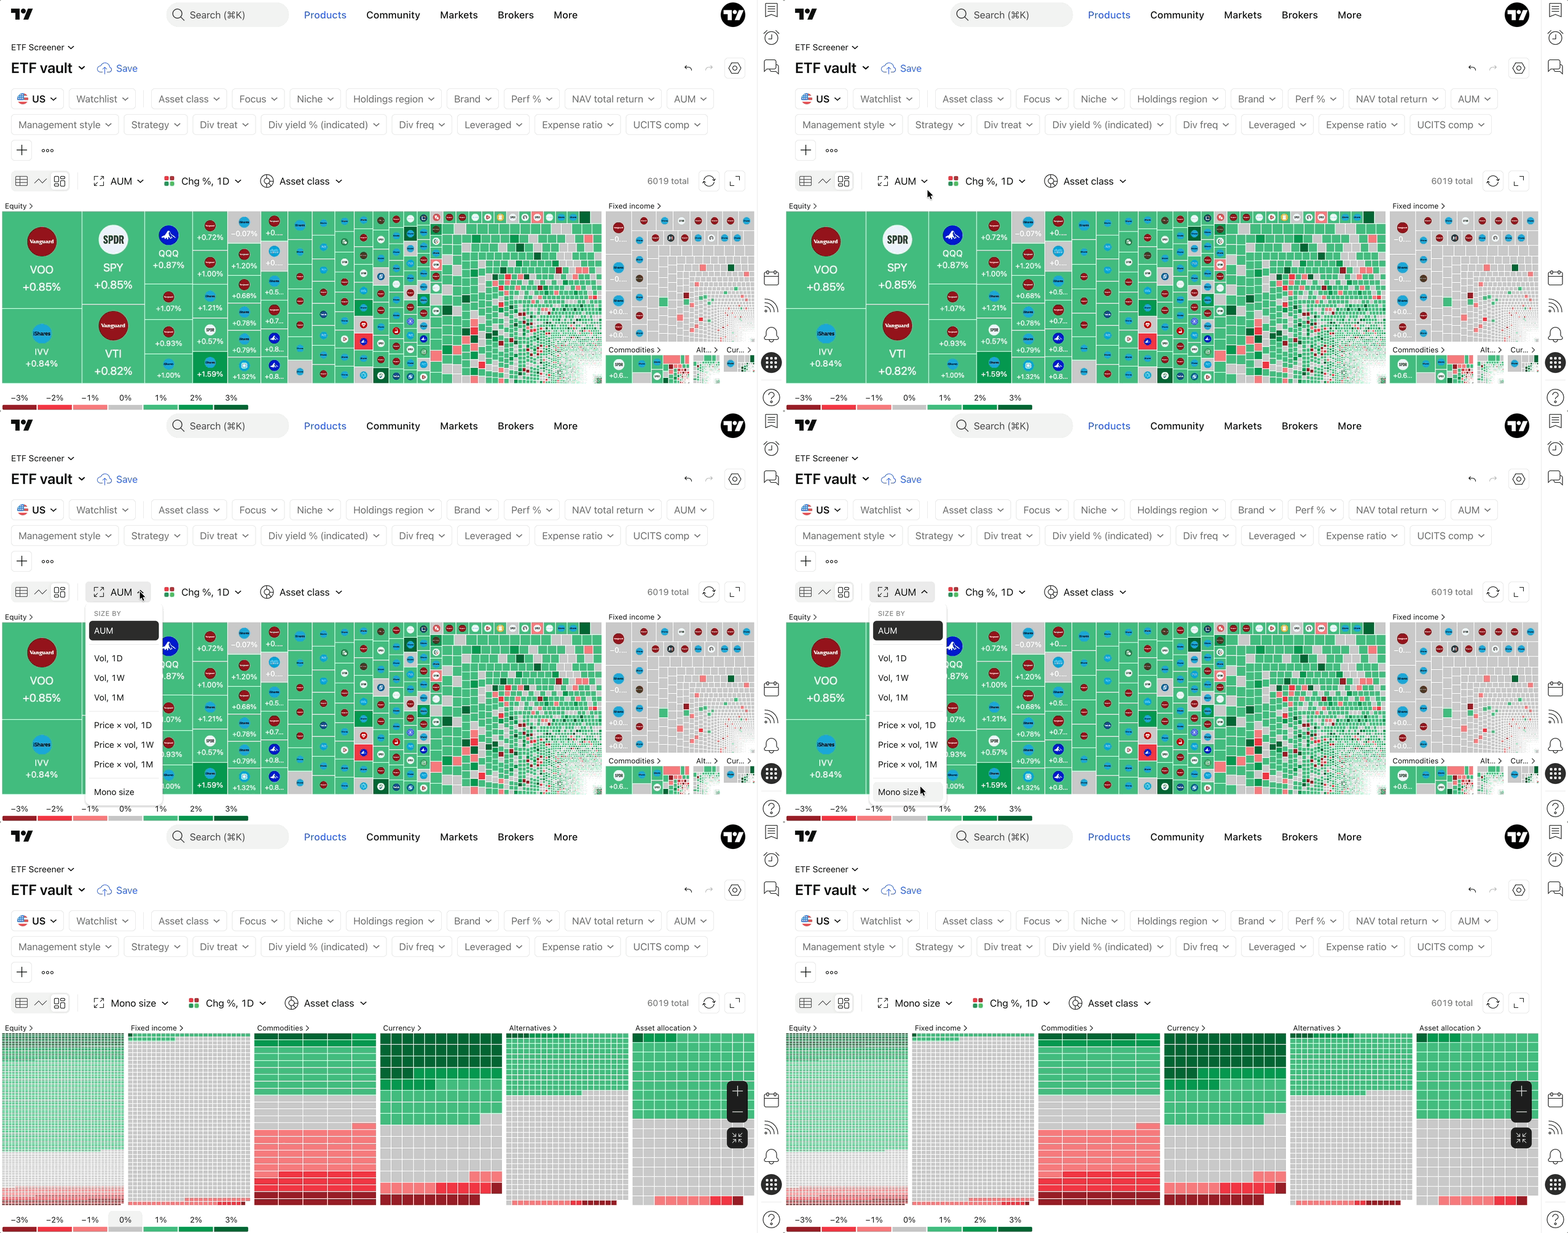
The default and the exact list adapt to what you're screening: the ETF Screener uses AUM instead of market cap in Stock Screener:
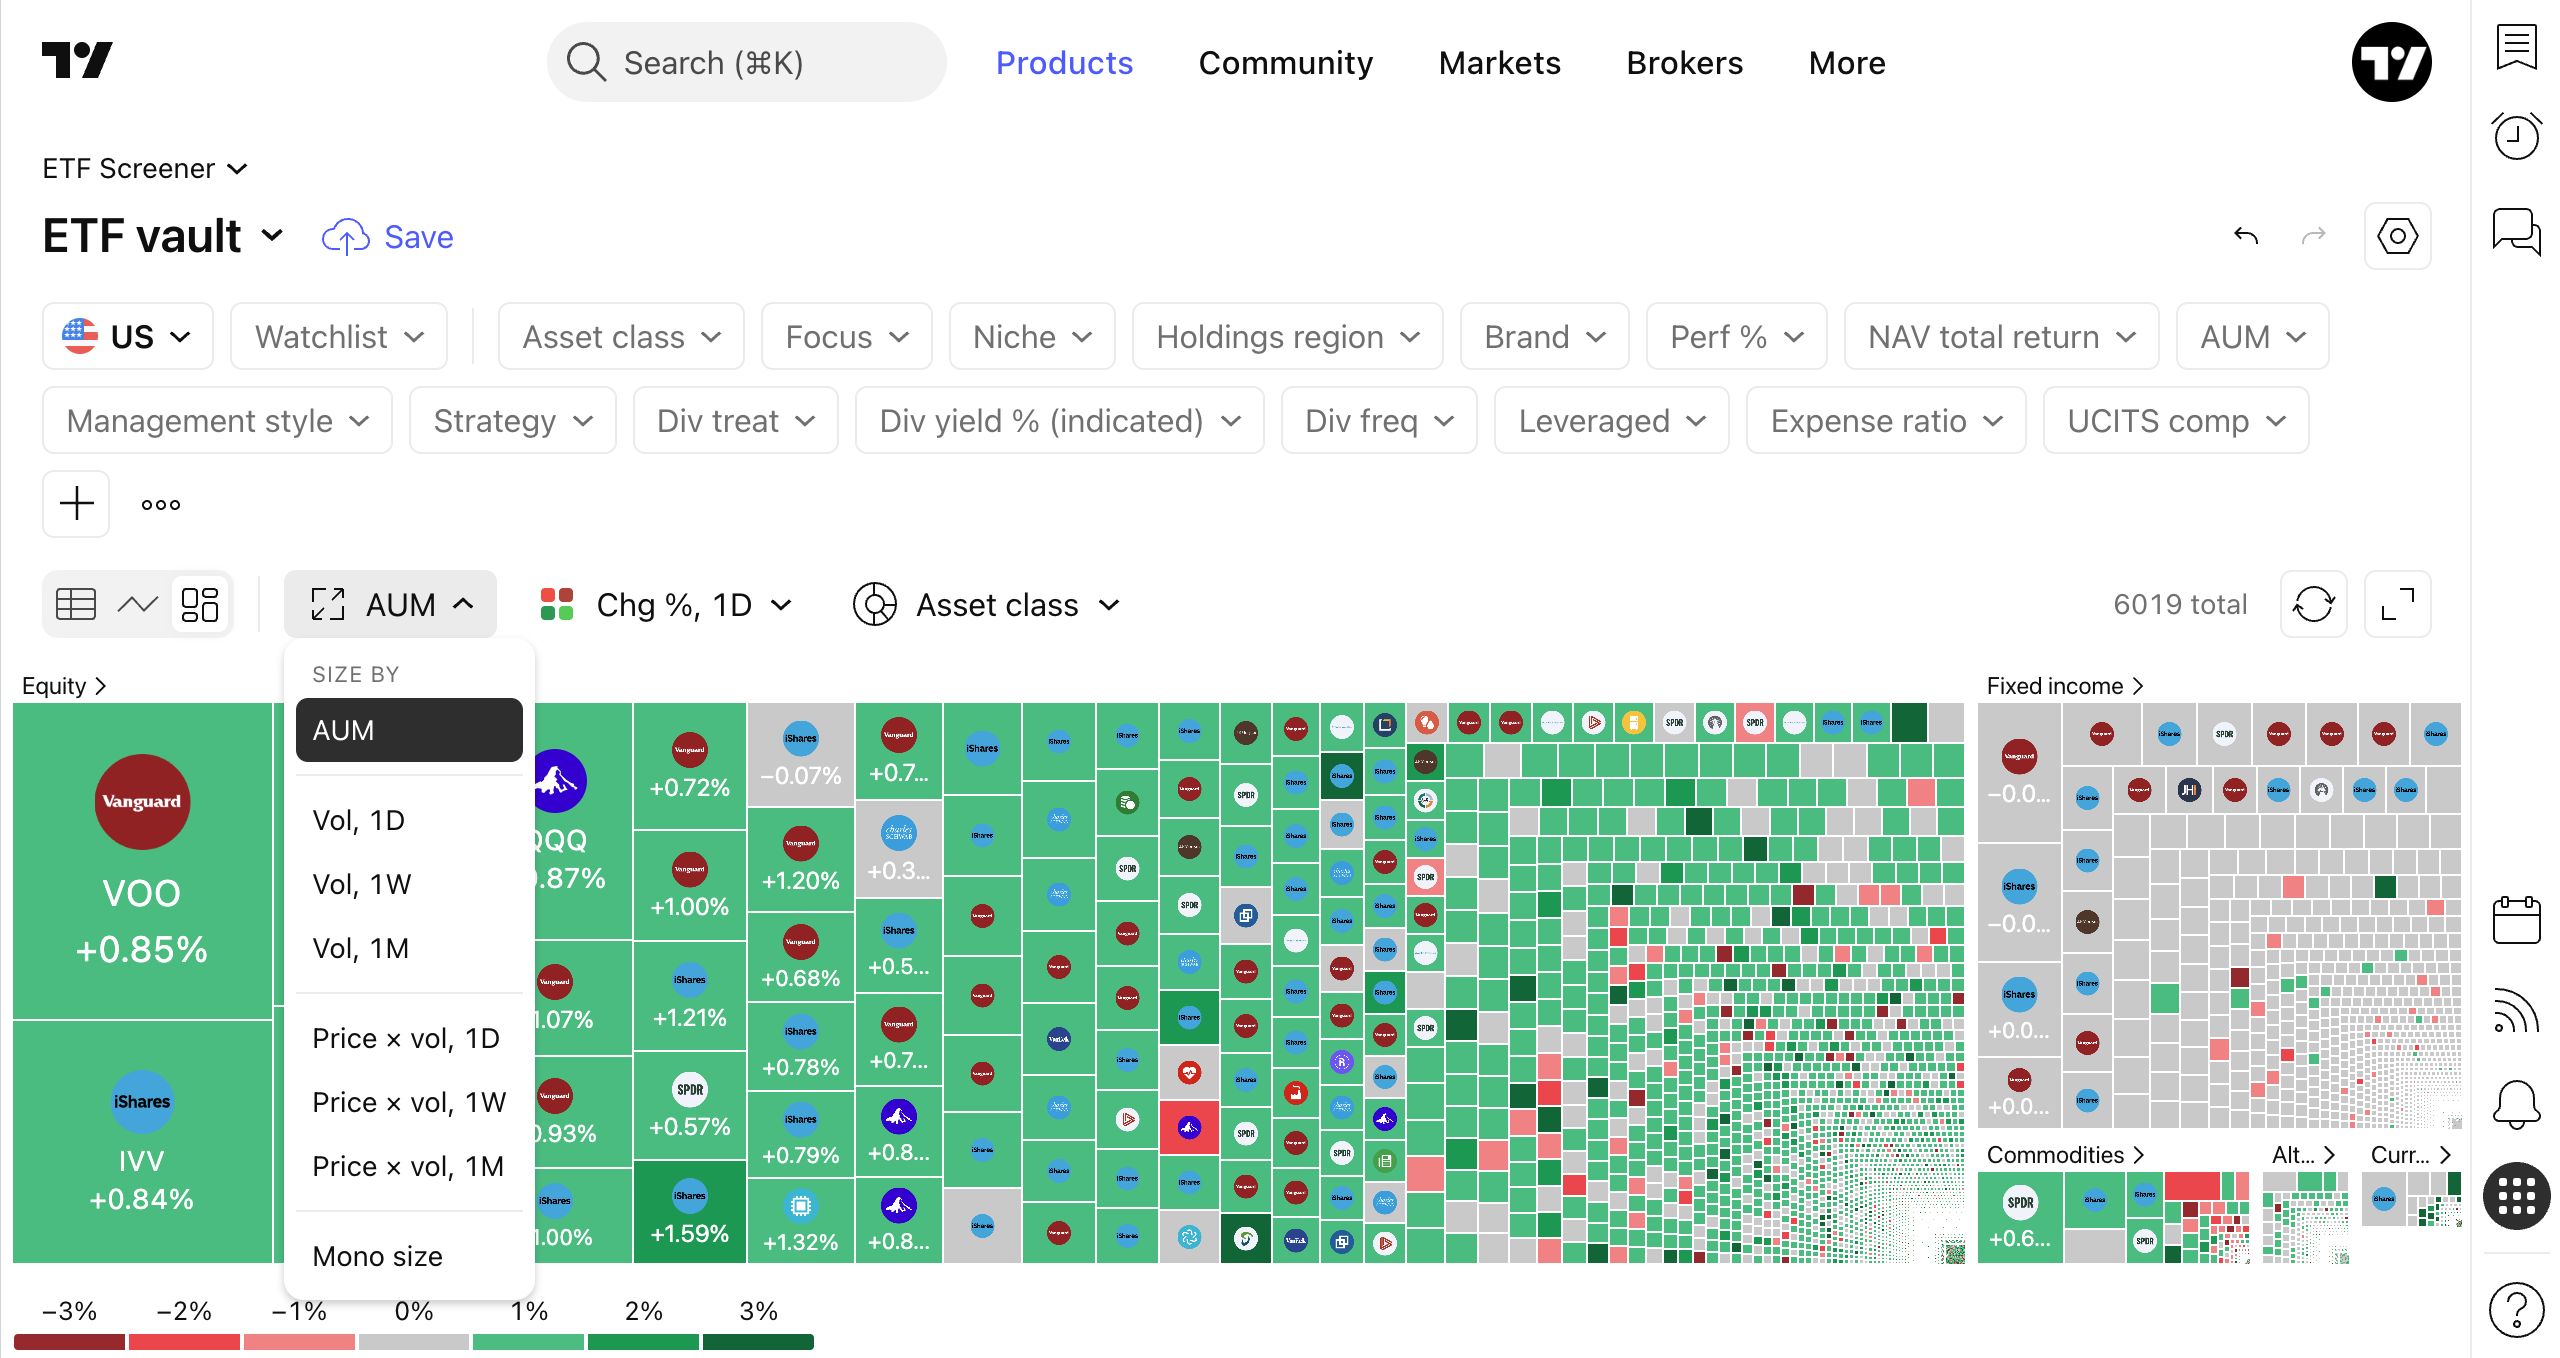
Crypto Coins Screener adds fully diluted market cap and 24h volume in USD.
Color by
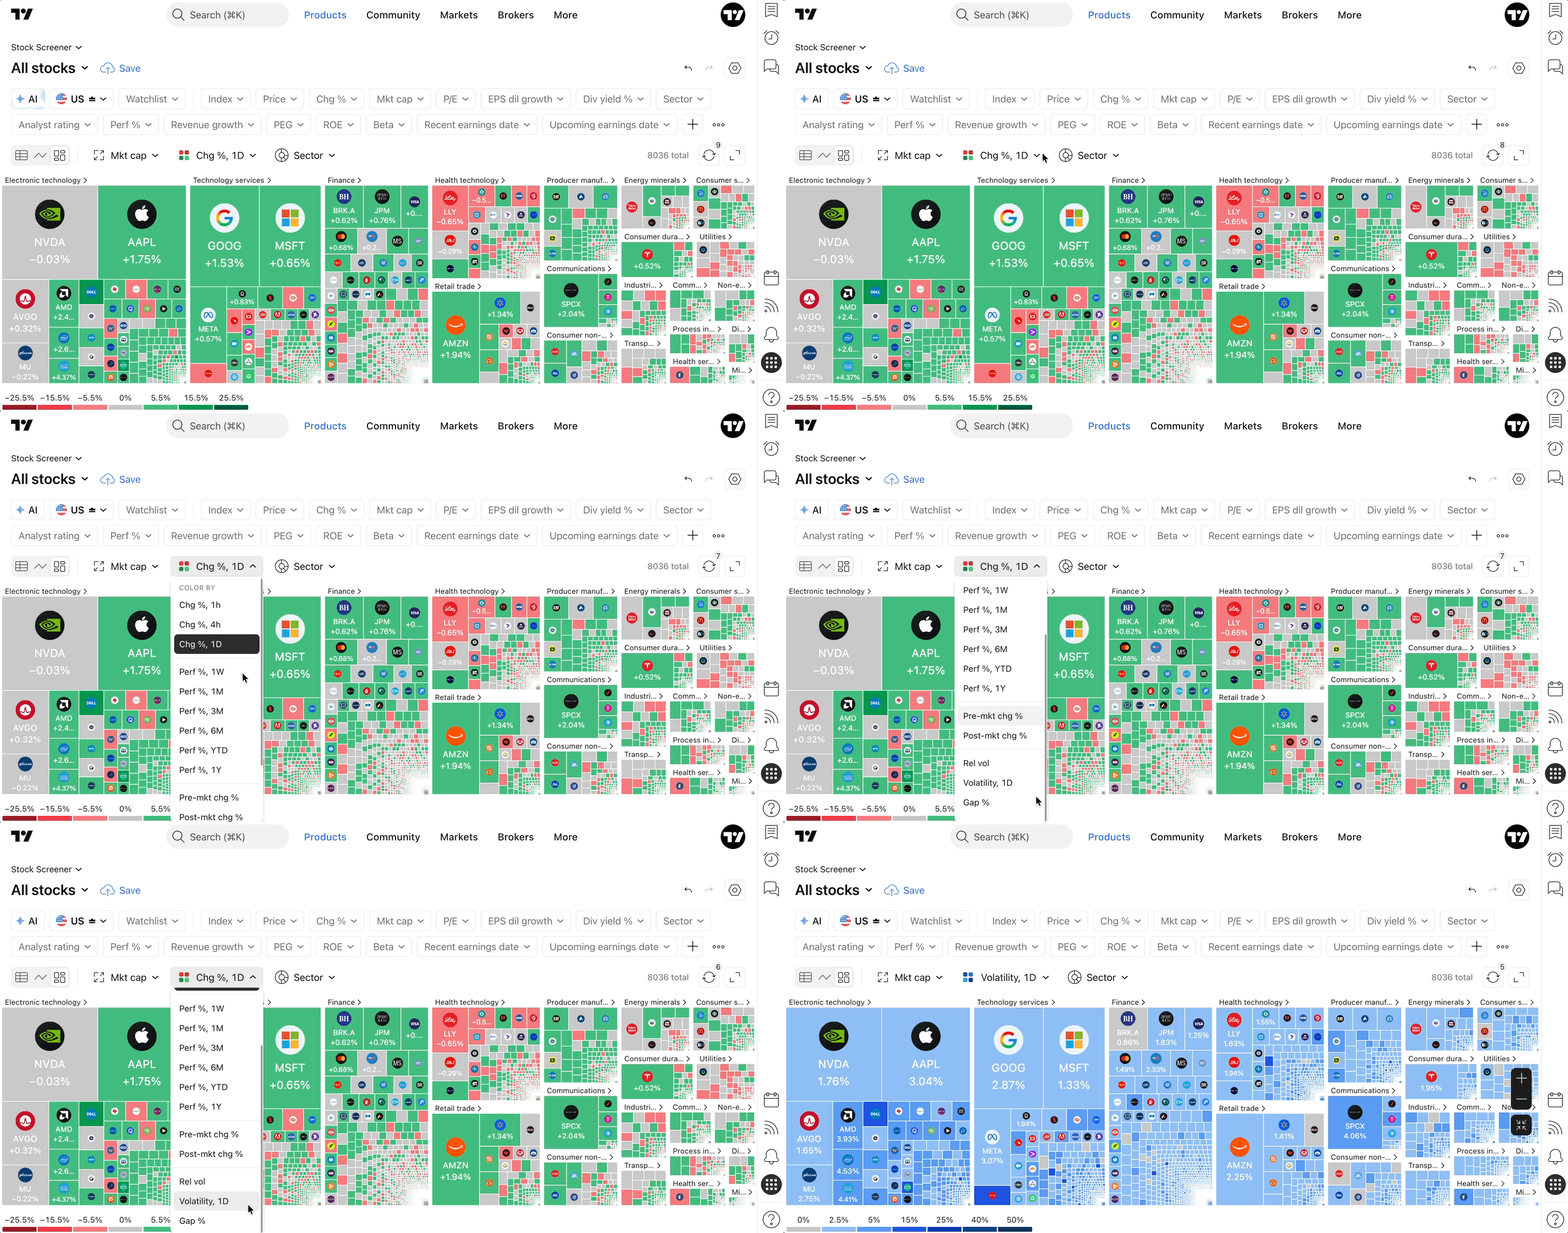
Color by sets what a tile's color represents. Green tiles are gaining, red tiles are falling, grey tiles are close to flat, and the stronger the move, the deeper the color. The default is 1D change for stocks and ETFs and 24h change for crypto coins.
You can also color tiles by:
- Change over 1h or 4h.
- Performance over 1W, 1M, 3M, 6M, YTD, or 1Y.
- Gap.
- Volatility.
- Pre-market change, post-market change, and relative volume (stocks and ETFs only).
- NAV total return, Top 10 and Top 25 weight, and beta (ETFs only).
- 24h volume, 24h volume change, open interest, and 24h liquidations (crypto coins only).
Metrics that can only move in one direction, such as relative volume and volatility, use a single-color intensity scale instead of red and green:
Group by
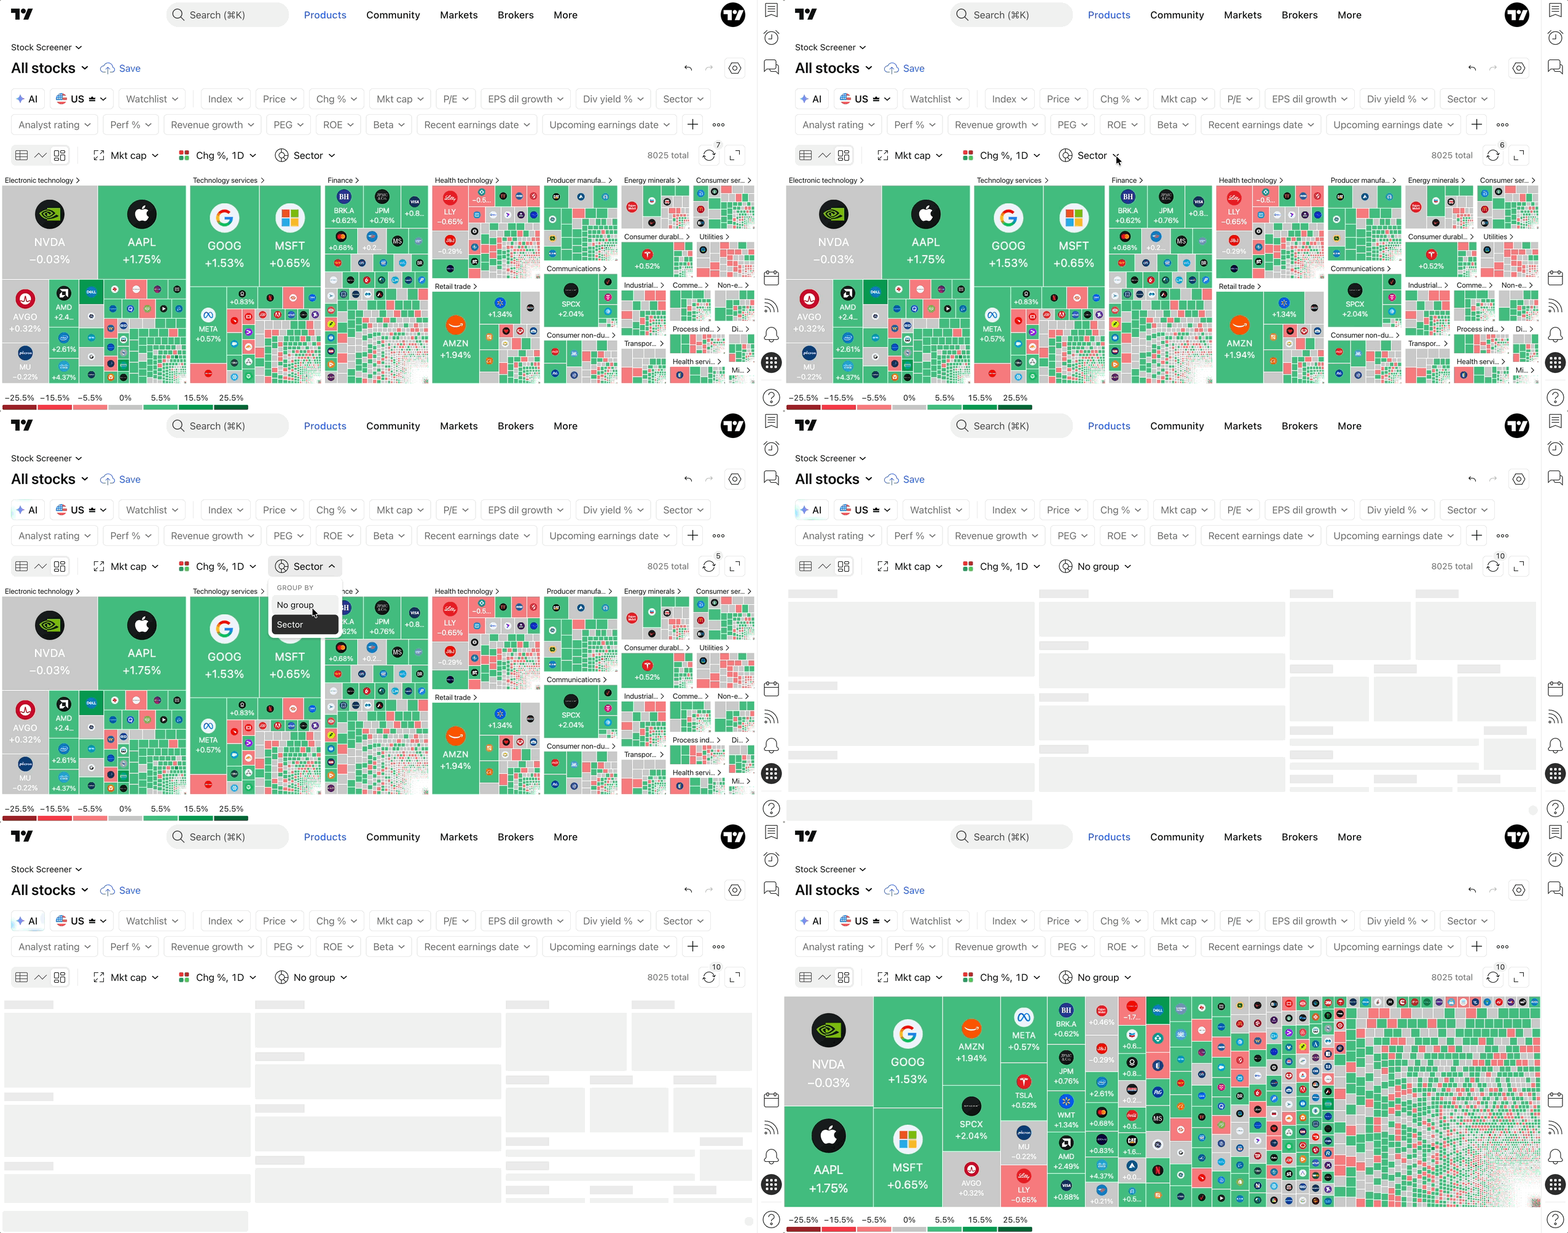
Group by controls how tiles are arranged on the heatmap:
- Sector (default for stocks).
- No group: Displays all symbols in a single flat layout, ignoring sectors.
ETF heatmaps group by Asset class instead of Sector; Crypto Coins heatmaps display all coins on a single level, with no grouping option.
Display style settings
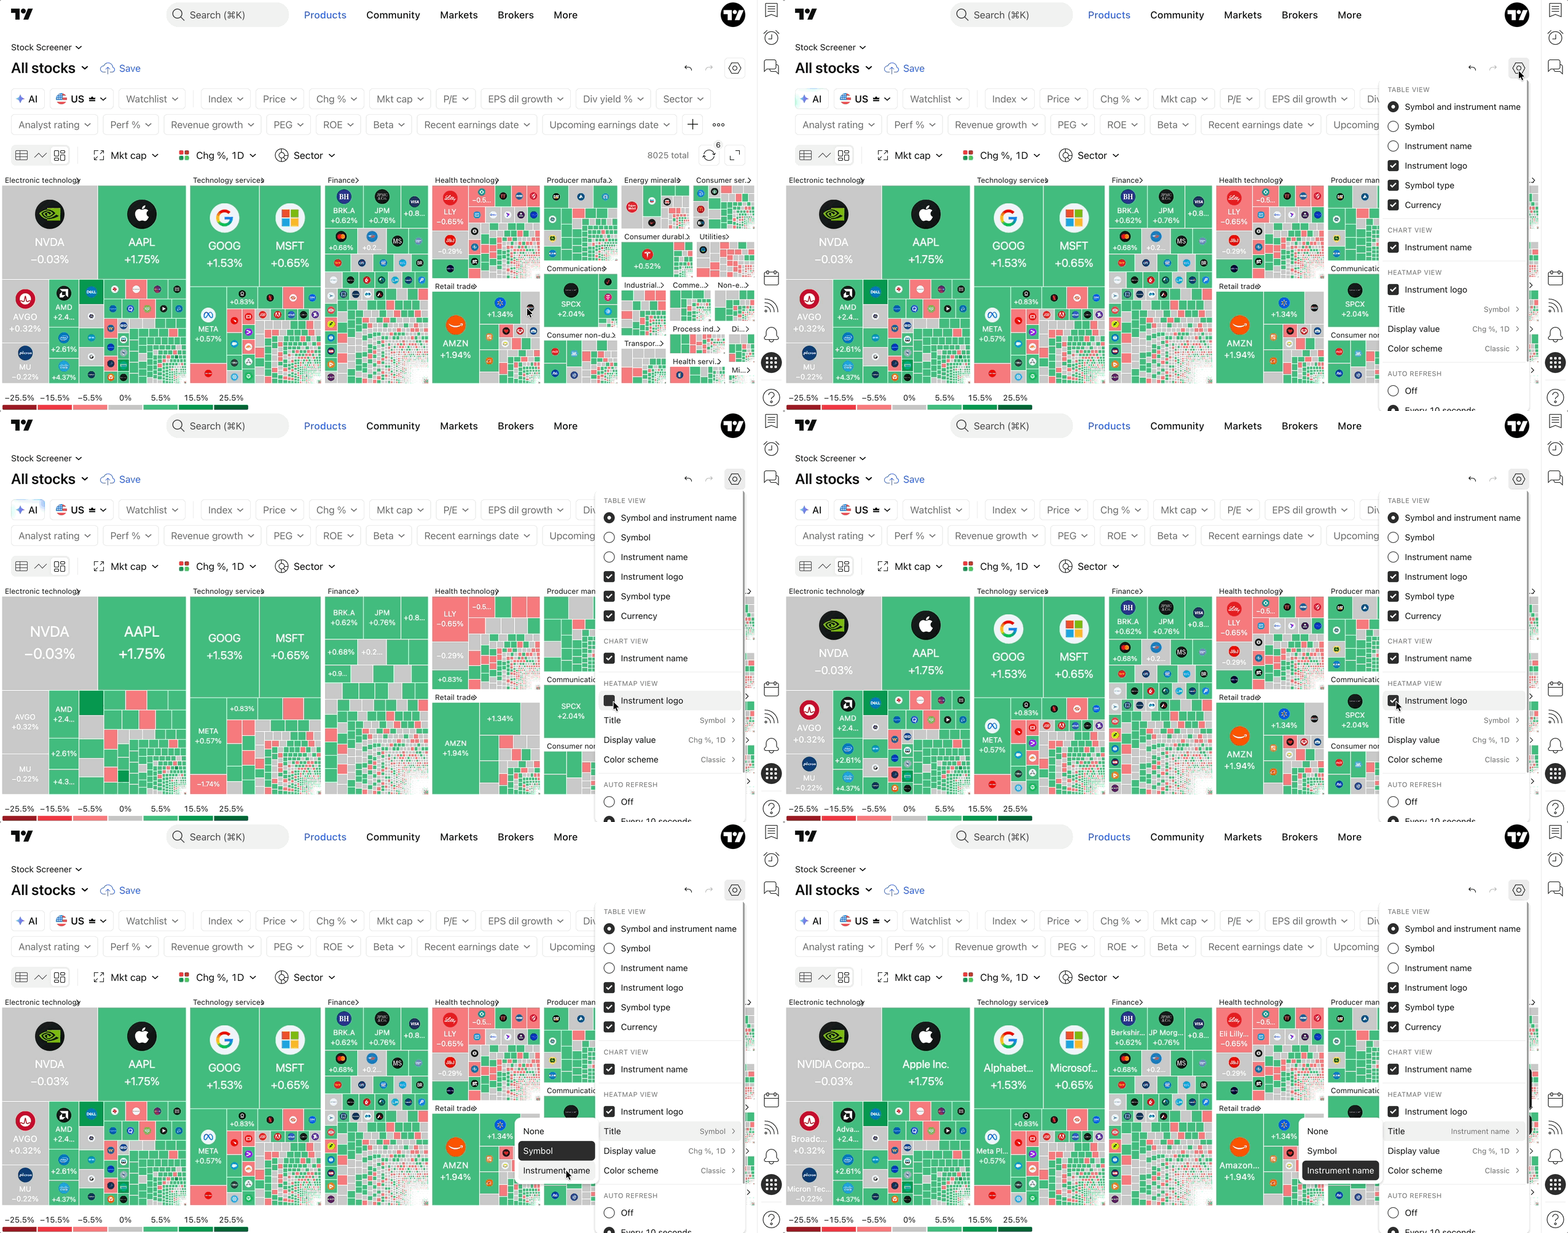
Click the cogwheel (settings) icon to fine-tune how the heatmap looks:
- Title: Show no label, the symbol ticker, or the symbol description on each tile.
- Logo: Show or hide the company/asset logo on tiles.
- Value: Show no value, the value of the metric selected in Color by, the symbol's price, or the value of the metric selected in Size by.
- Color scheme: Choose between several color palettes, including a color-blind-friendly option.
Working with the heatmap
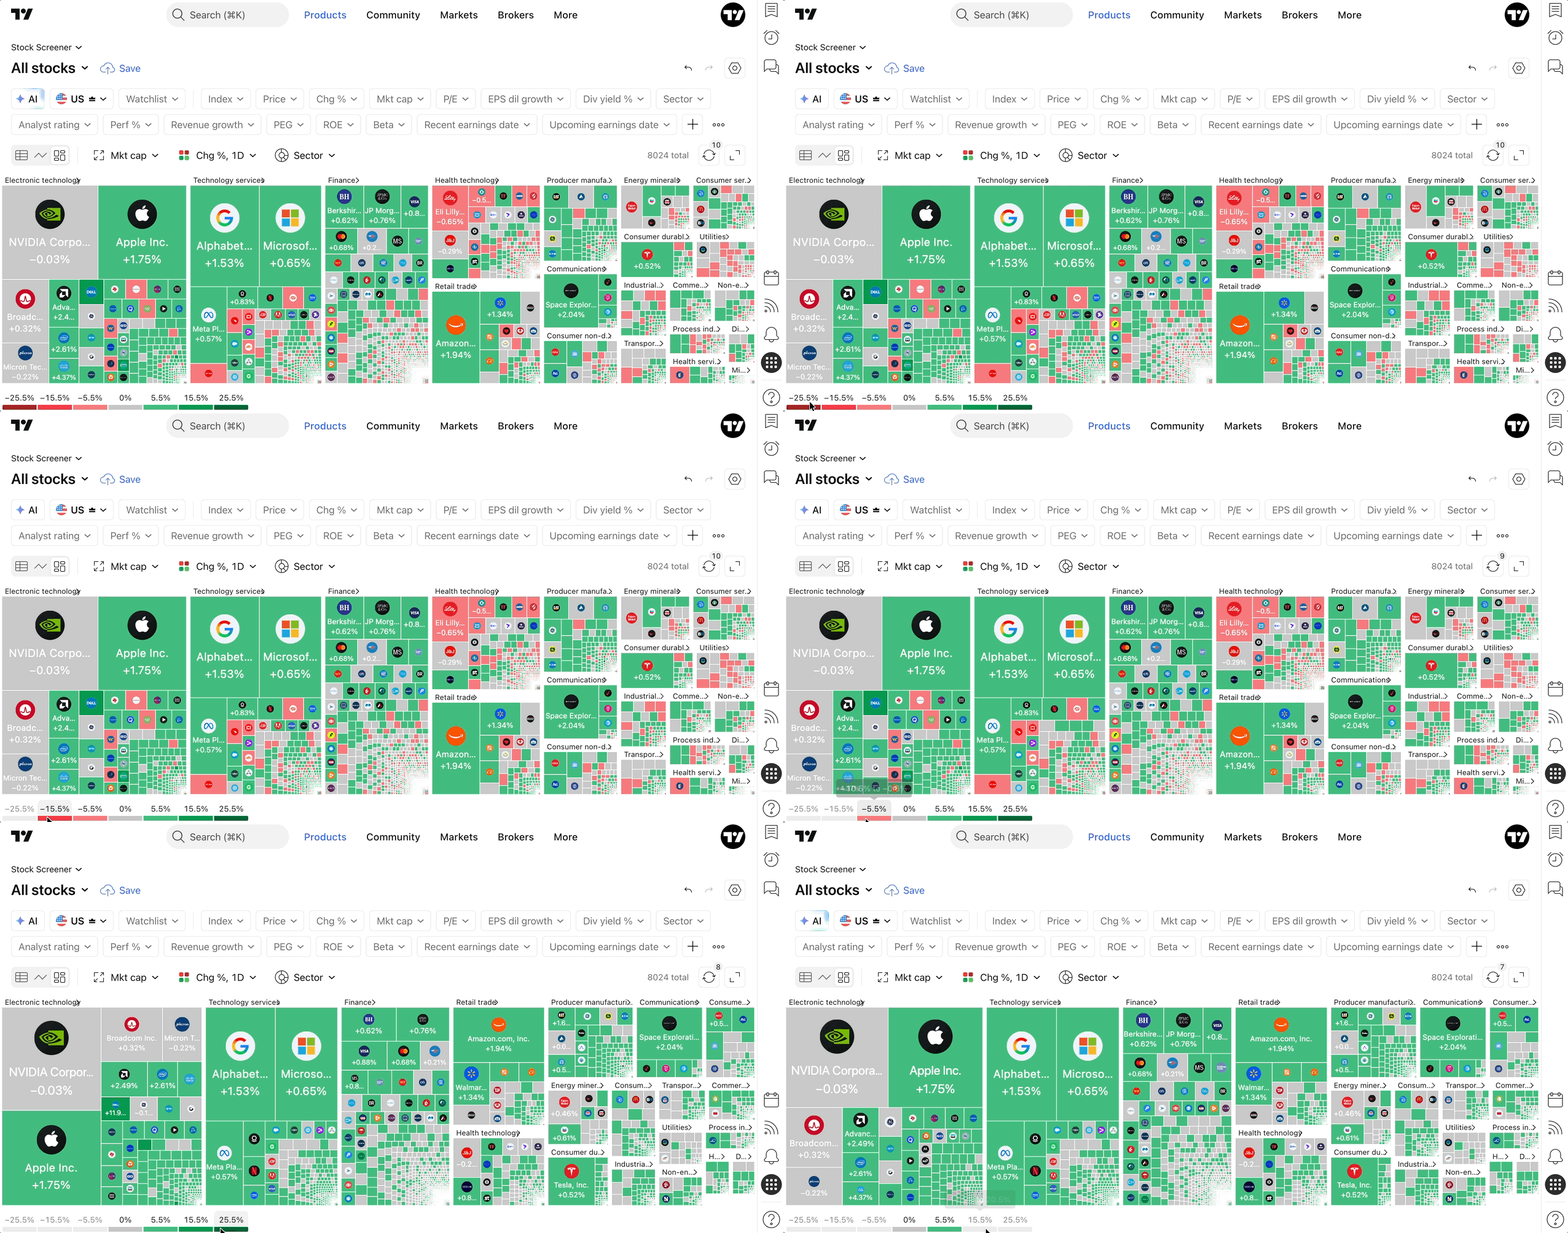
- Hover over a tile to see a tooltip with the symbol's price and the exact values of the selected Size by and Color by metrics. The legend above the heatmap doubles as an interactive filter — click a range on it to hide or show tiles in that range:
- Right-click a tile to add the symbol to a watchlist.
- Left-click a tile to update the Details panel, open the symbol on the chart, or change the current page's symbol, depending on where you're viewing the heatmap.
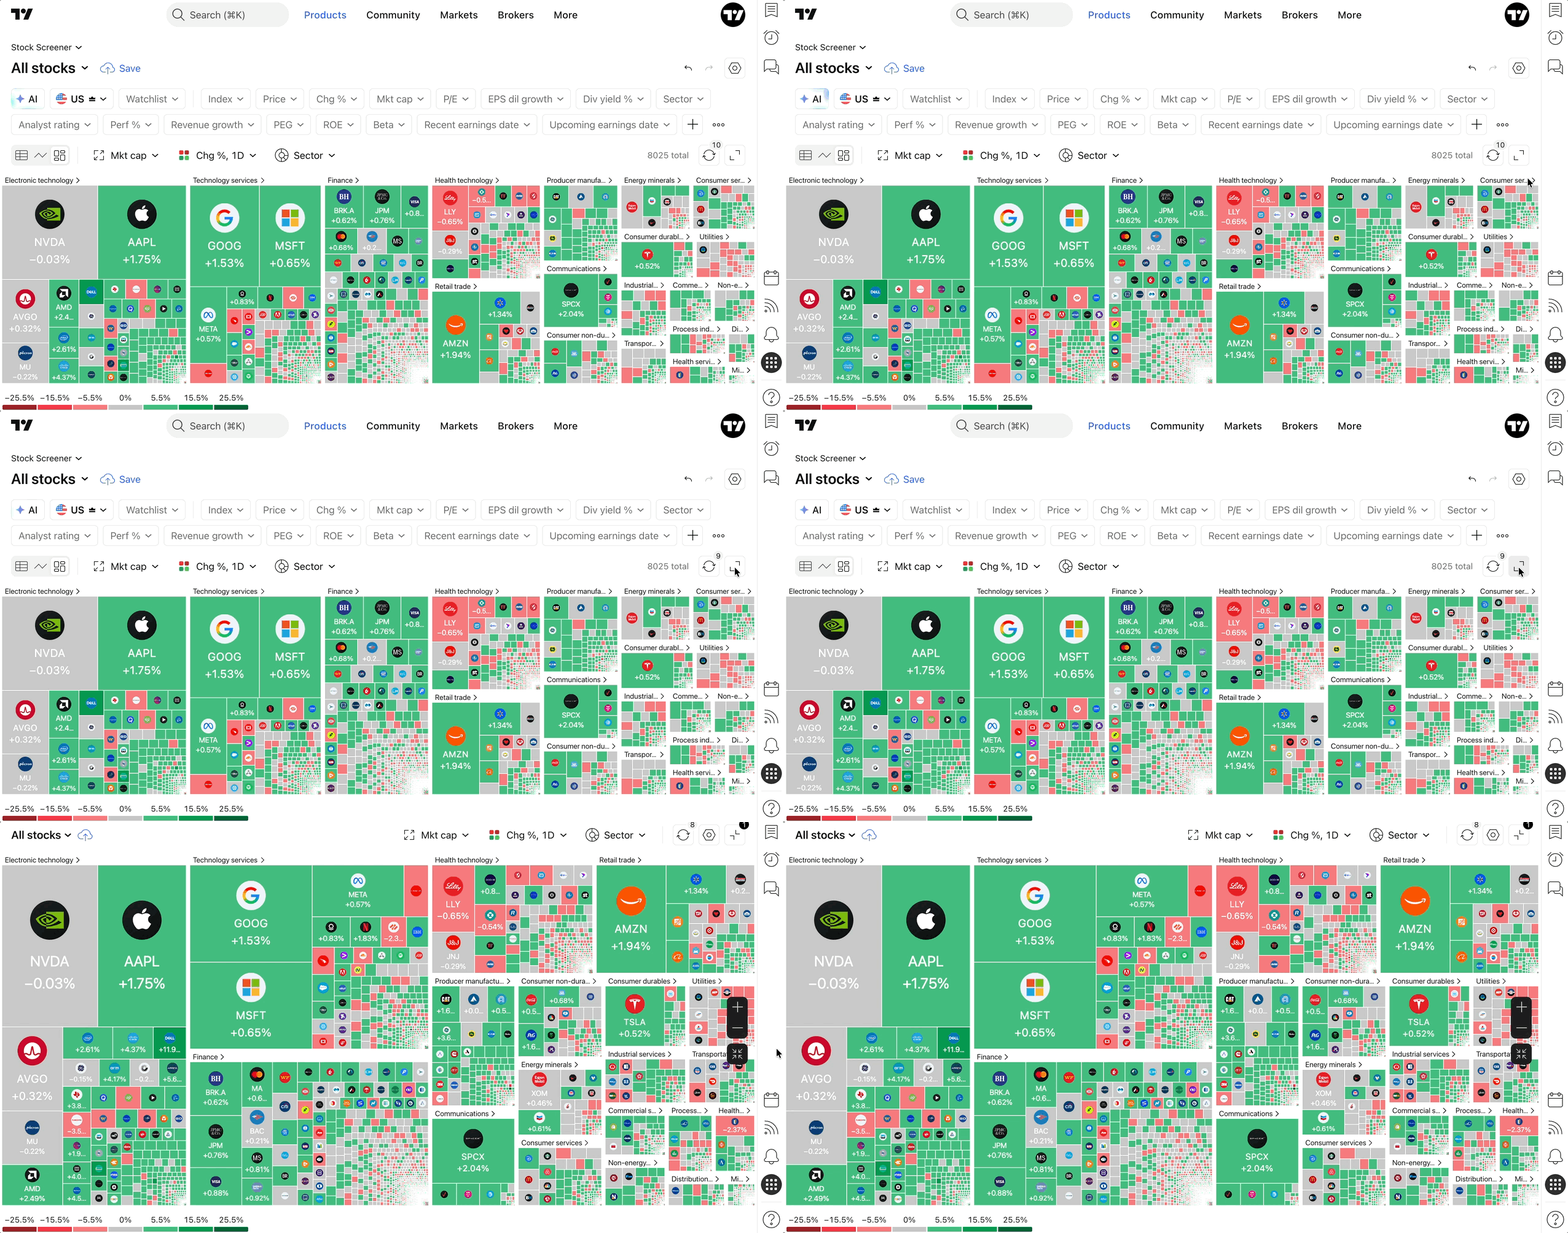
- Click the fullscreen icon in the top-right corner to expand the heatmap.
Limitations
A heatmap can display up to 16,000 symbols. If your current selection exceeds that limit, you'll be prompted to narrow your filters before the heatmap can be built.
Also read: