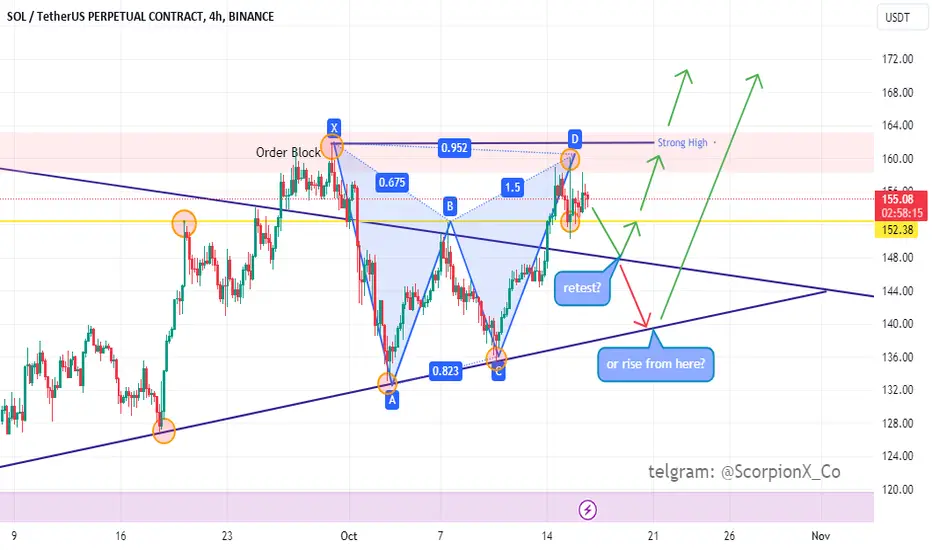
 SOL 4H
 1. Harmonic Pattern:
- A potential harmonic pattern is observed, consisting of points X, A, B, C, and D.
- Point D is located at the 0.952 Fibonacci level, indicating the completion of the pattern, and there is an expectation of correction or reversal.
2. Order Block:
- An "Order Block" area is identified near the price peak (range of 156 to 160). This area could act as a strong resistance, with a likelihood of price reversal from this level.
3. Ascending Trendline:
- The price has reacted to an ascending trendline multiple times. This line can serve as strong support, and if broken, it could lead to further price declines.
4. Retest Area or Rise from Here?:
- Two potential scenarios are illustrated in the analysis:
- Bullish Scenario: After reaching the trendline, the price could pull back and move upward.
- Bearish Scenario: If the trendline support is lost, the price may decrease further and move toward lower areas (around 140).
5. Strong High Area:
- This area is marked as a very strong resistance above the price, which, if broken, could lead to significant upward movement, potentially reaching the range of 164 and above.
Transakcja zamknięta: osiągnięto wyznaczony cel

Wyłączenie odpowiedzialności
Informacje i publikacje nie stanowią i nie powinny być traktowane jako porady finansowe, inwestycyjne, tradingowe ani jakiekolwiek inne rekomendacje dostarczane lub zatwierdzone przez TradingView. Więcej informacji znajduje się w Warunkach użytkowania.
Wyłączenie odpowiedzialności
Informacje i publikacje nie stanowią i nie powinny być traktowane jako porady finansowe, inwestycyjne, tradingowe ani jakiekolwiek inne rekomendacje dostarczane lub zatwierdzone przez TradingView. Więcej informacji znajduje się w Warunkach użytkowania.