
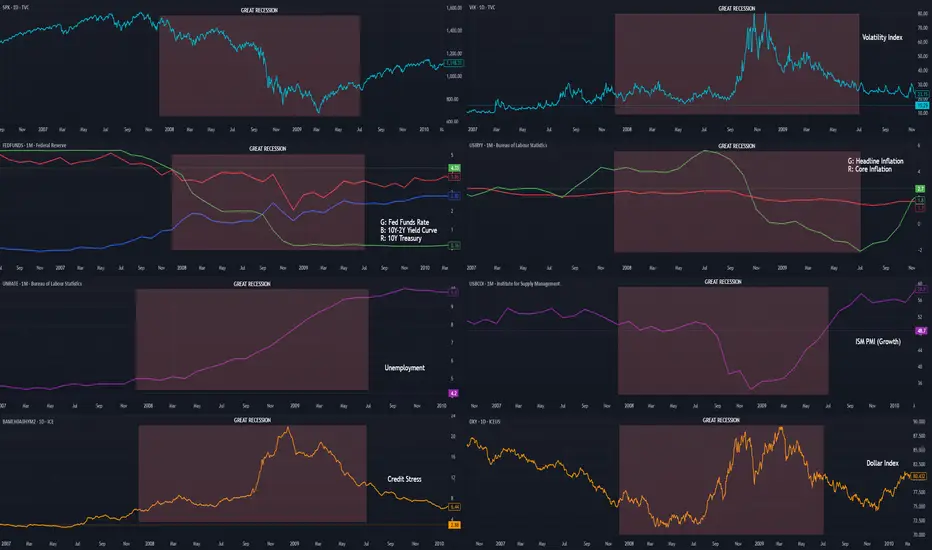
This is more of a cheatsheet/how-to for my own reference on my macro indicators charting layout. If the chart layout is helpful to the community, all the better! I find it useful for studying events and crises.
Indicators used: SPX, VIX, FEDFUNDS + US10Y + T10Y2Y, USIRYY + USCIR, UNRATE, USBCOI, BAMLH0A0HYM2, DXY
Row 1: Equity and volatility benchmarks
Row 2: Policy stance and inflation
Row 3: Unemployment and growth metrics
Row 4: Credit spreads and USD strength
SPX
VIX
FEDFUNDS + US10Y + T10Y2Y
USIRYY + USCIR
UNRATE
USBCOI
BAMLH0A0HYM2
DXY
Indicators used: SPX, VIX, FEDFUNDS + US10Y + T10Y2Y, USIRYY + USCIR, UNRATE, USBCOI, BAMLH0A0HYM2, DXY
Row 1: Equity and volatility benchmarks
Row 2: Policy stance and inflation
Row 3: Unemployment and growth metrics
Row 4: Credit spreads and USD strength
SPX
- Measuring: Equity benchmark
- Relevance: Broadest market barometer
- Observe: Trend direction, key levels, divergence vs other indicators
VIX
- Measuring: Volatility index
- Relevance: Market's implied volatility (read: "fear/greed gauge")
- Observe: Spike --> risk-off, hedging demand; sustained lows --> complacency
FEDFUNDS + US10Y + T10Y2Y
- Measuring: U.S. policy stance and yield curve
- Relevance: Monetary tightening and loosening; yield curve recession slope
- Observe: T10Y2Y curve inversion --> recession risk; bear steepening --> watch for inflation/deficit concerns; bull steepening --> Fed easing, recovery signal
USIRYY + USCIR
- Measuring: Inflation
- Relevance: Headline: all prices; Core: Excluding food + energy
- Observe: Headline stat drives short-term moves. Core stat drives Fed policy
UNRATE
- Measuring: Unemployment rate
- Relevance: Labor market health (this is a lagging indicator)
- Observe: Rising trend --> recession risk; very low --> possible overheating
USBCOI
- Measuring: Manufacturing PMI; Business activity
- Relevance: Leading growth indicator for manufacturing, services
- Observe: >50 means expansion, <50 means contraction
BAMLH0A0HYM2
- Measuring: U.S. High Yield Option-Adjusted Spread (the extra yield/spread investors demand to hold junk bonds vs risk-free Treasuries)
- Relevance: Stress in corporate bond markets; risk sentiment
- Observe: Widening --> investors demand more compensation for credit risk; narrowing --> investors are confident, low fear of defaults. 2-4 is normal, 4-6 is stressed, 6+ is distress, 10+ is crisis level
DXY
- Measuring: USD strength
- Relevance: Global liquidity, capital flows, financial conditions
- Observe: Strong USD = tighter conditions and pressure on risk assets; inverse for weak USD

Wyłączenie odpowiedzialności
Informacje i publikacje nie stanowią i nie powinny być traktowane jako porady finansowe, inwestycyjne, tradingowe ani jakiekolwiek inne rekomendacje dostarczane lub zatwierdzone przez TradingView. Więcej informacji znajduje się w Warunkach użytkowania.
Wyłączenie odpowiedzialności
Informacje i publikacje nie stanowią i nie powinny być traktowane jako porady finansowe, inwestycyjne, tradingowe ani jakiekolwiek inne rekomendacje dostarczane lub zatwierdzone przez TradingView. Więcej informacji znajduje się w Warunkach użytkowania.