
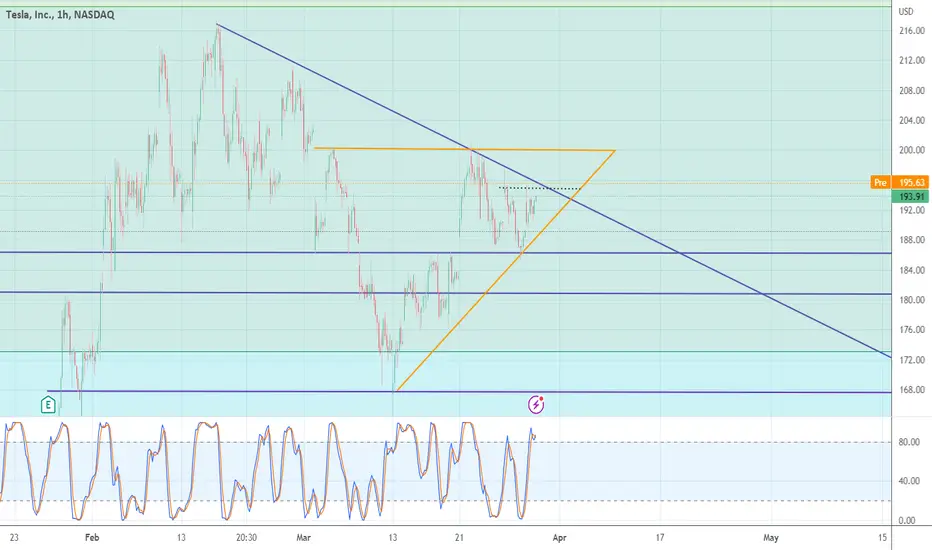
The 1h chart for TSLA indicates a major decending triangle formation (in blue) and an ascending tringle (in orange).
The ascending triangle could potentially cross the descending one today and we could see some further movement upwards.
The current RSI is overbought meaning that we could see some price correction in the early hours with some selling action. (to around $190)
My stop loss is still at $185.
The ascending triangle could potentially cross the descending one today and we could see some further movement upwards.
The current RSI is overbought meaning that we could see some price correction in the early hours with some selling action. (to around $190)
My stop loss is still at $185.

Wyłączenie odpowiedzialności
Informacje i publikacje nie stanowią i nie powinny być traktowane jako porady finansowe, inwestycyjne, tradingowe ani jakiekolwiek inne rekomendacje dostarczane lub zatwierdzone przez TradingView. Więcej informacji znajduje się w Warunkach użytkowania.
Wyłączenie odpowiedzialności
Informacje i publikacje nie stanowią i nie powinny być traktowane jako porady finansowe, inwestycyjne, tradingowe ani jakiekolwiek inne rekomendacje dostarczane lub zatwierdzone przez TradingView. Więcej informacji znajduje się w Warunkach użytkowania.