 TSLA
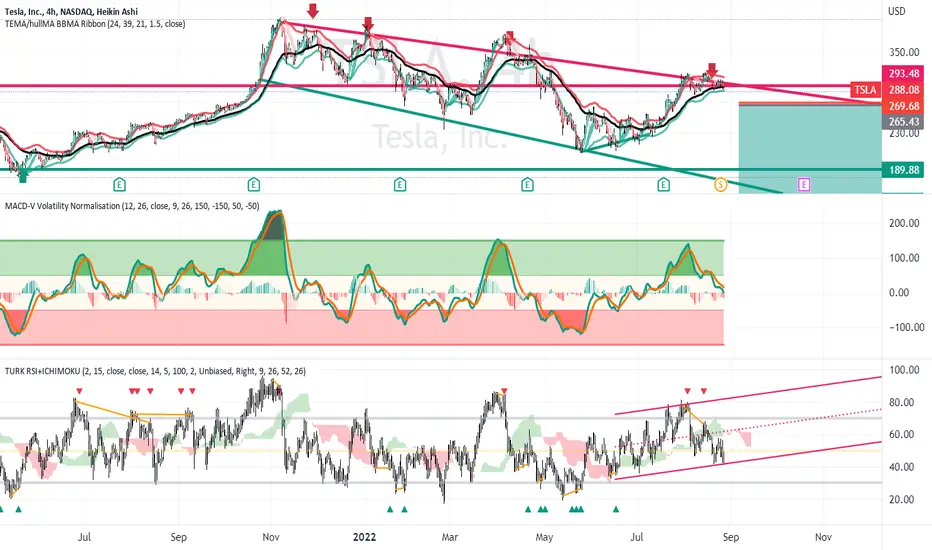
TSLA on the 4 hour chart appears to be in a downtrending parallel
channel and presently at the upper resistance boundary of
the channel. This could also be a megaphone pattern as the channel
is widening a bit as it descends. I see the horizontal resistance of February 2021
market high as resisting any breakout to higher prices.
I see horizontal support below at 190 from the market lows in March and May this year.
The MACD oscillator is in mid-range as is the RSI oscillator. The latter shows
some bearish divergence suggesting an impending reversal.
I see this as a short setup to synergize with the general market
the downturn from the current market price to 190 or until just before
the earnings report in mid-October. This is about $100 of profit
I will set a stop loss of $5 above the current market price Thid
is a great reward-to-risk ratio even if the price gets jammed up
at Fibonacci retracement levels on its way down. The low-costTR bearish ETF
is a consideration as are out of the money put options.

Wyłączenie odpowiedzialności
Informacje i publikacje nie stanowią i nie powinny być traktowane jako porady finansowe, inwestycyjne, tradingowe ani jakiekolwiek inne rekomendacje dostarczane lub zatwierdzone przez TradingView. Więcej informacji znajduje się w Warunkach użytkowania.
Wyłączenie odpowiedzialności
Informacje i publikacje nie stanowią i nie powinny być traktowane jako porady finansowe, inwestycyjne, tradingowe ani jakiekolwiek inne rekomendacje dostarczane lub zatwierdzone przez TradingView. Więcej informacji znajduje się w Warunkach użytkowania.