
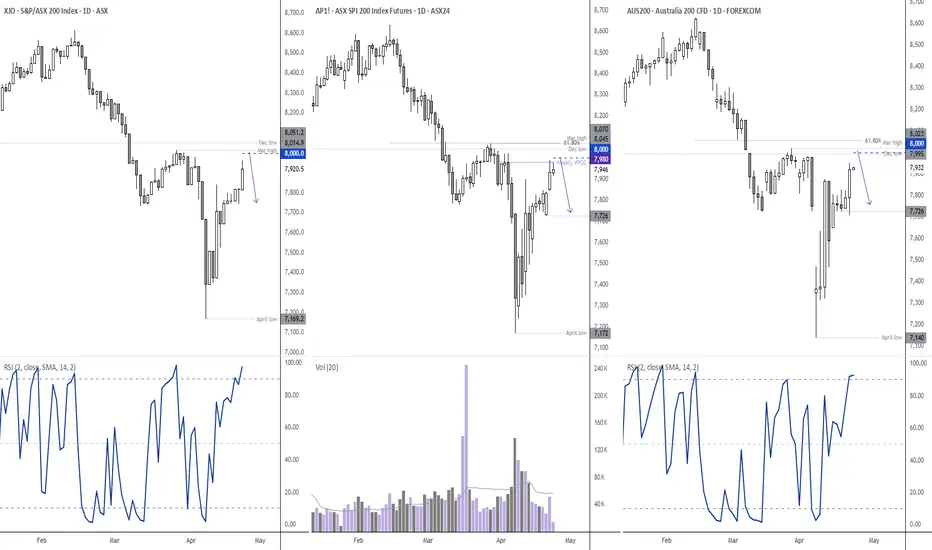
It can be useful to monitor several renditions of the same market, in order to identify higher probability support and resistance levels. And I would personally argue this becomes the more important if one trades CFDs exclusively.
Today I am comparing the ASX 200 cash market (XJO) and ASX 200 futures market (SPI 200, or AP1!) alongside the forem.com AUS200 CFD.
All three markets are approaching a key resistance cluster around 8,000. Neither the cash market nor futures market has broken above 8,000 yet and have several resistance levels (including a 61.8% Fibonacci ratio while the March low and December high) remain unbreached. Also note that futures volumes have been declining while prices rise, which shows a lack of bullish initiation (and also points to a short-covering rally).
Therefore, my bias is to fade into moves on the AUS200 should it breach its own 8,000, with the short bias becoming invalidated with a break above the 61.8% Fib level.
Matt Simpson, Market Analyst at City Index and Forex.com

Powiązane publikacje
Wyłączenie odpowiedzialności
Informacje i publikacje nie stanowią i nie powinny być traktowane jako porady finansowe, inwestycyjne, tradingowe ani jakiekolwiek inne rekomendacje dostarczane lub zatwierdzone przez TradingView. Więcej informacji znajduje się w Warunkach użytkowania.