Bullish Divergence
ICHR: Is the Pullback Over? Trendline BrokenStory:
📊 The Setup
ICHR broke down hard from a $118 high into a multi-month downtrend, falling inside a clean descending trendline. Price is now testing the top of that structure right where the prior base (~$50-56) offered support before the original breakout.
⚡ The Signals
Bullish divergence on the oscillator — a classic early-reversal tell. That divergence is now backed by price breaking above the descending trendline, on a volume spike.
🎯 Levels to Watch
🟢 Base support: $50
🔴 Immediate re
BLDR:Sometimes Strongest Moves Begin Before The Headlines NoticeAfter months of selling pressure, BLDR is beginning to look constructive again. The chart is quietly stacking multiple bullish signals while price compresses just below resistance. The next breakout could mark the beginning of a much larger trend reversal.
📊 Technical Story
🔹 Double Bottom formed around major support, suggesting sellers are losing control.
🔹 Bullish Divergence visible on both the Daily and Weekly RSI, where momentum has been improving despite price revisiting the lows—a class
NZDUSD TRADE PLANThere is bearish trend on 1H time frame. But I saw reversal pattern of falling Wedge, double bottom and have bullish divergence also. So may be trend will reverse from here but we still wait for confirmation till the break of last LH and will execute buy stop order then and trade accordingli.
Angel One: The Ceiling That Became the FloorHello Friends, Welcome to RK_Chaarts
Today we are looking into example chart of Angel One Limited to understand how Resistance Turns Into Support. This post is for Educational purpose only and not any trade idea.
Look at this chart. A falling trendline held price down multiple times - Jan 2024, Dec 2024 and June 2025. Every time price came close to this line, it got rejected.
Then in April 2026, price finally broke above this trendline. And something interesting happened after that. The same
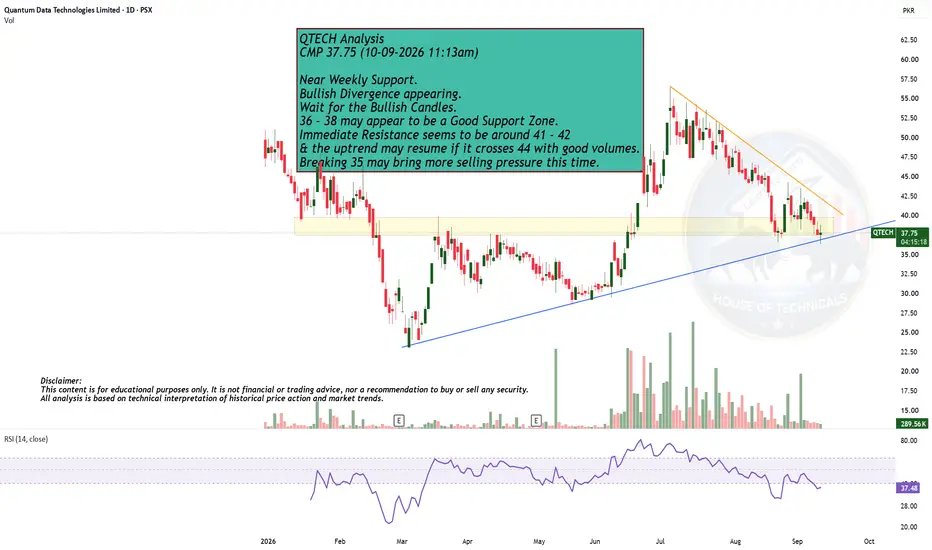
Near Weekly Support.QTECH Analysis
CMP 37.75 (10-09-2026 11:13am)
Near Weekly Support.
Bullish Divergence appearing.
Wait for the Bullish Candles.
36 - 38 may appear to be a Good Support Zone.
Immediate Resistance seems to be around 41 - 42
& the uptrend may resume if it crosses 44 with good volumes.
Breaking 35 may bring more selling pressure this time.
USDT.D 1D - Bullish DivergenceUSDT.D 1D — Bullish Divergence ⚠️
USDT Dominance is showing a bullish divergence on the daily timeframe.
Price is making a lower low, while the momentum oscillator is making a higher low.
That suggests downside momentum is weakening.
The key area to watch is ~6.65% support. A successful reversal from here could put pressure on crypto risk assets, particularly BTC and alts.
Confirmation would come from:
USDT.D reclaiming ~6.90%
Momentum continuing higher
A break of the descending trendline
SYM: Quietly Building a Base — Is a Breakout Brewing?Sometimes the most interesting setups aren't the ones already running.
They're the ones building quietly before the crowd arrives.
SYM has spent months stabilizing after a prolonged decline, with price repeatedly finding buyers around the $39–40 support zone.
Meanwhile, momentum is starting to tell a different story.
📈 Bullish momentum divergence
🏗️ Base building
📉 Long-term downtrend being challenged
👀 Major resistance at $48
And there is something interesting happening underneath the cha
AAON: Major Support + Bullish Divergence = Reversal?? AAON is testing a major historical support zone around $73–75. Meanwhile, RSI is showing a bullish divergence, suggesting downside momentum may be weakening.
Today’s candle is shaping up as a potential bullish engulfing candle — but the daily close will matter.
🔎 Key levels to watch:
• $84.50 → Initial resistance / first confirmation
• $97.50 → Major bullish reversal confirmation
• $73–75 → Critical support zone
• SL: Below $75; preferably a daily close below $73
If support holds and price re
QXO: Bullish Divergence Meets Trendline Support & Double BottomQXO, Inc is quietly signaling a major shift at a critical structural boundary. After a multi-month leg down, price action is consolidating right on macro trendline support—and momentum indicator is showing classic sign of seller exhaustion.
📊 Technical Breakdown: Aligning the Reversal Confluences
🟢 Double Bottom at Macro Support ($13.1): Price has bounced off the long-term rising trendline support, forming a clear Double Bottom around $13.1. This key green line marks strong structural demand wh
AUDNZD Long Opportunity based on Chart CharacteristicsTrade idea based on chart characteristic
AUDNZD had given a bullish divergence on 1D in Apr25
After that it rallied by 15% disrespecting many bearish divergences
Chart shows a long term strength of AUD against NZD
Trade plan on 1D timeframe with 1% risk
Bullish divergence
Entry upon breakout from last LH
SL on last LL
TP open (BE at RR1)
Gold: Trendline Breakout + Bullish Divergence— Rally Ahead?Presenting another high-probability story. This time for GOLD:
After weeks of respecting a descending trendline, Gold has finally broken above it, potentially signaling that the recent /short term corrective phase is coming to an end.
What's even more interesting is what happened after the breakout.
Instead of immediately running higher, price pulled back to retest the broken trendline, which has now flipped from resistance into support. Right at this confluence, Gold printed a Doji candle, s
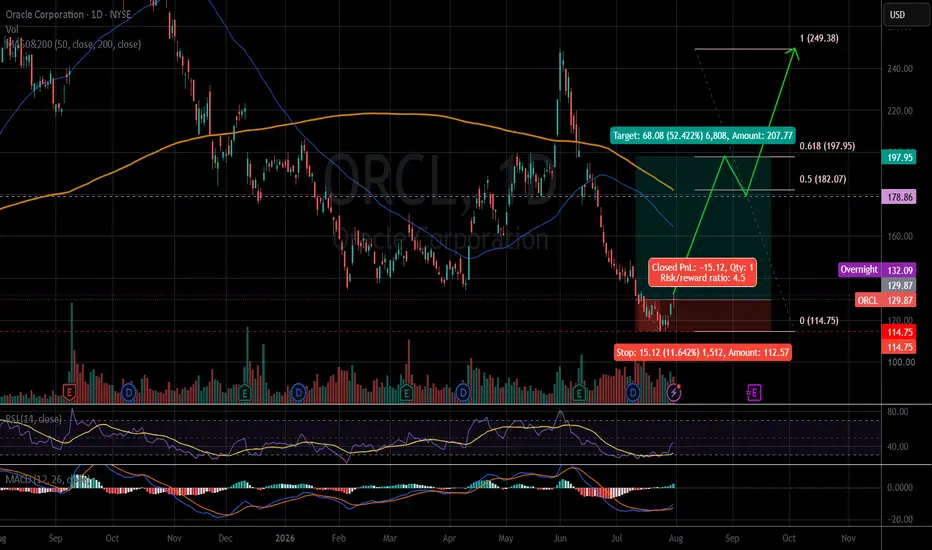
ORCL bullishThe weekly chart shows a bullish divergence with the RSI.
There were signs of a price increase last week, according to the RSI and MACD indicators.
The price closed on 07.31.2026: $129.87.
Price target: $197.95/ $249.38
Stop loss: $114.75 (-11.6%)
R/R: 4.5
IMO, amateur trader.
Good luck!
GGG: Double Breakout After Quiet Accumulation – Next Leg Higher?Presenting another high-probability chart story.
After months of persistent selling pressure, GGG appears to have completed a textbook accumulation phase. Price spent several weeks moving sideways inside a tight range while volume gradually picked up, suggesting that stronger hands may have been accumulating shares rather than distributing them.
Now the technical picture is becoming much more interesting.
The stock has achieved a double breakout:
✅ Breakout above the local consolidation / ac
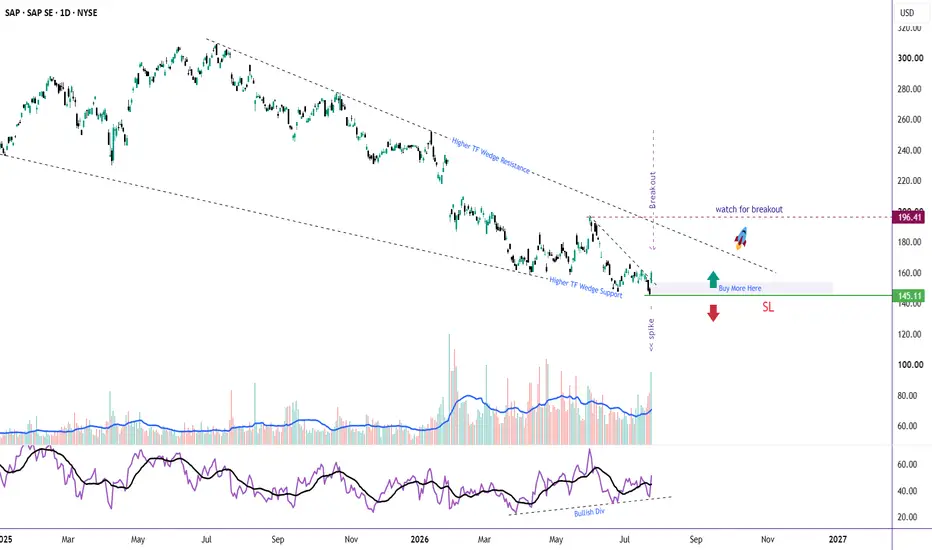
SAP: Bullish Reversal or Setting a Trap?SAP delivered strong earnings, and the market responded with conviction. The stock surged on exceptionally high volume, breaking out of its short-term downtrend—a sign that institutional buyers may be stepping back in.
But there's a bigger story unfolding.
📊 The Story
After almot a year of correcting within a higher-timeframe falling wedge, SAP has finally shown its first meaningful sign of strength.
The recent breakout came with:
🟢 A strong volume spike, adding credibility to the move.
🟢 B
XLU Bullish Divergence: Utilities Are Starting to Show StrengthXLU is showing improving momentum after forming a bullish divergence on the Stochastic Oscillator near the June low. More recently, price has held a higher low while Stochastic revisited a lower level—another constructive sign that selling pressure may be weakening.
Price is now testing the $45.60–$45.70 resistance area. A decisive close above this zone could confirm renewed strength and open the way for a continuation toward the previous swing highs. The rising trendline and the $44.40–$44.50
PEGA: Bullish Divergence at Support – Is the Downtrend Ending?PEGA has been in a steady downtrend since reaching its October 2025 high near 68. After months of selling pressure, the stock has finally reached a strong long-term support zone, where buyers are beginning to show signs of strength.
A bullish divergence has developed on the daily timeframe, indicating that downside momentum is weakening. This was followed by a powerful bullish engulfing candle, suggesting demand has returned at this key support level.
The first challenge for the bulls is the 3
KVYO: Bullish Divergence at Bottom – Is a Trend Reversal BrewingKVYO continues to trade within a long-term downtrend, but the technical picture might start improving from here.
The stock has formed a bullish divergence while forming strong support around 12.5, suggesting that bearish momentum is weakening. Adding to the bullish case, this week's price action produced a strong bullish engulfing candle accompanied by a significant surge in trading volume—often an early sign of institutional accumulation.
The 12.5 level now stands out as a well-defined suppor