JUPUSDT: bullish extension toward $0.235The Macro Picture 🗺️
The post-reclaim squeeze has resolved — and resolved exactly as the bullish branch mapped. Price broke through the $0.200 wall, cleared the $0.205 ceiling, and just tagged the $0.220 target on a clean four-session run. That is the second consecutive bullish target hit in this series, with the entire move tracing back to the macro floor sweep at $0.144 on June 10. The structure has finished its rebuild phase: $0.200 has flipped from the most-tested resistance on the chart into structural support, the prior stall floor at $0.190 is now well below price, and the next test sits at the lower edge of the May overhead supply zone.
The Setup ⚙️
The Flipped Wall: $0.200 capped four months of attempts before finally breaking — and price has now spent multiple sessions trading well above it without a single dip back into the level. The wall has become the floor, and the post-spike compression range below it has been retired.
The Reaction: RSI has lifted from the midline back into the upper 50s without printing overbought. Eight days of recovery, two targets hit, and the indicator still has room to extend — the kind of slow, structural momentum that tends to carry through to the next supply test rather than fade beforehand.
The Continuation Path: The territory between $0.220 and $0.235 is unwalked since the immediate post-spike unwind in mid-May. Bulls have a clear runway through that pocket with no intermediate horizontal blocks — the next real test is the supply shelf at $0.235 itself.
The Roadmap: Primary target sits at $0.235 — the lower edge of the May overhead supply zone, where the original distribution shelf demands to be retested. Invalidation: a sustained 1D close back below $0.200 would invalidate the continuation thesis, signal that the flipped wall has failed to hold as support, and reopen the deeper retest toward the $0.165 reclaimed floor.  Long
Long
BLUAIUSDT base breakout: targeting $0.01800 supplyThe Macro Picture 🗺️
BLUAI's higher-low base has resolved exactly as the structure promised. Five sessions of constructive build above $0.01250 culminated in a clean closing break of the $0.01500 trigger, with the prior level immediately flipping into support on the first retest. This is the structural payoff phase of the entire arc since the June 11 sweep: every prior leg was defined by trapped participants on one side or the other, but this leg is being built on validated demand, absorbed supply, and progressively higher closes. Price now sits inside the same supply zone that defined the May lower-high rejections — and the path of least resistance points directly into the $0.01800 post-breakout body high, the level where the June 6 trapped buyers still rest overhead.
The Setup ⚙️
The Pivot: The $0.01250 higher-low pivot absorbed every test through the base-building phase without producing a single closing breach — that level has now been validated as the structural floor of this entire micro-trend, with sell stops parked beneath it left untouched.
The Trigger: The $0.01500 trigger fired with a clean 1D close, and the immediate retest from above held without ceremony — this is the support flip behavior that distinguishes a genuine breakout from a false start, and it confirms the base as a launchpad rather than a ceiling.
The Reclaim: As indicated by the white projection, the path between current price and the $0.01800 target runs directly through the $0.01700 broken macro ceiling — the same level that defined the May structural peak and capped the June 6 breakout attempt. A clean reclaim there clears the last meaningful overhead reference before the supply zone proper.
The Roadmap: Primary target sits at $0.01800 — the post-breakout body high where the trapped buyers from the June 6 vertical thrust still rest, and the cleanest unfilled liquidity pocket between current price and the $0.02300 failed-breakout peak. Invalidation: a clean 1D close back below $0.01250 would invalidate this base-breakout thesis and re-arm the bearish path toward the $0.00900 demand pocket. XAU/USD | Bulls Defend Key Demand Zone! Is $4300 The Next TargetBy analyzing the #Gold chart on the 4H timeframe, we can see that after our previous update, Gold once again respected the key demand area perfectly. After dipping toward the $4122 region, buyers stepped in aggressively and pushed price all the way up to $4221, delivering nearly a 1000-pip recovery.
Currently, Gold is trading around the $4200 region and momentum has slowed noticeably. Price action has become relatively quiet and the market lacks strong directional conviction. Personally, I don't like overly calm markets because periods of low volatility can often lead to unexpected manipulation and false moves. For now, patience remains the best approach and it may be wise to wait and see if volatility returns over the next sessions.
From a structural perspective, the nearest demand zones are located around $4170 – $4190, followed by a stronger support cluster between $4120 – $4145. On the upside, the closest supply zones are located around $4220 – $4250, followed by a stronger resistance area between $4280 – $4310.
Despite the recent lack of momentum, my broader medium-term outlook remains bullish. In my view, Gold still has the potential to continue higher and challenge the $4300 region in the near future if buyers continue defending higher lows.
This analysis will be updated as the market evolves.
Please support me with your likes and comments to motivate me to share more analysis with you and share your opinion about the possible trend of this chart with me !
Best Regards , Arman Shaban  Long
Long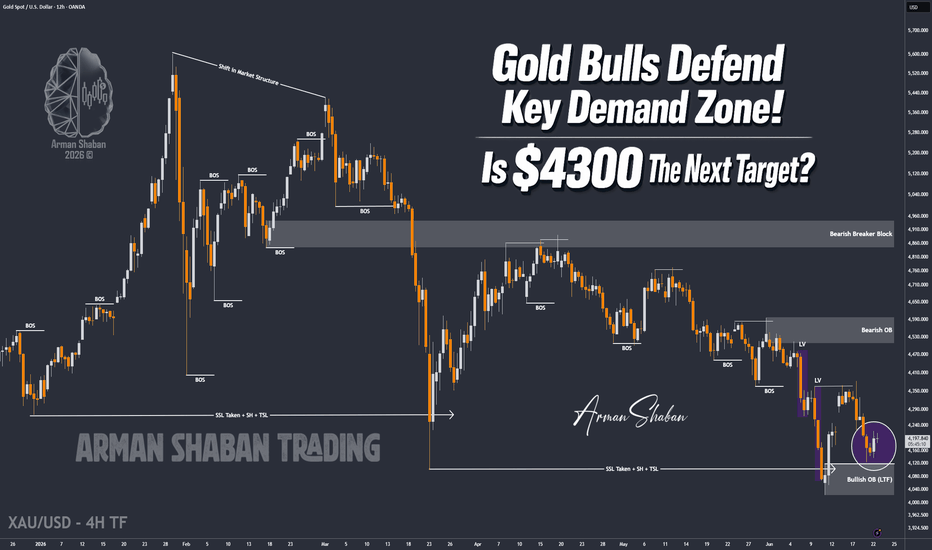
 Short
Short

Nifty Analysis EOD – June 24, 2026 – Wednesday🟢 Nifty Analysis EOD – June 24, 2026 – Wednesday 🔴
Calm Climb, Quiet Surprise: Bulls Reclaim Ground and Close Above 24K
🗞 Nifty Summary
Nifty started flat and found initial support at the 23,790 zone. Within a few minutes, it tested the 23,890 resistance zone and gave an 85-point sharp retracement. From there, a sharp recovery followed — and then something quieter but equally impressive: a slow, steady upward move that took Nifty all the way to 24,075.
What made today interesting was how it got there. 23,890, IBH, 23,970, 24,000 — all these levels broke one by one, calmly, almost without making noise. No wide candles, no momentum bursts. The 1-min candle ranges were small all day, yet the index just kept moving up. It also tested the Previous Day Open Price along the way.
After tagging 24,075, Nifty spent nearly an hour consolidating around 24,045 in a tight 20–30 point range before ending the day at 24,013.15 on an intraday basis, with the final close at 24,021.65.
Today’s price action was genuinely unexpected. Yesterday we saw a sharp fall with wide-range 1-min candles and clear momentum. Today had none of that — and yet, on a closing basis, bulls quietly recovered almost 70–75% of yesterday’s fall. Most of us, myself included, thought 23,970 ~ 24,000 wouldn’t be crossed today. The market didn’t prove us wrong by blasting through — it just closed above 24K, which said enough.
Today’s range came in at exactly 300 points, placing it in the range expansion / trending day category. The daily candle structure reflects that quiet but real bullish effort. For the next session, bulls need to take on the 24,125 ~ 24,170 zone — that’s where bear defence is still active. After two back-to-back wide-range days, the upcoming session might lean range-bound within the two-day range of 24,125 ~ 23,790. Worth keeping in mind that tomorrow is also the last session before the long weekend.
🛡 5 Min Intraday Chart with Levels
📉 Daily Time Frame Chart with Intraday Levels
🕯 Daily Candle Breakdown
Open: 23,795.80
High: 24,090.05
Low: 23,789.25
Close: 24,021.65
Change: +197.55 (+0.83%)
🏗️ Structure Breakdown
Type: Bullish candle — quiet, steady grind with a long upper wick
Range: ≈ 301 points — high volatility
Body: ≈ 226 points — reflects sustained buyer presence across the session
Upper Wick: ≈ 68 points — some supply visible near the day’s high, sellers pushed back at 24,075+
Lower Wick: ≈ 7 points — almost no selling at the open; buyers stepped in almost immediately
🛡 5 Min Intraday Chart
⚔️ Gladiator Strategy Update
ATR: 266.07
IB Range: 115.10 → Medium
Market Structure: Balanced
Trade Highlights:
10:10 Long Trade: Target Hit (R:R 1:1.69)
11:19 Short Trade: SL Hit
12:09 Short Trade: SL Hit
Trade Summary:
The long trade in the morning read the move well and delivered. The two short trades after that didn’t work — the index just didn’t give the bears what they needed, and both stopped out. Days like this are a reminder that price action can look one way and move another. The system did its job; the results were mixed, and that’s fine.
🧱 Support & Resistance Levels
Resistance Zones: 24,045 ~ 24,075 | 24,125 | 24,170
Support Zones: 23,900 | 23,855 | 23,790 | 23,650 ~ 23,620
🧠 Final Thoughts
“The quietest moves often carry the most weight — the market doesn’t need to shout to make a point.”
Today was one of those sessions where the price action looked weak on the surface but the result spoke differently. Small candles, low momentum — and yet Nifty closed above 24K and recovered most of yesterday’s fall. That gap between appearance and outcome is worth sitting with.
For tomorrow, the 24,125 ~ 24,170 zone is the one to watch. If bulls can push into that zone with some follow-through, the picture changes. If the index stalls here and starts drifting back below 24,000, it might just be a two-day range situation playing out before the long weekend.
Two SL hits today after a solid long — net day was okay, not great. Going into tomorrow’s pre-holiday session with a bit more patience, especially since range-bound conditions could mean a lot of whipsaw. Will let the levels speak first before committing.
✏️ Disclaimer
This is my personal digital diary and represents my own analysis and point of view. It is not financial advice; please consult a professional advisor before making any trading decisions.  Short
Short
Satoshi Frame | Bitcoin analysis day 5🔥 Welcome to SatoshiFrame ,Let's dive into today's Bitcoin analysis.
👑 Two bearish waves are playing out on this chart and the difference between them tells an important story.
⚡️ Wave 1 came in slow and steady, lower selling volume, more candles, less urgency. Wave 2 (the current move) is a different beast entirely, fewer candles, accelerating momentum, and significantly higher selling volume. The bears are picking up speed.
🐻 Bearish Scenario: If sellers manage to break and close below $62,106 to $62,200, expect continuation toward the next support levels at $61,498 and $61,114.
🟢 Bullish Scenario: If buyers defend this zone and push back, the key level to reclaim is $63,930. A confirmed breakout above it opens the door to $65,604 and $66,118.
📊 RSI sitting at ~46, recovering from oversold territory. Watch this zone closely.
The second wave is faster, heavier, and more aggressive. Let the market show its hand before committing.
🤝 Not financial advice. Trade safe.
⚠️ Risk management and capital management are essential in trading. Always trade based on your own strategy and risk tolerance. Every trading decision and its outcome are entirely your own responsibility.  Short
Short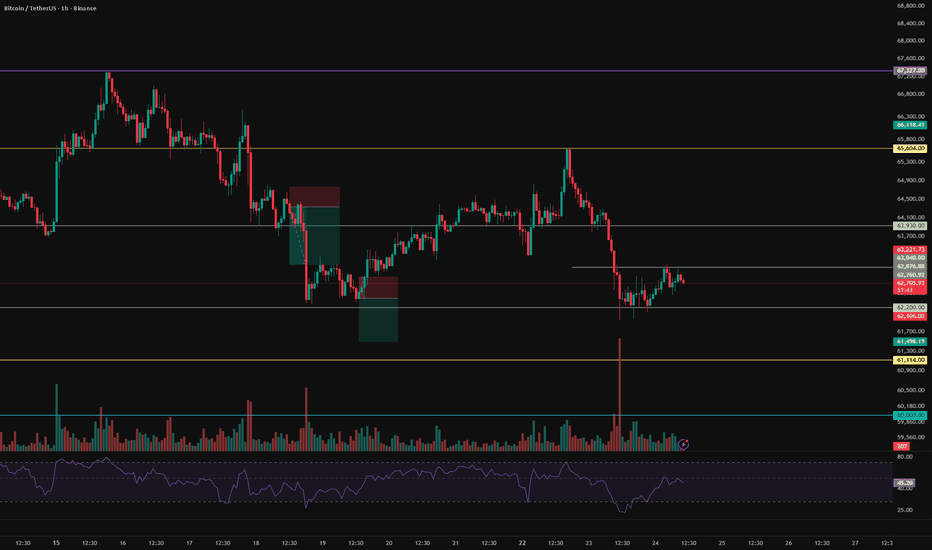
 Long
Long
USD/JPY(20260624)Today's AnalysisMarket News:
Deutsche Bank research analyst Michael Hsueh stated in a report that "the Fed's repricing, coupled with strong US macroeconomic data, is the main reason for the decline in gold prices." The bank has lowered its third-quarter gold price forecast to $4,300 per ounce, a reduction of more than one-fifth from its previous forecast, and adjusted its forecast for the last three months of the year to $4,800 per ounce.
Similar adjustments were made by Goldman Sachs. Last week, the institution lowered its year-end gold price forecast by $500 to $4,900 per ounce, citing its assessment that the Fed will not cut interest rates this year.
Technical Analysis:
Today's Buy/Sell Threshold:
161.52
Support and Resistance Levels:
161.98
161.81
161.70
161.34
161.22
161.05
Trading Strategy:
If the price breaks above 161.70, consider buying with a first target price of 161.81.
If the price breaks below 161.52, consider selling with a first target price of 161.34. Gold remains in bear territory: It could sink even lower!Judging from the current performance of gold prices, the downtrend has been confirmed. The 4100 level was once breached, and the intraday low touched around 4091. Although it rebounded to around 4130, it has not yet broken through the short-term resistance zone of 4140-4160. It is a rebound after breaking through key support, not a bottoming signal. Moreover, the short-term rebound is limited and unlikely to reverse the current downtrend, with the bears holding an overwhelming advantage.
On the other hand, in addition to the easing of tensions between the US and Iran, the new Federal Reserve Chairman Warsh's tough stance against inflation has boosted expectations of interest rate hikes. In a market driven by interest rate hike expectations, there is no underlying logic for gold to rise. Therefore, at least until the PCE data is released, I still advocate shorting gold. As gold continues to decline, the current resistance zone has moved down to the 4140-4160 area. If gold fails to break through this area during the rebound, it is expected to continue its downward trend to the 4060-4040 area.
Resistance: 4140-4160; 4180-4200
Support: 4100-4080; 4060-4040
Therefore, in the upcoming short-term trading, I will prioritize shorting gold after it rebounds to the 4140-4160 area. Short 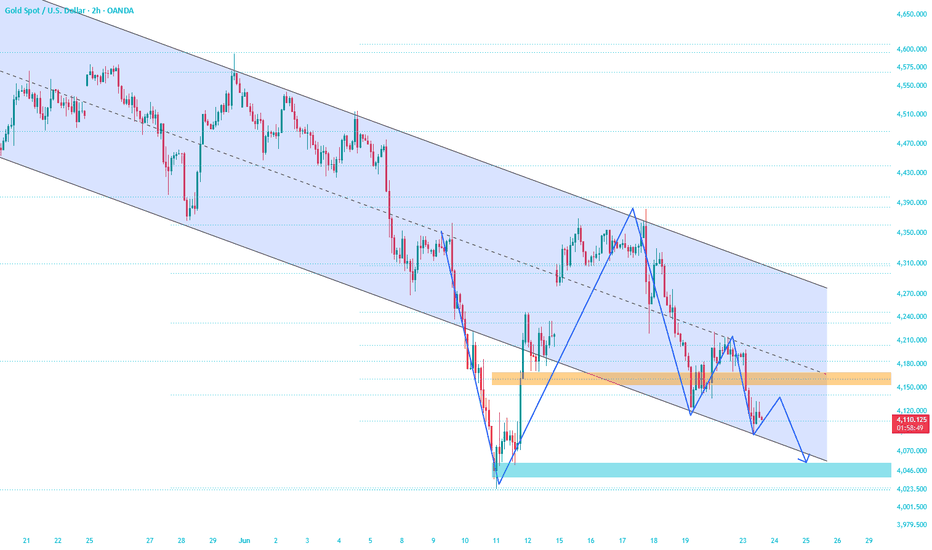
Speculative unwind puts Nikkei uptrend to the testTuesday's sell-off was as brutal as it was necessary, flushing out speculative excess that had built up during the run to record highs. The focus now shifts to 68,782, the former record high from earlier this month. The level was tested once before and again on Tuesday, with the price briefly breaking below before snapping back into the close.
Given the scale of the decline and the leverage embedded in many Asian equity markets, the risk of margin calls and distress selling in early trade cannot be ignored. How the price behaves around 68,782 may offer an important clue as to whether the correction has run its course or has further to go.
RSI (14) continues to show bearish divergence, with momentum making lower highs as the price pushed to fresh records. MACD also appears close to crossing below its signal line, albeit while remaining in positive territory. Together, they provide a pair of cautionary signals for bulls.
If the price were to break decisively below 68,782, traders could consider establishing shorts with a very tight stop above the level, targeting 67,000 initially, followed by 65,900 and potentially the uptrend from late March, which currently sits a little above 65,000.
Conversely, if 68,782 continues to repel bearish probes, traders could consider establishing longs above the level with a very tight stop beneath, targeting a retest of the record high at 73,520.
Of the two, the short side looks more attractive from a tactical perspective near-term given the magnitude of the recent advance and the warning signs from momentum. However, the broader bullish trend remains intact. The uptrend has not been broken and the key medium and longer-term moving averages continue to point higher with a positive slope.
Good luck!
DS  Long
Long
 Long
Long
UNIUSDT: local squeeze with $3.50 destinationThe Macro Picture 🗺️
One week ago, the read on this chart called for a reclaim of the $3.00 supply flip and a push toward $3.50. UNI delivered cleanly — and then overshot. Price drove from $2.95 through $3.50 and tagged $3.70 on June 18 before rolling into a controlled correction: a 50% retracement of the V-recovery leg with RSI cooling from a peak of 65 to the 45 midline. Price now sits at $2.95, retesting the same supply flip zone bears defended on the way up — but this time from above, where the role has flipped to support. The structure is in a local squeeze, compressing volatility before the next directional resolution.
The Setup ⚙️
The Validation: The June 16 reclaim of $3.00 ignited an impulsive leg that not only hit the $3.50 target but extended 6% beyond it to $3.70. That overshoot confirmed the regime change call — the capitulation at $2.40 was a sweep, not a continuation signal, and the broken Range Floor that flipped to ceiling on the way down has now flipped back to support on the way up.
The Squeeze: The pullback from $3.70 has compressed price into the $2.85–$3.00 absorption pocket, where every dip below $3.00 has been bought within hours. RSI sitting on the 50 midline with the signal line beginning to curl upward signals momentum reset rather than reversal — the textbook profile of a continuation squeeze, not a top.
The Support Flip: The $2.90–$3.00 zone that capped the bounce on June 8 now serves as the high-confluence floor of the next leg. A clean defense here with absorption candles and no daily close below $2.85 keeps the bullish structure intact and reloads the path toward $3.50.
The Roadmap: Primary target sits at $3.50 — as indicated by the white projection, the path of least resistance points toward the mid-resistance reclaim once the squeeze resolves upward, with $3.70 as the extension level if momentum carries. Invalidation: a sustained daily close back below $2.85 would invalidate this bullish thesis and reopen the path toward the capitulation low.  Long
Long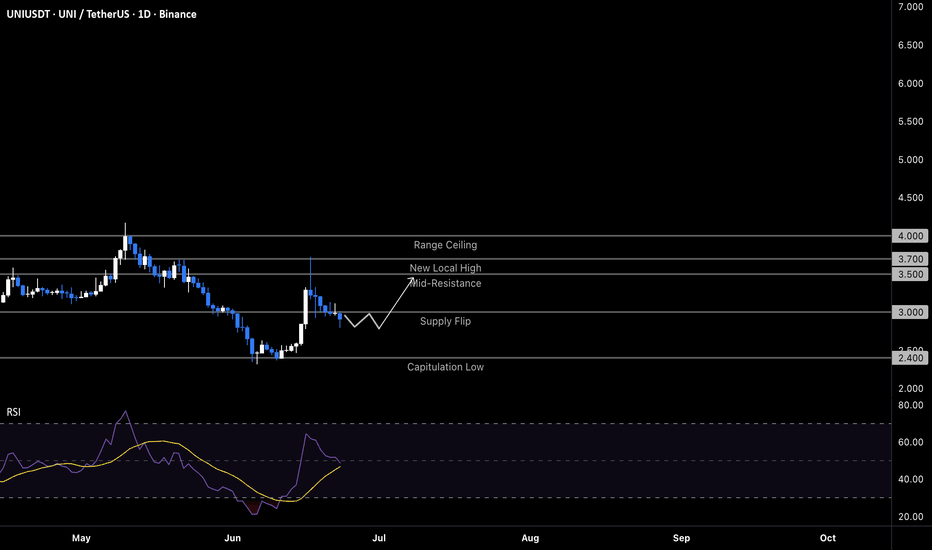
 Long
Long
 Short
Short
 Short
Short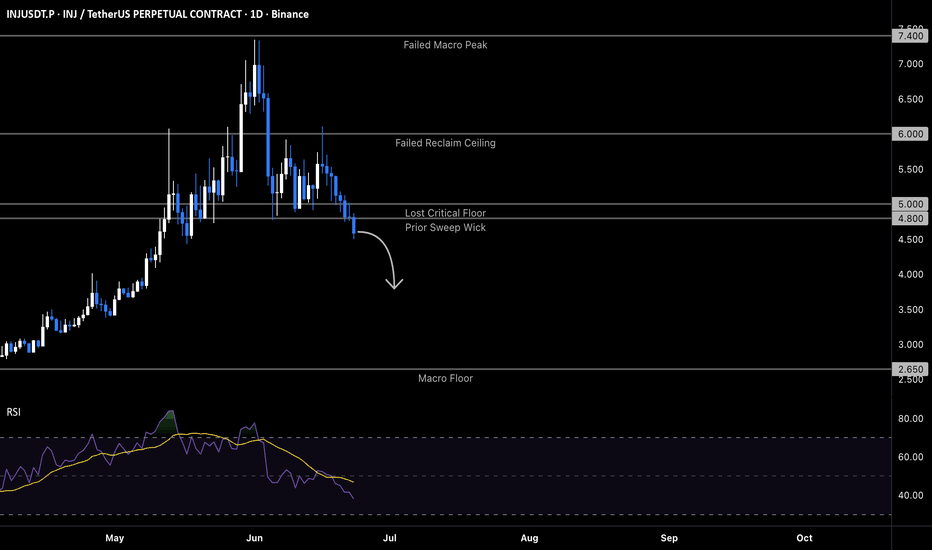
 Short
Short