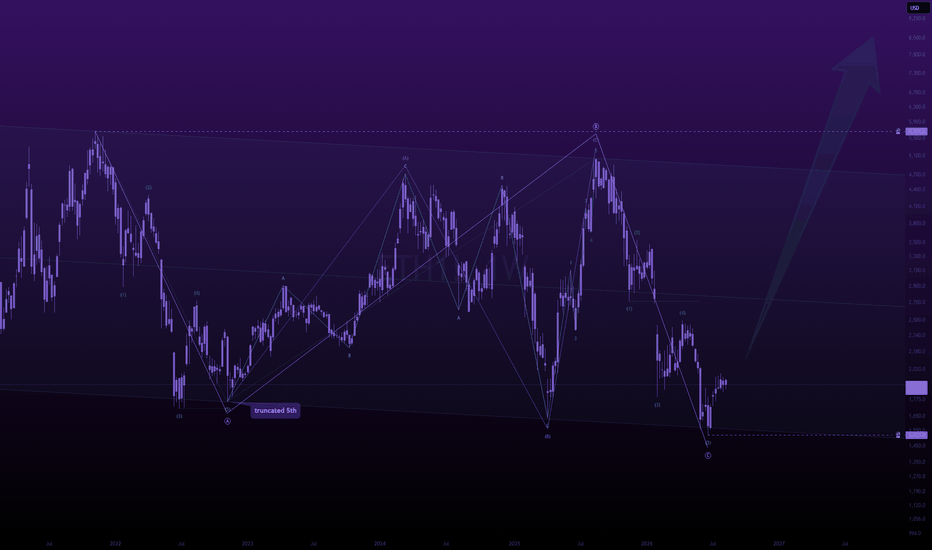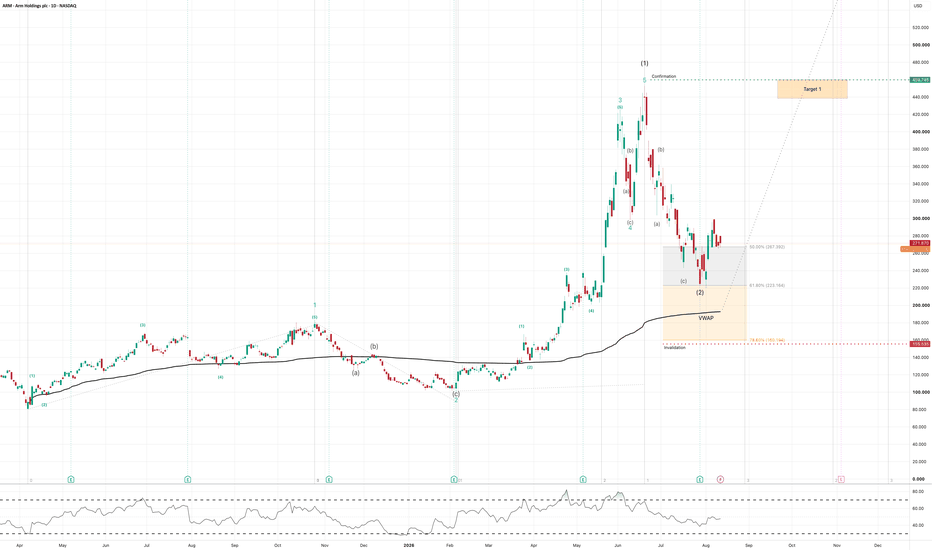
ARM – Elliott Wave Setup: Wave (2) Meets VWAP SupportARM remains technically very interesting from an Elliott Wave perspective. The larger bullish impulse appears to be intact, while the current correction is developing as a potential Wave (2) before the next major expansion phase.
The advance from the February low can be counted as a completed five-wave structure into the June high near $460, forming Wave (1) . Since then, ARM has entered a corrective sequence that is currently best interpreted as an ABC correction .
The most important feat
Elliott Wave
GBPUSD -- Elliot Wave Triangle PatternAfter the 5 Wave Impulsive Move (Wave 1 in Blue) to the upside, GBPUSD started to provide some relief and took sideways from the start of the year.
As marked in chart, after Wave 1, the pair has started the corrective 3 Wave movement to form Wave 2. Wave A is completed and Wave B is a triangle which is near end or ended. After this we are going to see a 5-wave Impulse Move to the downside for the formation of Wave C which will mark the completion of corrective Wave 2 in the blue.
As per the tr
eth1! finished correctiongood eve'
we've been projecting ether to slingshot toward the highs over the next year, and i wanted to share this important chart with you.
this is CRYPTOCAP:ETH futures, showing a perfectly completed simple zigzag correction. textbook completion, 5, 3, 5.
---
if we're correct, the next move up will be violent and unexpected by most.
it will break all time highs, then enter price expansion territory.
---
we project an average target of $42k for this run, but even that remains a relativ
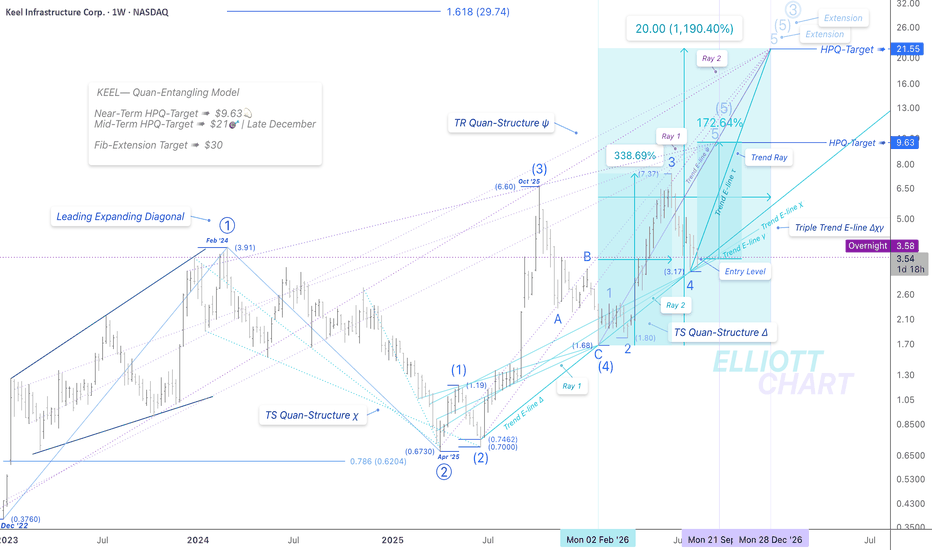
KEEL | WeeklyNASDAQ:KEEL — Quan-Entangling Model
Quan-Analysis | Projecting the Impulsive Advance of Minor Wave 5 📈
KEEL surged 12.46% intraday, with the weekly bar now stabilized at the confluence support zone of the defined Triple Trend E-line Δχγ , as anticipated.
From the current level, an impulsive advance of approximately 172.6% 📈 continues to be projected, while the current price zone may still be respected as a potential entry region, as depicted earlier.
The T ransition- R esistance Q ua
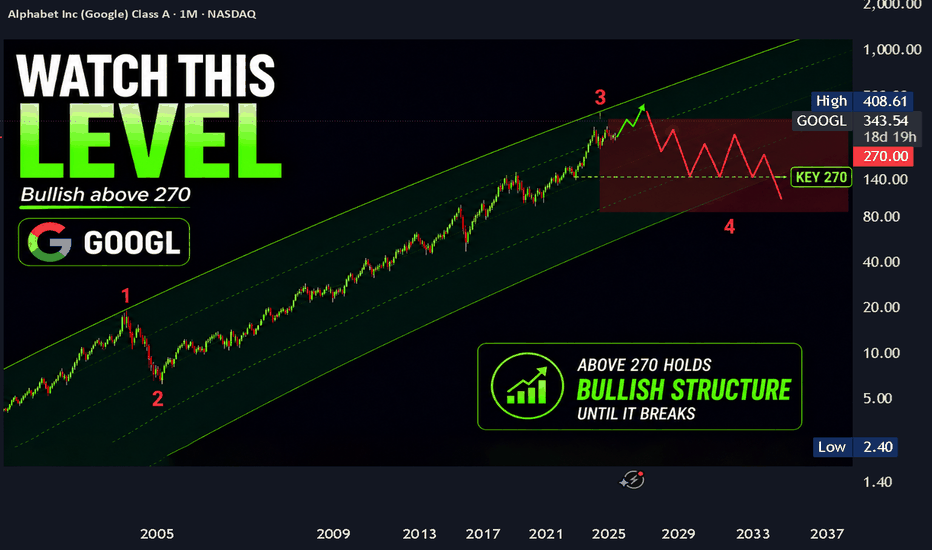
Google Stock Analysis (GOOGL): Bullish Above $270Google stock remains in a long-term uptrend, but the current GOOGL structure is already in a late stage.
This long-term technical analysis of Alphabet focuses on two areas that matter most now: the broad $300-$600 range where the current Elliott Wave advance may finish, and the $270 level that would invalidate the bullish structure I am tracking.
Alphabet has been moving inside this rising long-term channel since around 2010. Price remains inside it today, so the broader trend is still u
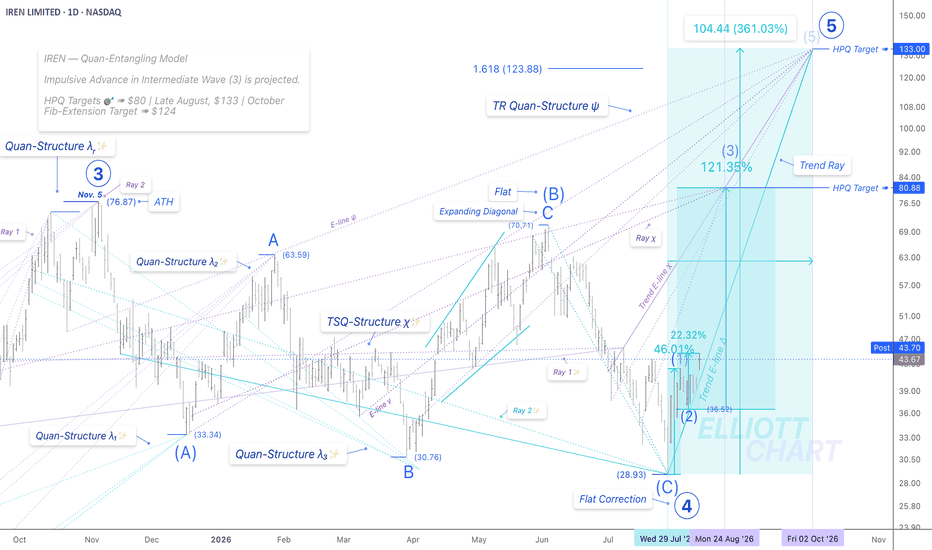
IREN | DailyNASDAQ:IREN — Quan-Entangling Model
Quan-Analysis | Launching from the Defined Entry Level 📈
Price leaped above the projected entry level , first defined on Aug. 3, surging 22.32%📈 from that E-level ➤ $ 36.5 —and over 68% from the origin of the illustrated Trend Ray , respecting the initiating advance of Intermediate Wave (1).
With price pausing precisely at Trend-Support E-line Δ , as anticipated, the defined Trend Ray remains intact and is now quite well validated.
The Ray χ continues
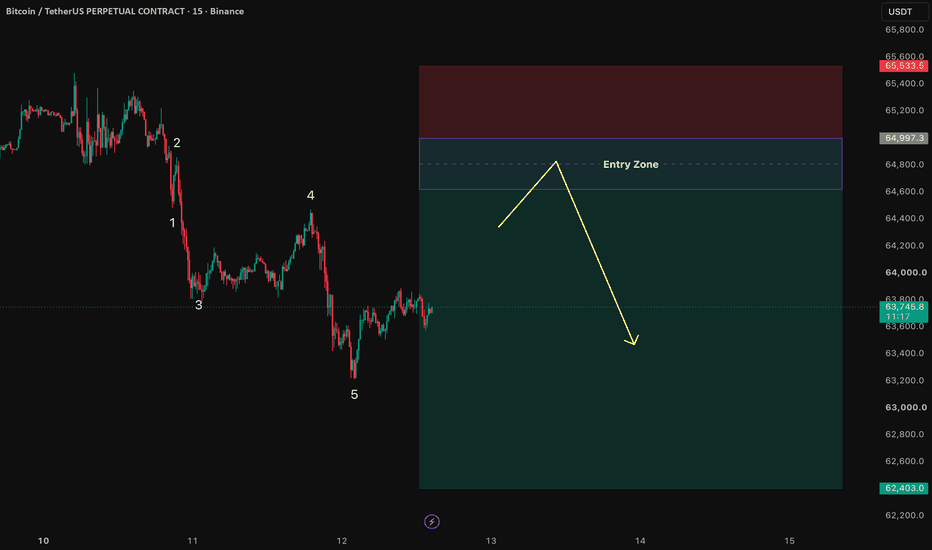
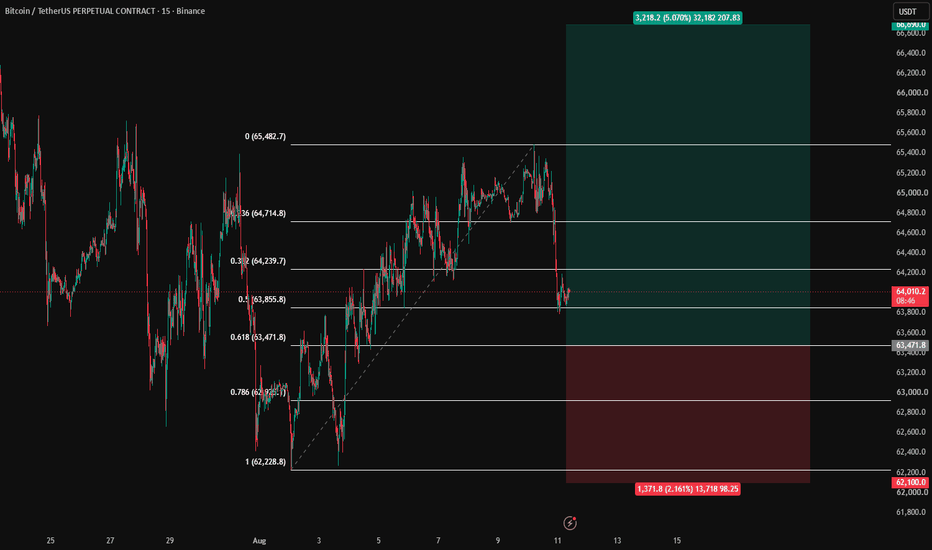
Bitcoin by Ace: Elliott Wave Trading 8/12🔴🔴 SELL #BTCUSD 🔴🔴
✅ Entry: 64992.6 - 64626.3
🎯 TP: 62371 - 60989 - 58752
🛑 SL: 65530
signal score: 48/60
Wave 1 Down Completed
The initial decline from 65,462.40 → 63,225.65 measured 2,236.75 points, retracing approximately 70.0% of the previous bullish move.
Elliott Wave Count
Wave i: 64,507.83 — 954.57 pts
Wave ii: 64,877.97 — 38.8% retracement
Wave iii: 63,802.92 — 1,075.05 pts
Wave iv: 64,486.21 — 63.6% retracement
Wave v: 63,225.65 — 1,260.56 pts
The wave structure satisfies the main
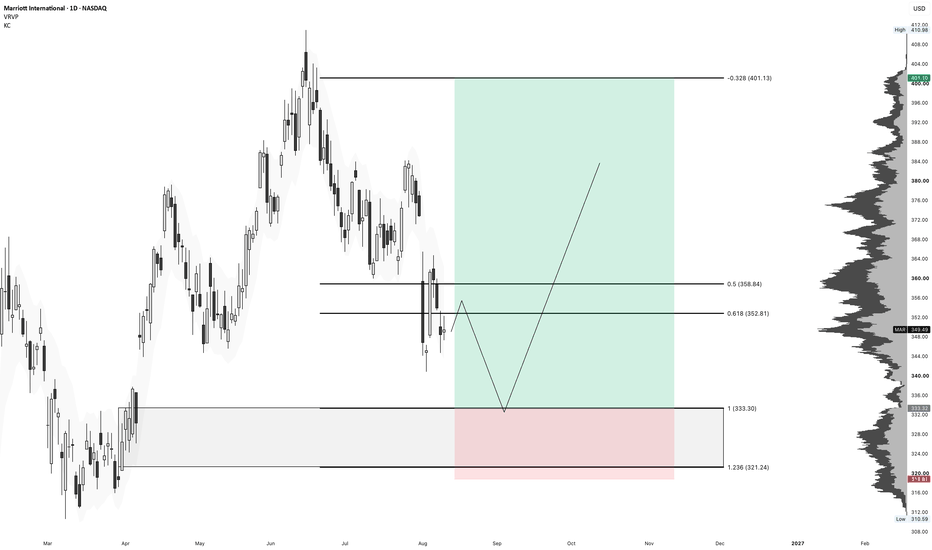
Marriott (MAR) – Buy Signal AlertMAR is approaching a key Fibonacci support zone, where I'm looking for buyers to step in.
Entry: $333.30
Stop Loss: $321.24
🎯 Targets
Take Half: $358.84
Final Target: $401.13
Once price reaches $358.84, move your stop loss to breakeven and let the remaining position run toward the final target.
This setup offers an attractive risk/reward if support holds. As always, wait for confirmation before entering the trade.
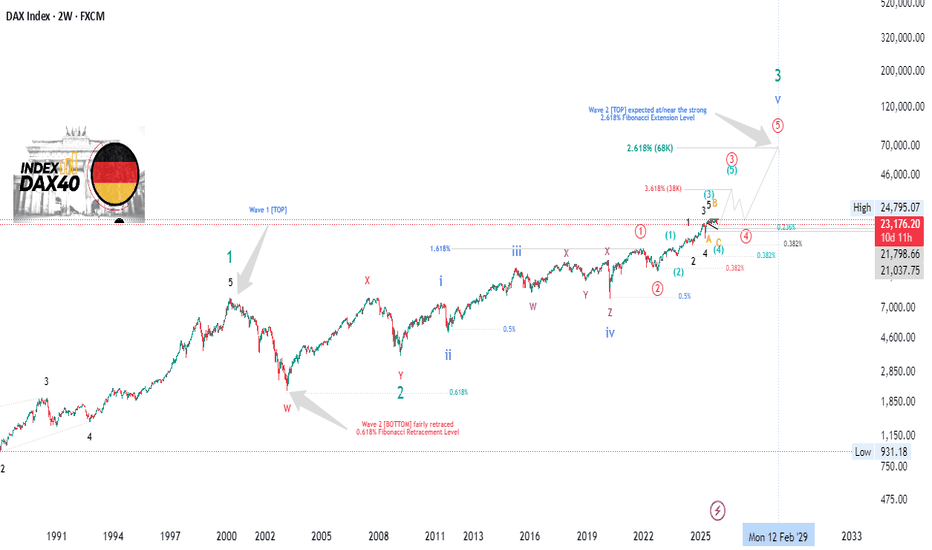
Is the DAX Preparing for a Monster Rally? The Structure Says So.The DAX continues to follow a well-defined Elliott Wave structure across the higher time frames. Following the completion of Wave 1 at the prior cycle top, the subsequent corrective phase retraced efficiently into the 0.618 Fibonacci region, establishing a structurally sound Wave 2 low. Since then, price has progressed through a multi-year impulsive advance, with internal subdivisions aligning cleanly with higher-probability Fibonacci extensions.
Current price action is positioned wit
US CPI Takes Center Stage as Markets Brace for Higher VolatilityMorning traders! The market remains relatively slow, but volatility could pick up today as US CPI inflation data takes center stage.
Oil extended its rally as the US and Iran appeared to harden their positions over negotiations involving the Strait of Hormuz, despite Pakistan's defense minister saying the two sides are close to reaching an agreement. Higher oil prices are keeping investors cautious as markets weigh geopolitical risks against uncertainty over the Federal Reserve's next rate mov
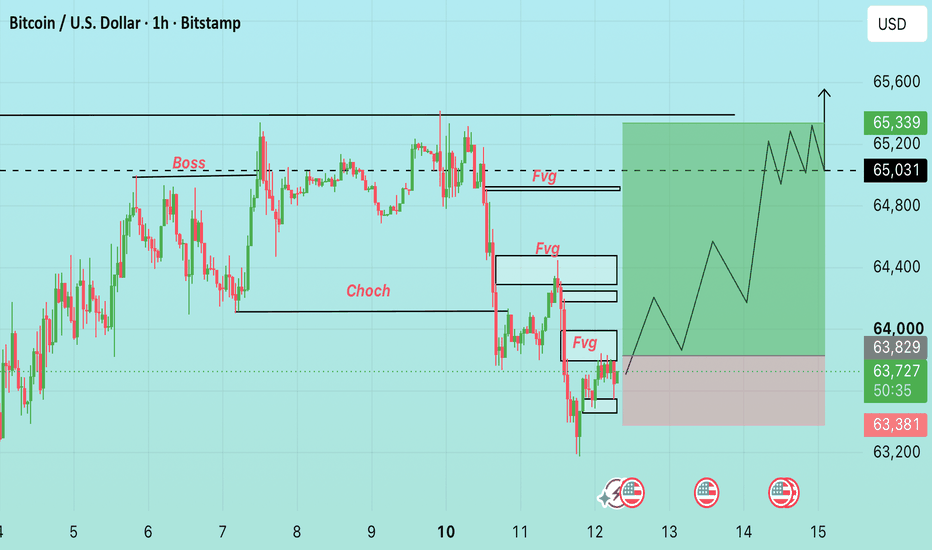
Bitcoin \(BTC/USD\) 1H — Market Structure & FVG AnalysisThe 1H structure shows a recent CHoCH after the previous bullish sequence, followed by a sharp downside move and a reaction from the lower demand area. Several FVG zones remain visible above the current price and may serve as areas of technical interest during future price movement.
🔹 Current Price: ~63,706
🔹 Key Reference: 65,031
🔹 Upper Resistance Area: ~65,200–65,400
🔹 Intermediate FVG Zones: ~64,000–64,500
🔹 Lower Structure Area: ~63,300–63,800
From a pure technical-analysis perspective, p
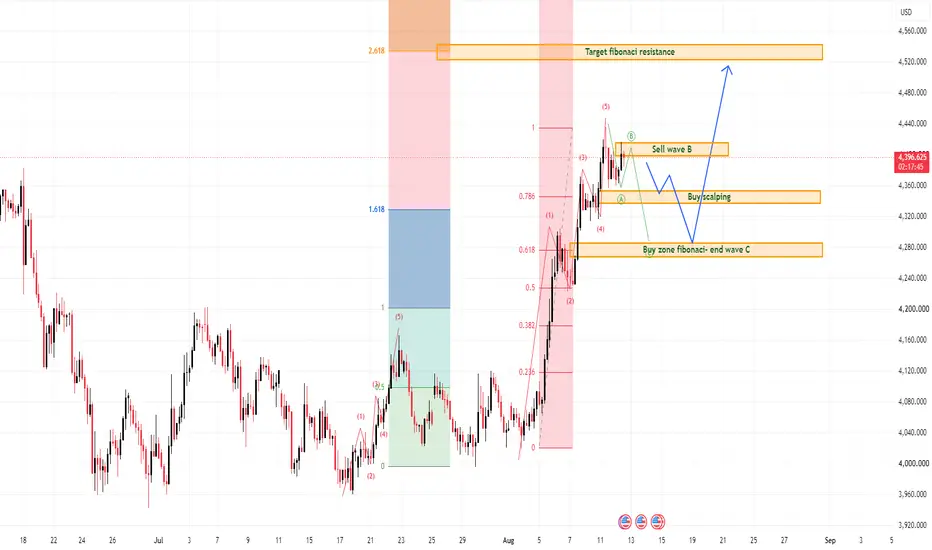
XAUUSD: Bullish Trend Still Holds Above 4,280
Gold is still holding a strong bullish structure after the sharp recovery from the lower accumulation base. From Kelly’s view, the current chart suggests that XAUUSD may be moving through a short-term ABC correction before continuing higher towards the Fibonacci resistance target.
The key idea is simple: gold remains bullish overall, but price may need a healthy pullback before the next upside wave becomes cleaner.
⟡ Market structure
The chart shows gold made a strong impulsive move from th
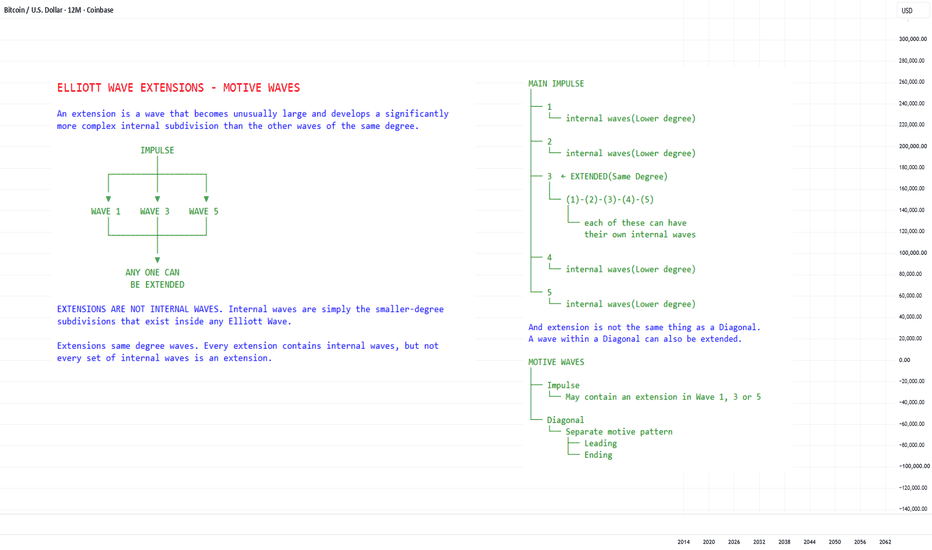
Elliott Wave Extensions – Motive WavesAn extension occurs when one of the motive waves becomes unusually large and develops a significantly more complex internal structure than the other waves of the same degree. In an Impulse, an extension can occur in Wave 1, Wave 3, or Wave 5.
It is important to distinguish an extension from internal waves. Internal waves are simply the lower-degree subdivisions that exist within an Elliott Wave, whereas an extension is a wave that becomes disproportionately large and contains additional interna
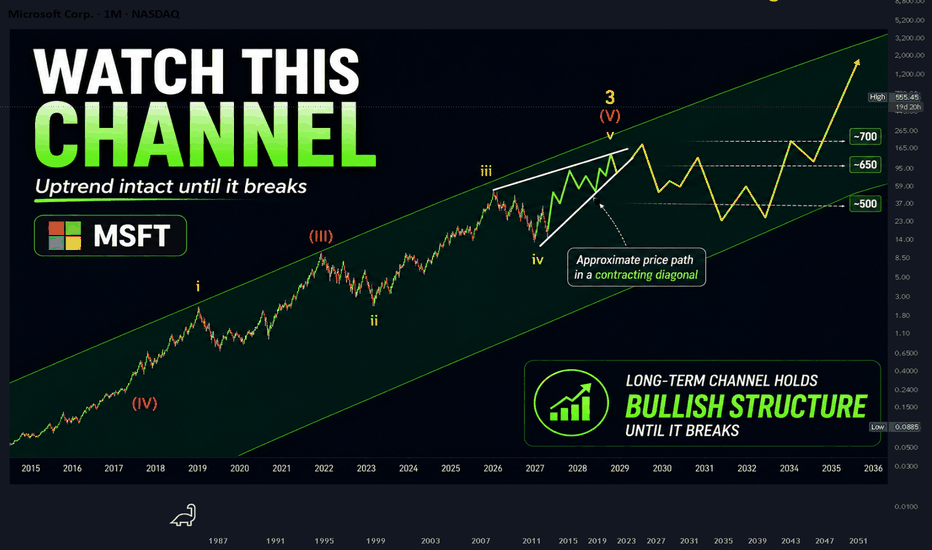
Microsoft Stock: Is the Long-Term Uptrend Near Its Final Stage?Microsoft Stock: Is the Long-Term Uptrend Near Its Final Stage?
Microsoft remains inside the long-term rising channel that has guided the stock since around 2010. As long as this structure holds, my broader view remains bullish and I still expect room for price to move higher.
The more important question is what stage of that rise Microsoft is in now. My current Elliott Wave count suggests that the long-term advance is already well developed and may be approaching its final section.
The
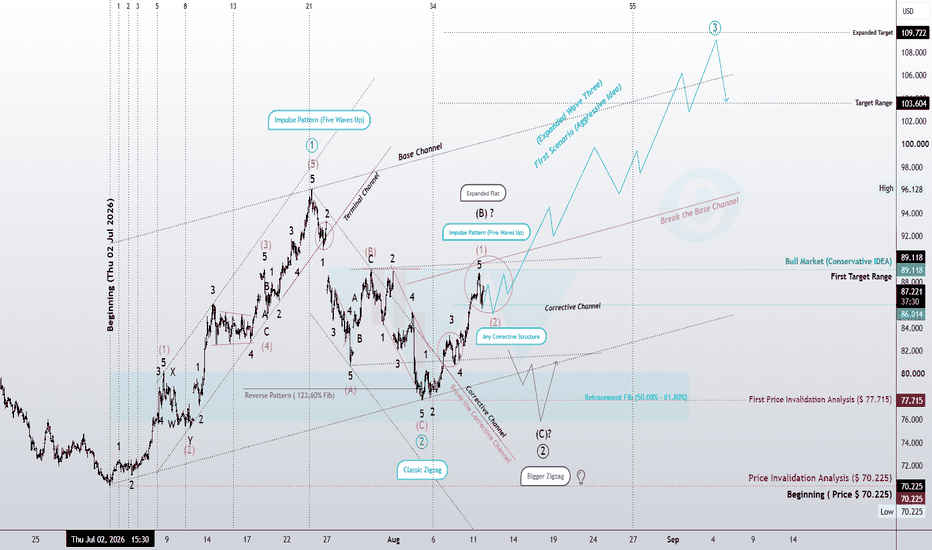
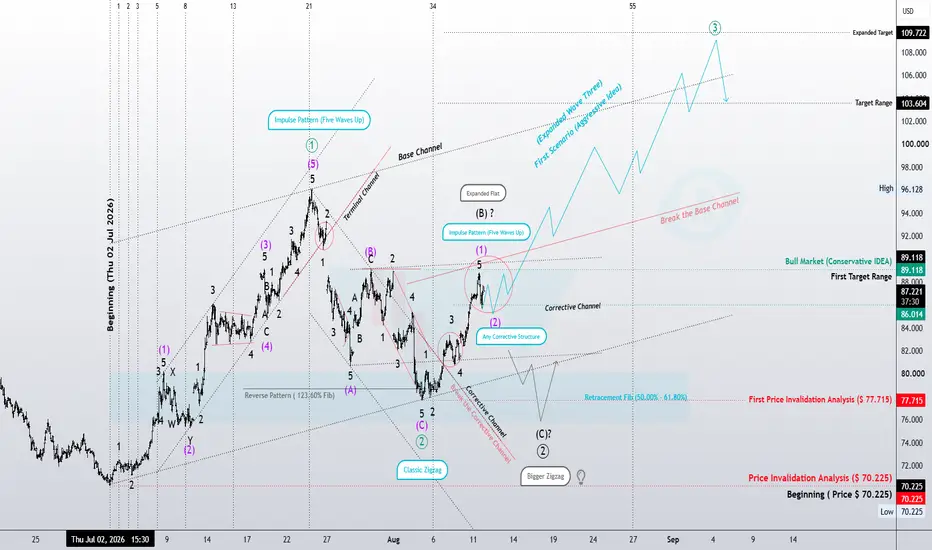
Wave III?Crude Oil: Wave III?
From an Elliott Wave perspective, the move from the 70.225 low to approximately 96.128 appears to have developed as a complete five-wave Impulse, which can be considered Wave (1) of a higher degree.
The market then entered a corrective phase that appears to have completed around the 77–80 area, with the structure remaining consistent with a Classic Zigzag. From this point, the primary focus shifts toward the developing bullish structure.
The recent advance from the correc
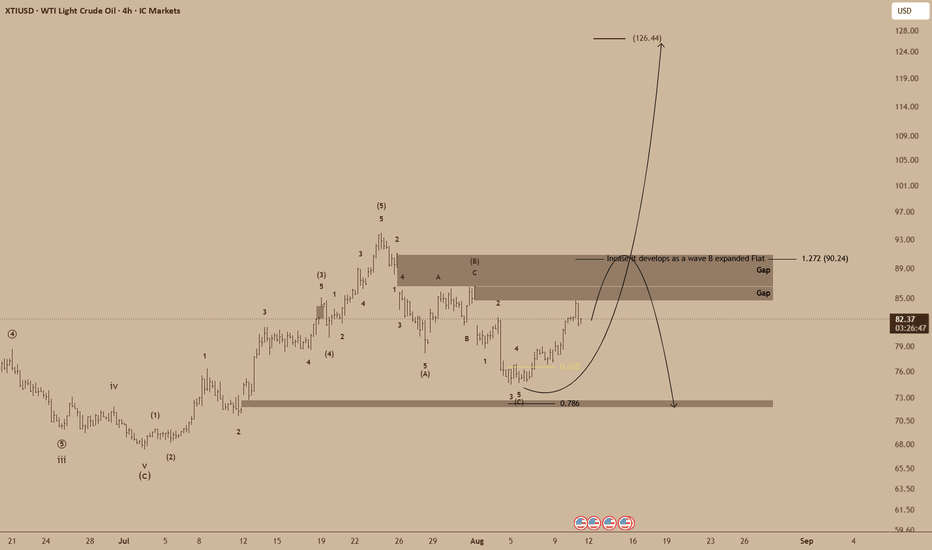
Ready For A Rally For Crude Oil?Crude oil may be preparing for a much larger impulsive advance. After completing the previous corrective structure near the $72–73 region, the current price action suggests that a new bullish Wave 3 may be developing, with a potential long-term target around $126.44.
The current 4-hour structure presents an interesting setup.
The previous decline into the $72–73 area completed the corrective structure we were tracking. Since then, crude oil has established a series of higher highs and higher lo
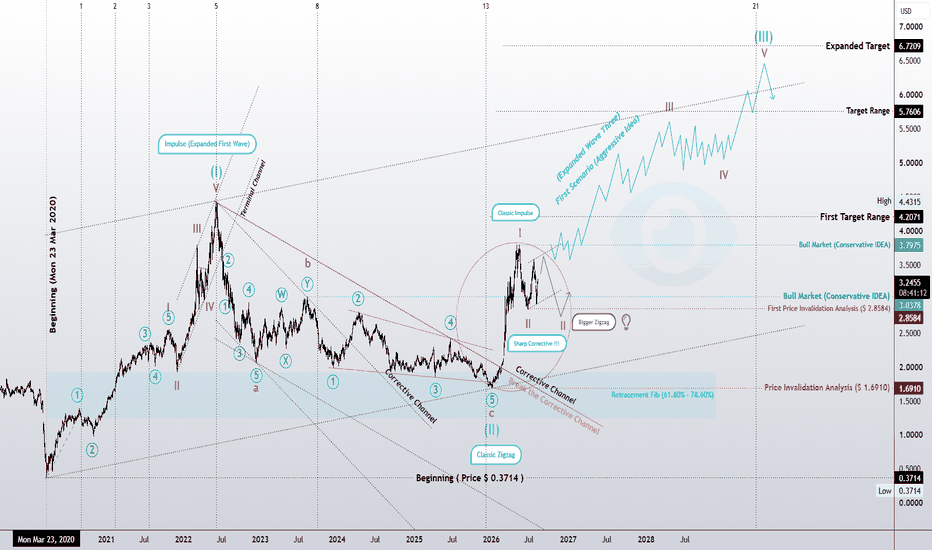
RBOB Gasoline | Is Wave III About to Begin?Under the aggressive scenario, we consider Waves (I) and (II) to represent the largest degree in the current count. Following a major correction in the previous cycle, the market entered a new bullish phase. From our perspective, the price action at the beginning of 2026 can be interpreted as a sharp and fast Classic Impulse, potentially forming Wave I of this new degree.
At present, Wave II has reached the vicinity of Wave 4 of the initial impulse. This is an important structural area and coul
Gold at $4,355: Breakout or Pullback?
Gold remains structurally bullish on H1, but price is now trading directly beneath a major external high at 4,370.607.
That makes the current area interesting — but not necessarily attractive for chasing longs.
📊 H1 Structure
The bullish structure remains intact:
Higher highs + higher lows
Price holding above the rising support trendline
Previous bullish displacement remains valid
Price is approaching external buy-side liquidity
Current location = premium
The key level is 4,370.607.
A cle
Hyperliquid Pullback Could Set Up the Next RallyHyperliquid (HYPEUSD) remains one of the best-performing assets in the crypto market, continuing to show relative strength despite the recent slowdown. While the price action has lost some momentum in the short term, the broader bullish structure remains constructive.
The current price action may be completing wave “c” of an abc correction within a higher-degree wave 4. If this interpretation is correct, the ongoing weakness could represent the final stage of the corrective phase before the nex