$SPCX: Wave 4 consolidationNASDAQ:SPCX hit the bottom in the $104 range. Looks like it has completed Wave 3 and is now in Wave 4 consolidation. Wave 2 was a sharp correction that corrected almost the entire Wave 1, which can happen for Wave 2.
I expect Wave 4 to retrace 38.2% of the prior move, which is $132 range. A sideways triangle correction is very common for Wave 4 before another wave higher to complete Wave 5. Wave 5 targets $150+.
I've sold put options with strikes from 130-139 at $3.5 premium, with a breakev
Elliott Wave
US Dollar Index (DXY) Extends Weakness as Bearish Trend ResumesAs expected this week, the US Dollar Index (DXY) continues to weaken as US Treasury bonds recover on growing expectations that the Federal Reserve will keep interest rates unchanged. At the same time, strong gains in global equities are reinforcing a risk-on environment, further reducing demand for the safe-haven US dollar.
From an Elliott Wave perspective, DXY appears to have completed a projected abc irregular flat, or alternatively a more complex wxy correction, in wave "iv". The latest down
Bitcoin — Wave (IV): Simple Zigzag or Complex Correction?In the aggressive scenario, the current structure can be interpreted as Wave (IV) of a larger degree. Based on the current wave count, Wave (IV) is developing as a Simple Zigzag with a 5-3-5 structure, and we are currently in the green Wave (2). The peak of Wave B represents the invalidation level for this count.
If the current structure completes as a Simple Zigzag, lower price levels, including the $30K–$40K region, may become relevant. However, the structure itself must determine the outcome
AUD/USD Daily | Inside the Wave StructureOn the daily chart, our primary focus is the structure developing from the starting date and price marked on the chart.
At this stage, the simplest interpretation is the development of a 5-3-5 Zigzag. However, as price continues to evolve, the structure could still develop into a Sideways Correction or a more complex corrective pattern.
For now, the objective is not to determine the entire structure in advance. Instead, we are focusing on how each wave develops internally.
🟢 Wave A
Wave A ca
MRVL – Elliott Wave Analysis: Primary ABC Correction Marvell Technology is currently at a particularly interesting point from an Elliott Wave perspective. The strong advance into the June high around $332 completed a clean five-wave impulsive structure and can therefore be interpreted as a higher-degree Wave (1) .
The key question now is whether the subsequent correction has already completed — or whether one final corrective leg is still missing.
This creates two valid Elliott Wave scenarios.
Primary Count – Wave (2) Still in Progress
In
Gold just completed a double zig zag full Elliott Wave cyclewhat buyers are still missing
gold breakout upper line of channel with such a strong force that it didn't even retest upper line
One complete Elliott Wave cycle has now finished in the form of a Double Zigzag.
Despite cooler-than-expected NFP, CPI, and PPI data, the market continues to price in rate-hike fear rather than rate-cut hope. Biggest reason gold falling again from 50% retracement of WXY wave
Until the possibility of rate cuts returns in a meaningful way, the flood of buyers simply wil
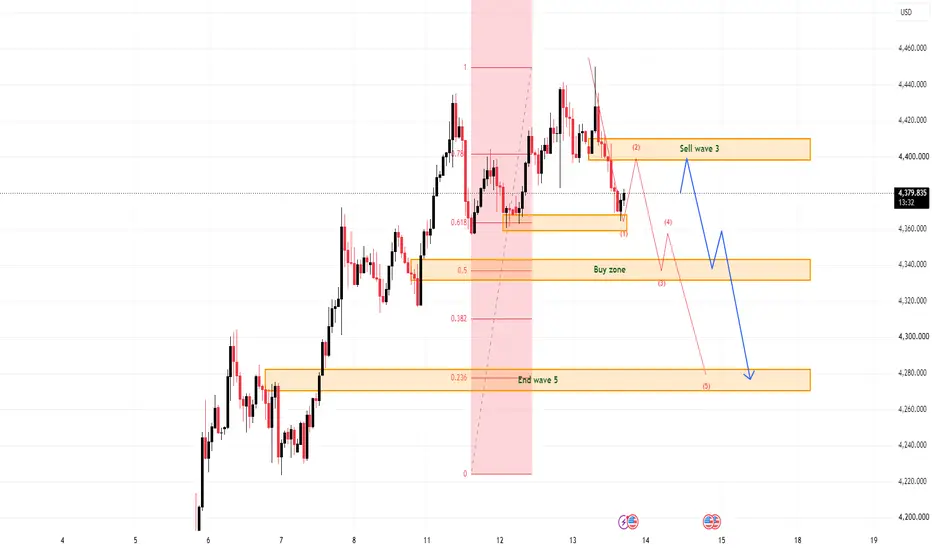
XAUUSD: Bearish Elliott Setup Below 4,410
Gold is showing signs of short-term weakness after failing to extend cleanly above the upper reaction area. From Kelly’s view, the current chart suggests that XAUUSD may be forming a bearish Elliott structure, with price now preparing for a possible continuation lower if the Sell wave 3 zone continues to hold.
The key idea is simple: gold may still rebound slightly, but the structure favours downside continuation while price remains below resistance.
⟡ Market structure
The chart shows gold
NVDA back to 180 or lowerNVDA hit my 78% retracement of the leading diagonal for (1) of (C) today in 3 waves.
Wave C of (2) has a solid 5 waves and the rejection was off the 127% of that w-4.
I'm now looking for W-(3) down for C. TBD is if a W-1 of W-(3) will happen. Landmine of earnings on August 26th. Hopefully tit drops like AMD did but maybe that will be the W-2 of (3)? We'll see!
Also have daily bearish divergence between wave 3 and 5 which aligns perfectly.
Gold Mid-Term Elliott Wave Analysis | August, 2026 onwardsWrap-up:-
As discussed in my previous Gold Analysis, Gold appears to have completed a Major Wave 1 at $5598 . The market is now undergoing Major Wave 2 , which is developing in a W-X-Y corrective structure .
Current Elliot Wave Structure
With this correction,
Wave W concluded at $4402 .
Wave X is currently unfolding.
Within Wave X :
Wave W concluded at $5419 .
Wave X concluded at $3942 .
Wave Y
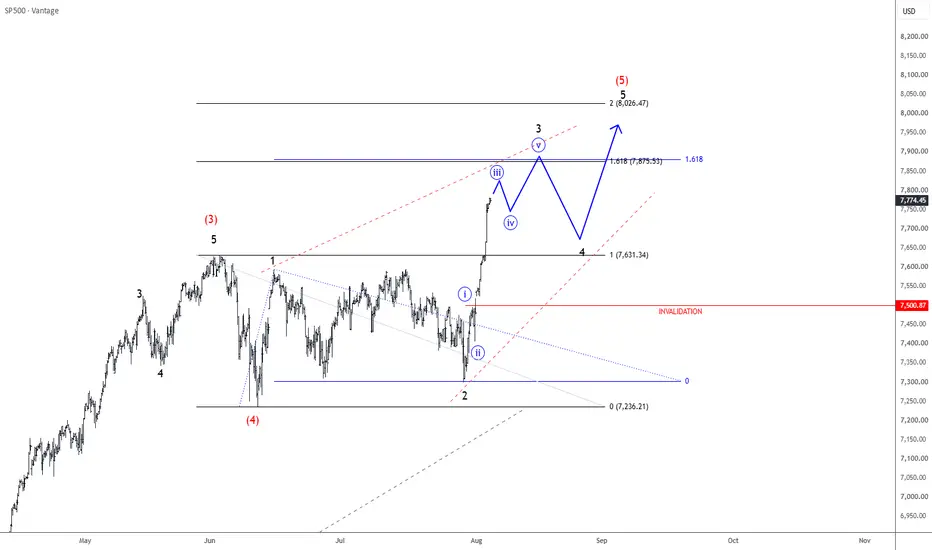
SP500 Extends Rally Toward New Highs as Wave 3 ContinuesSP500 continues to show strong bullish momentum, rising sharply and impulsively at the start of August while decisively breaking above its previous all-time highs. The latest price action suggests that the index is extending its advance within wave 3 of a new five-wave bullish cycle, which is likely part of a larger higher-degree wave (5).
The current structure still favors further upside, with the ongoing move unfolding as a five-wave impulse. If this count remains valid, we could see a short-
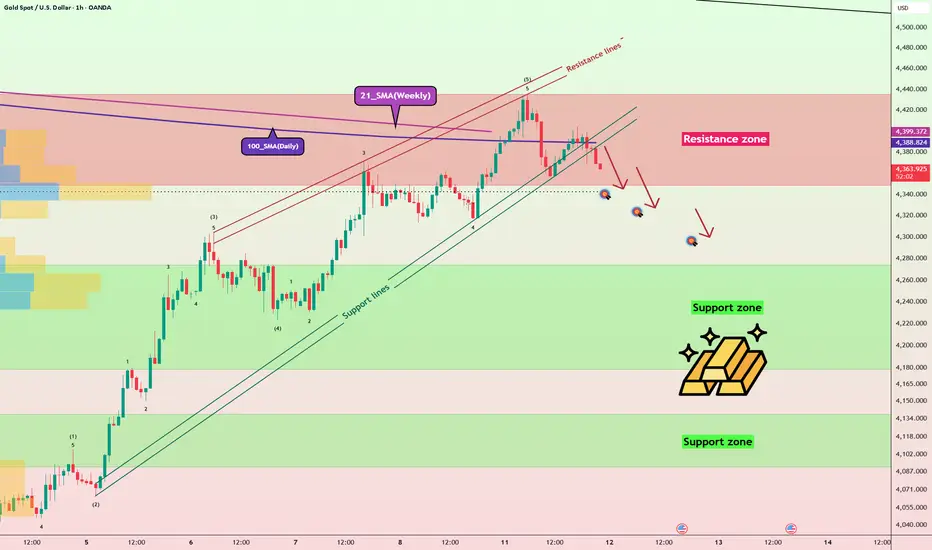
Gold Rejects Key Moving Averages: Is a Deeper Correction?Gold ( OANDA:XAUUSD ) has successfully broken below the Support Lines and recently tested the 100_SMA(Daily) and 21_SMA(Weekly).
However, the price failed to break above these key moving averages and started to decline with strong bearish momentum.
Can gold reclaim $4,400, or is a deeper corrective move already underway?
Technical Analysis
From an Elliott Wave perspective, gold appears to have completed its Primary Wave 5, suggesting that a broader corrective phase to the downside may now be
Solana (SOL): The Correction May Have Further to GoSolana may be approaching the end of its current corrective rebound, with the larger Elliott Wave structure still pointing toward another significant leg lower.
Looking at the daily chart, SOL is currently trading around $75.58 and appears to be developing a corrective Wave 2 following the initial decline from the 2025 highs. While the recent recovery has stabilized price, the structure does not yet provide enough evidence that the larger correction is complete.
--
The Current Wave Struc
XAUUSD M30: Ending Wedge Fakeout – Dual Scenario to 4320
📝 Main Content:
1. Fundamental Assessment
Gold prices continue to experience sharp volatility as profit-taking pressures intensify near record highs. Despite geopolitical uncertainties, the short-term bullish momentum appears exhausted as institutional money shows signs of redistribution, paving the way for a deeper technical correction.
2. Technical Breakdown
On the M30 timeframe, XAUUSD has completed a classic Ending Wedge / Ending Diagonal structure across 5 distinct waves:
Liquidity Swee
ARM – Elliott Wave Setup: Wave (2) Meets VWAP SupportARM remains technically very interesting from an Elliott Wave perspective. The larger bullish impulse appears to be intact, while the current correction is developing as a potential Wave (2) before the next major expansion phase.
The advance from the February low can be counted as a completed five-wave structure into the June high near $460, forming Wave (1) . Since then, ARM has entered a corrective sequence that is currently best interpreted as an ABC correction .
The most important feat
GBPUSD -- Elliot Wave Triangle PatternAfter the 5 Wave Impulsive Move (Wave 1 in Blue) to the upside, GBPUSD started to provide some relief and took sideways from the start of the year.
As marked in chart, after Wave 1, the pair has started the corrective 3 Wave movement to form Wave 2. Wave A is completed and Wave B is a triangle which is near end or ended. After this we are going to see a 5-wave Impulse Move to the downside for the formation of Wave C which will mark the completion of corrective Wave 2 in the blue.
As per the tr
eth1! finished correctiongood eve'
we've been projecting ether to slingshot toward the highs over the next year, and i wanted to share this important chart with you.
this is CRYPTOCAP:ETH futures, showing a perfectly completed simple zigzag correction. textbook completion, 5, 3, 5.
---
if we're correct, the next move up will be violent and unexpected by most.
it will break all time highs, then enter price expansion territory.
---
we project an average target of $42k for this run, but even that remains a relativ
KEEL | WeeklyNASDAQ:KEEL — Quan-Entangling Model
Quan-Analysis | Projecting the Impulsive Advance of Minor Wave 5 📈
KEEL surged 12.46% intraday, with the weekly bar now stabilized at the confluence support zone of the defined Triple Trend E-line Δχγ , as anticipated.
From the current level, an impulsive advance of approximately 172.6% 📈 continues to be projected, while the current price zone may still be respected as a potential entry region, as depicted earlier.
The T ransition- R esistance Q ua
Google Stock Analysis (GOOGL): Bullish Above $270Google stock remains in a long-term uptrend, but the current GOOGL structure is already in a late stage.
This long-term technical analysis of Alphabet focuses on two areas that matter most now: the broad $300-$600 range where the current Elliott Wave advance may finish, and the $270 level that would invalidate the bullish structure I am tracking.
Alphabet has been moving inside this rising long-term channel since around 2010. Price remains inside it today, so the broader trend is still u
IREN | DailyNASDAQ:IREN — Quan-Entangling Model
Quan-Analysis | Launching from the Defined Entry Level 📈
Price leaped above the projected entry level , first defined on Aug. 3, surging 22.32%📈 from that E-level ➤ $ 36.5 —and over 68% from the origin of the illustrated Trend Ray , respecting the initiating advance of Intermediate Wave (1).
With price pausing precisely at Trend-Support E-line Δ , as anticipated, the defined Trend Ray remains intact and is now quite well validated.
The Ray χ continues
Bitcoin by Ace: Elliott Wave Trading 8/12🔴🔴 SELL #BTCUSD 🔴🔴
✅ Entry: 64992.6 - 64626.3
🎯 TP: 62371 - 60989 - 58752
🛑 SL: 65530
signal score: 48/60
Wave 1 Down Completed
The initial decline from 65,462.40 → 63,225.65 measured 2,236.75 points, retracing approximately 70.0% of the previous bullish move.
Elliott Wave Count
Wave i: 64,507.83 — 954.57 pts
Wave ii: 64,877.97 — 38.8% retracement
Wave iii: 63,802.92 — 1,075.05 pts
Wave iv: 64,486.21 — 63.6% retracement
Wave v: 63,225.65 — 1,260.56 pts
The wave structure satisfies the main
Marriott (MAR) – Buy Signal AlertMAR is approaching a key Fibonacci support zone, where I'm looking for buyers to step in.
Entry: $333.30
Stop Loss: $321.24
🎯 Targets
Take Half: $358.84
Final Target: $401.13
Once price reaches $358.84, move your stop loss to breakeven and let the remaining position run toward the final target.
This setup offers an attractive risk/reward if support holds. As always, wait for confirmation before entering the trade.