National Medical Care : Is the Long-Term Trend Still at Risk?TADAWUL:4005
📉 Distribution Above 150–220: Is the Long-Term Trend Still at Risk? ⚠️
Price spent a considerable period in a distribution range between 150 and 220, suggesting significant supply was being absorbed by the market.
The 200 EMA remained in a strong uptrend until October 2024. However, the subsequent breakdown below this key long-term moving average marked a significant shift in market structure.
The brief recovery above the 200 EMA may have acted as a bull trap, attracting long-term buyers before price resumed its downward movement. Meanwhile, short-term traders who recognized the failed recovery may have benefited from the resulting volatility.
🔍 What Should We Watch Going Forward?
The key question now is whether price can reclaim its long-term trend structure.
📌 First condition: Price must reclaim and sustain above the 200 EMA.
📌 Second condition: Sustained trading above the 130s would be necessary to rebuild the broader trend structure.
📌 Accumulation trigger: A sustained move back above the 150s could provide a stronger signal to begin gradually building positions.
⚠️ Bearish Scenario
Until these levels are reclaimed and held, the market may continue to experience sell-on-strength rallies.
If weakness persists, the next major downside zone could potentially be around 85.
📊 My View
For now, patience remains key.
I would prefer to see price reclaim the 200 EMA, establish itself above the 130s, and eventually regain the 150s before becoming more constructive on long-term accumulation.
Until then:
Rallies may continue to face selling pressure.
👀 Is the market forming a long-term bottom, or is this simply another relief rally within a broader downtrend?
Share your view below. ⬇️
#TechnicalAnalysis #TradingView #PriceAction #MarketStructure #Distribution #EMA200 #200EMA #MovingAverage #TrendAnalysis #SellOnStrength #BullTrap #BearishTrend #SupportAndResistance #SwingTrading #LongTermInvesting #StockAnalysis #TradingIdeas #TechnicalTrader #PriceActionTrading #MarketOutlook #Accumulation #Breakdown #TrendFollowing #Investing #StockMarket #WiSHFundManagement  Short
Short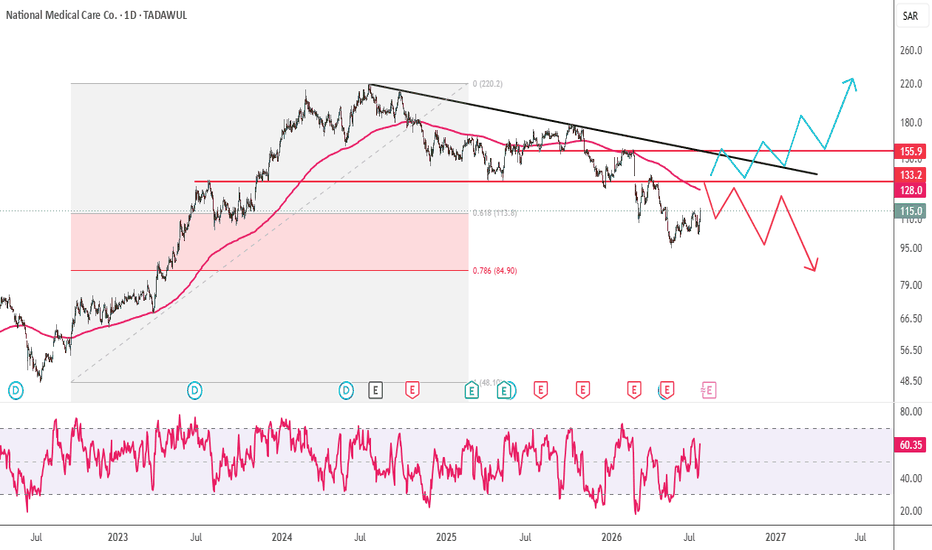
Bullish EMA Cross Trapped Under the 200: Fading the Bear RallyBINANCE:ETHUSDT
The 20 EMA just crossed above the 50 EMA on the daily — normally a bullish signal. But context kills it. Price is printing this crossover ~17% below the 200 EMA ($2,200), deep inside a macro downtrend that's been in control since late April.
This is a bear rally, not a trend reversal.
📍 Setup:
After dropping from $2,700 to $1,500 in May–June, ETH bounced sharply. The 20/50 crossover confirms short-term momentum — but it's happening under heavy overhead resistance with the 200 EMA acting as a ceiling miles above.
📍 Entry: $1,855 (current price, rejection zone)
🛑 Stop Loss: $1,950 (above recent swing high)
🎯 TP1: $1,665 (2:1 R:R)
🎯 TP2: $1,500 (June lows retest)
📊 Risk-to-Reward: 1:2 — 1:3.7
Why I'm bearish despite the crossover:
The 200 EMA at $2,200 is the trend filter — price isn't even close. The June bounce recovered 50% of the drop but stalled at $1,900 resistance. Volume is thinning on the push higher. Bullish crossovers under the 200 EMA have a high failure rate in macro downtrends — they trap longs before the next leg down.
Key support to watch: $1,750 (consolidation) → $1,500 (June low) → $1,380 if the floor breaks.
What's your read — relief rally or genuine reversal? Drop your analysis below. 👇
⚠️ Not financial advice. Always manage your risk.  Short
Short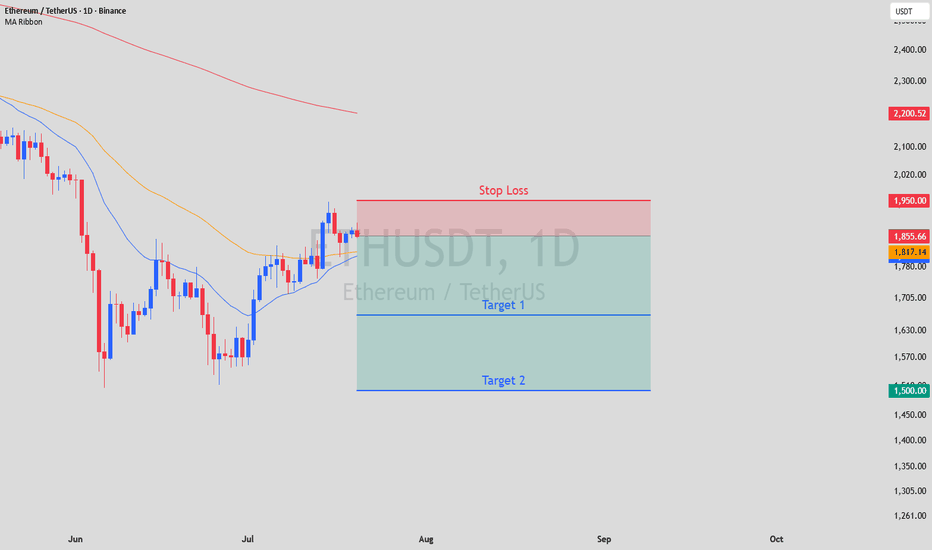
 Long
Long
 Short
Short
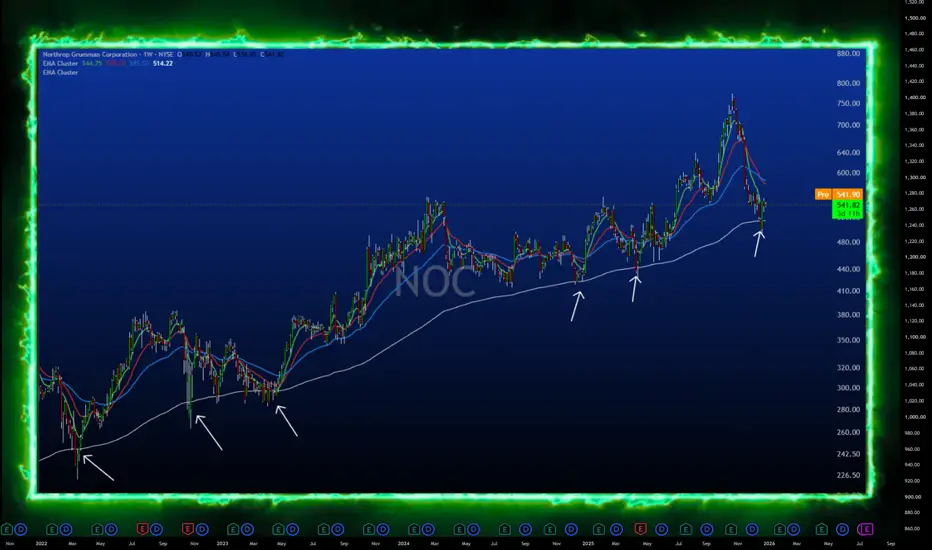
NOC trades at $541.82, sitting 0.8x weekly ATR from its 200-weekNOC trades at $541.82, sitting 0.8x weekly ATR from its 200-week EMA. That distance places it inside the defined buy zone (≤1x ATR from the 200W EMA), well short of extended (≤4x). The 200-week EMA is up 21% over the last two years and still rising.
Gate 1, trend A rising 200W EMA with price pulled back to touch it, not through it, is the structural definition of an intact long-term uptrend resting at support rather than breaking down. That's the first gate, and it's confirmed here.
Gate 2, momentum Confirm momentum is turning up from this level rather than still falling before treating this as a live entry. A pullback to trend support is not the same as a base already forming. Wait for the weekly candle to show the reset resolving before sizing in.
Gate 3, risk Entry zone: near $514. Scale-out targets, scaled to this asset's own ATR: TP1 → $677 (+32%) TP2 → $840 (+63%) TP3 → $1,100 (+114%)
Volatility context: 14-day ATR is $13.28, average daily range $11.95. A 1.5x ATR stop from entry is roughly $19.92 of room. No trailing stop until price reclaims and holds above the 50-week EMA, tightening risk before the trend has actually resumed adds unnecessary noise-driven stop-outs.
The seasonality overlay Averaged over the last five years, NOC has posted positive returns in July, August, September, and October, its strongest four consecutive months of the calendar year. That window is the one starting now, directly off this pullback to structural support. A trend-confirmed entry and a favorable seasonal window rarely line up in the same name at the same time. Both being true simultaneously here is the reason this is worth a chart rather than a passing mention.
Build in stages rather than one entry. No leverage. Assess Gate 1 first, then Gate 2, then size Gate 3 off current ATR, not a static stop distance.
Not financial advice. All commentary is for analytical purposes only.  Long
Long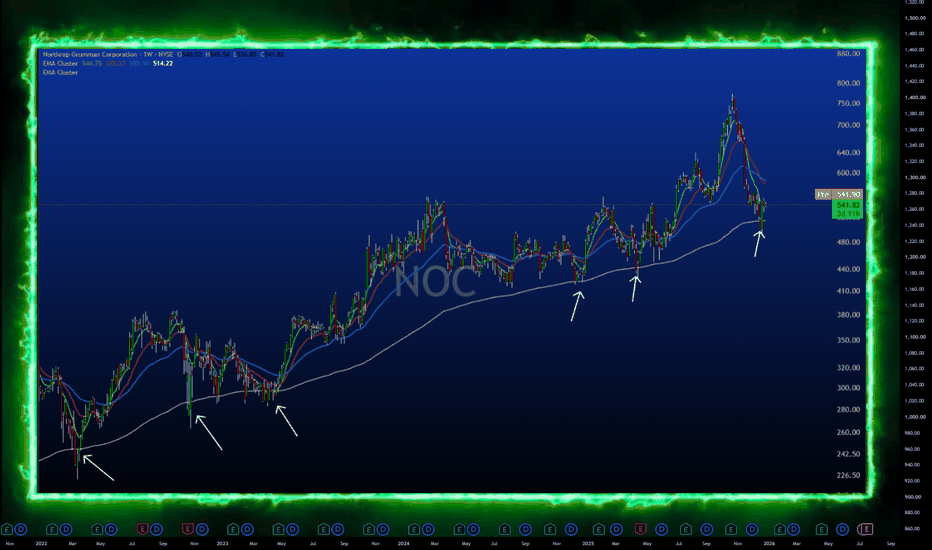
Euro / US Dollar ($EURUSD) Daily: Near-Term Relief Pullback Euro / US Dollar ( OANDA:EURUSD ) Daily: Near-Term Relief Pullback Toward 200-EMA Prior to Macro Fibonacci Expansion Leg
### 🇪🇺🇺🇸 Euro / U.S. Dollar ( OANDA:EURUSD ) Daily Technical Matrix (Ref: EURUSD_2026-07-08_09-41-20.jpg)
We are releasing a dual-horizon tactical brief on the EURUSD currency cross on the Daily (1D) interval. While the high-timeframe structural regime remains heavily anchored in a bearish markdown model, the pair is currently signaling near-term internal deceleration, creating a compelling two-phase execution setup.
The cross is consolidating near critical historical levels today, trading flat at **1.14076 (-0.03%)**, holding just above the local 0.236 Fibonacci retracement node.
---
### 🔍 Phase 1: The Tactical Relief Rally Scenario (The Mean Reversion)
Before the major macro extension targets can be unlocked, price action displays a strong likelihood of generating a brief buy-side liquidity hunt:
* **The Counter-Trend Target:** Our immediate technical playbook anticipates a potential corrective bounce aiming for the **1.35600 – 1.15600 structural corridor**.
* **Dynamic Resistance Confluence:** This targeted rebound zone lines up perfectly with the overhead institutional **200-period EMA (purple line sitting at 1.15846)** and the primary descending macro trendline (the upper red diagonal ceiling). This represents a highly optimized area for institutional sellers to reload exposure.
---
### 📉 Phase 2: The Bearish Expansion & Fibonacci Target Matrix
Once the overhead dynamic matrix successfully repels the relief sequence (or upon a clean structural breakdown below current lows), the broader markdown wave will resume. We have mapped out two core target zones (highlighted by our chart indicators):
1. **Target 1 (1.12900 Demand Pocket):** Our initial objective. This area holds heavy mathematical weight, confluencing directly with the **0.5 ($1.13200$) and 0.618 ($1.12850$) Fibonacci clusters**, right where it meets the intermediate descending channel guideline.
2. **Macro Projection 100% (1.11700 Key Floor):** Our ultimate technical objective for this cycle. This is validated by the **100% Fibonacci expansion extension**, aligning seamlessly with the historical macro horizontal support baseline locked at **1.11745**.
### 📊 Tactical Playbook Summary:
* **Near-Term Bias:** Neutral/Bullish Pullback (Targeting ~1.15600 200-EMA matrix).
* **Macro Swing Bias:** Heavily Bearish.
* **Core Target 1:** 1.12900 (Fibo Ribbon Confluence)
* **Ultimate Extension Target:** 1.11700 (100% Fibonacci Expansion Floor)
---
📊 **ChartPro Data**
*FX Structural Architecture, Fibonacci Expansion Sourcing & Multi-Timeframe Risk Frameworks.*
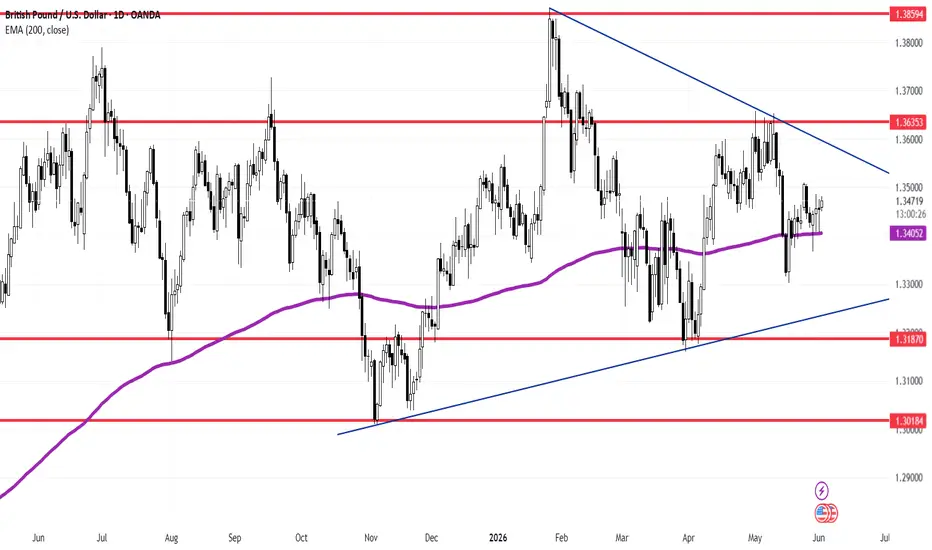
⚠️ **Disclaimer:** For educational and informational purposes only. This active market study represents a personal trading framework and does not constitute financial or investment advice. British Pound / US Dollar ($GBPUSD) Daily: Cable Sits at Major 2British Pound / US Dollar ( OANDA:GBPUSD ) Daily: Cable Sits at Major 200-EMA & Trendline Junction – Mapping the Two-Way Breakout Matrix
### 🇬🇧🇺🇸 British Pound / U.S. Dollar ( OANDA:GBPUSD ) Daily Technical Update (Ref: GBPUSD_2026-07-07_08-35-38.png)
We are deploying a high-stakes structural study on the GBPUSD currency pair on the Daily (1D) time matrix. The "Cable" has arrived at an absolute technical decision point, consolidating directly inside an institutional moving average cluster and testing an immediate descending trendline (LTB).
The pair is trading flat today at **1.33836 (-0.03%)**, compressing into the apex of this near-term structural squeeze.
---
### 🔍 The Geometry of Decision: Two Definitive Scenarios
Today’s daily candle close is crucial. We are practicing absolute discipline, waiting for order flow confirmation across two clear technical roadmaps:
#### 🐻 Scenario A: Bearish Confirmation & Markdown (Red Vector)
* **The Setup:** If today's daily candle closes with dominant sell-side volume, printing a clear bearish rejection footprint off the immediate descending trendline and breaking below the **200-period EMA (purple line at 1.33821)**.
* **The Target:** This structural failure will validate lower-timeframe (1H/4H) bearish continuation structures, opening the path for a markdown sequence down to the solid horizontal support baseline at the **1.31632** corridor. This area confluences perfectly with the primary rising macro support line.
#### bull Scenario B: Bullish Breakout & Trend Resumption
* **The Setup:** Conversely, if buyers absorb the overhead supply and push a daily close back above the immediate moving average ribbon—specifically clearing the **72-period SMA (orange line at 1.34054)**.
* **The Target:** A clean close above this dynamic resistance block invalidates the short-term descending ceiling, triggering a momentum-driven squeeze. This structural breakout shifts our technical targets higher, aiming directly for the **1.35000** psychological barrier and the **1.36000** macro distribution zone (sitting just below major resistance at **1.36463**).
---
### 🎯 Tactical Execution Guidelines:
Chasing trades directly inside this compression block carries poor risk/reward metrics. Our systematic execution model focuses on lower-timeframe confirmations:
1. **For Shorts:** Wait for a confirmed lower-timeframe breakdown and retest of the 200-EMA floor.
2. **For Longs:** Wait for a clean daily close above the 72-SMA, validating a structural shift in order flow.
---
📊 **ChartPro Data**
*FX Architecture, Dual-Breakout Matrices & Institutional Moving Average Sourcing.*
⚠️ **Disclaimer:** For educational and informational purposes only. This active market study represents a personal trading framework and does not constitute financial or investment advice.  Long
Long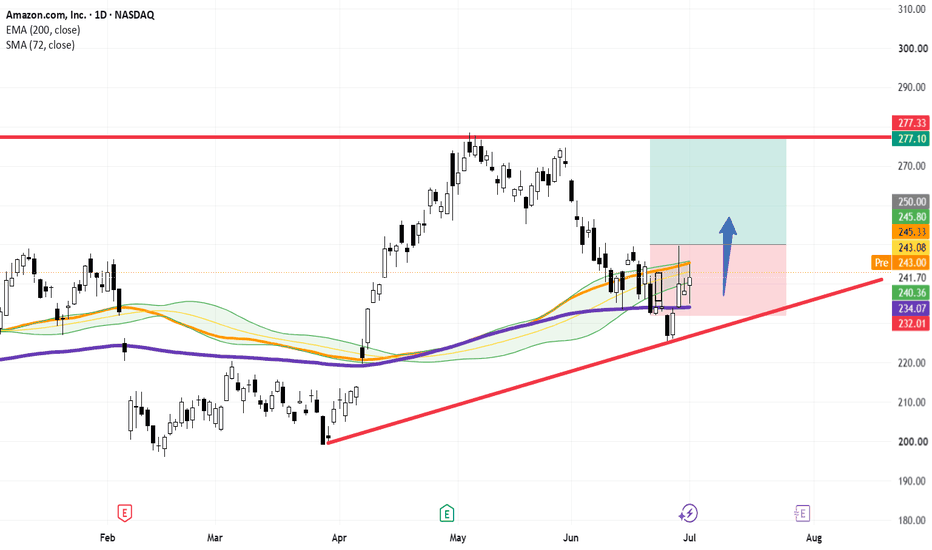
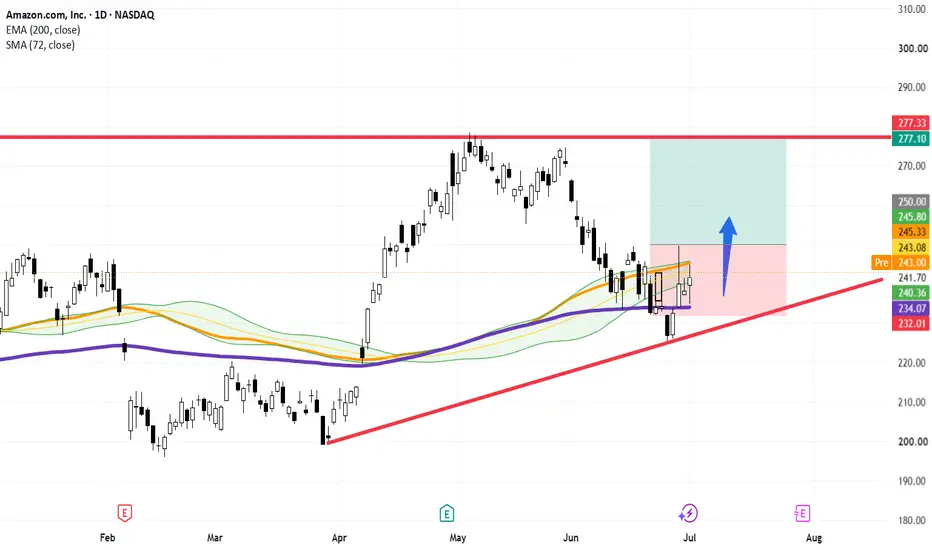
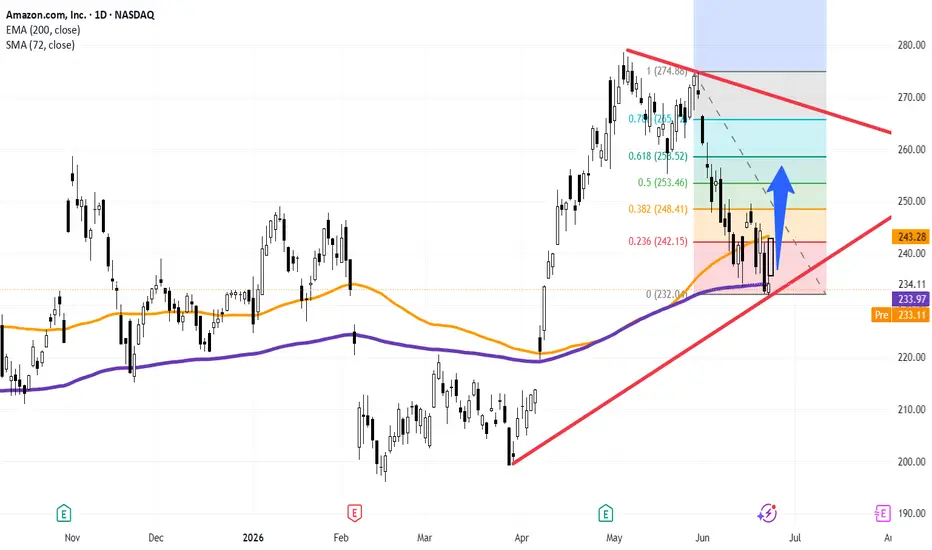
Amazon ($AMZN) Daily: Testing Institutional 200 EMA FloorAmazon ( NASDAQ:AMZN ) Daily: Testing Institutional 200 EMA Floor – Waiting for Volume Confirmation to Trigger Fib Recovery
### 📦 Amazon.com, Inc. ( NASDAQ:AMZN ) Daily Technical Analysis (Ref: AMZN_2026-06-24_09-10-41.png)
We are releasing a high-confluence structural update on Amazon.com, Inc. ( NASDAQ:AMZN - NASDAQ) on the Daily (1D) timeframe. The tech giant has completed a deep corrective phase and is currently sitting at a vital long-term institutional junction that could define its macro direction for the upcoming weeks.
The asset concluded its last session printing a tight stabilisation bar, up **+0.57% at 234.11**.
---
### 🔍 The Triple-Layer Support Cluster:
Price action has drifted directly into a heavy, multi-layered technical floor where aggressive institutional defending order blocks are historical present:
1. **The Institutional Line in the Sand:** The price is actively testing the heavy **200-period EMA (purple line at 233.97)**.
2. **Fibonacci Structural Base:** This dynamic average perfectly aligns with the absolute base (0.0% level) of our recent corrective Fibonacci grid anchoring at **232.04**.
3. **Macro Line of Trend (LTA):** Adding further validity to this cluster, the lower primary ascending trendline (the lower red diagonal line) intersects precisely at this exact node.
---
### 📊 Tactical Playbook: Waiting for Volume & Force Confirmation
While the structural architecture is highly asymmetric for a bullish reversal, our framework demands strict discipline before executing long positions:
* **The Validation Criteria:** We require a definitive **bullish expansion candle backed by above-average volume** during today's trading session (as modeled by our blueprint sketch and blue upward vector). A strong closing signature off the 200 EMA confirms institutional absorption.
* **The Fibonacci Projections:** Once the reversal bar is locked in, the dynamic target matrix shifts toward a structured mean-reversion recovery. The primary mathematical milestones to watch sit at the sequential overhead Fibonacci retracement levels:
* **Target 1:** The 0.236 Fib node at **242.15** (near the overhead 72 SMA at 243.28).
* **Target 2:** The 0.382 Fib node at **248.41**.
* **Target 3:** The 0.50 structural equilibrium node at **253.46**.
### Tactical Summary:
We maintain a high-priority watch on NASDAQ:AMZN at the open. Chasing shorts directly into the 200 EMA, the LTA, and the 0 Fib floor yields an incredibly poor risk/reward ratio. We will patiently wait for the daily candle confirmation to trigger asymmetric long setups, keeping initial invalidation stops tightly defined just underneath the 232 structural low.
---
📊 **ChartPro Data**
*Big Tech Architecture, Institutional Moving Average Filters & Systematic Confluence Sourcing.*
⚠️ **Disclaimer:** For educational and informational purposes only. This active market study represents a personal trading framework and does not constitute financial or investment advice. Long 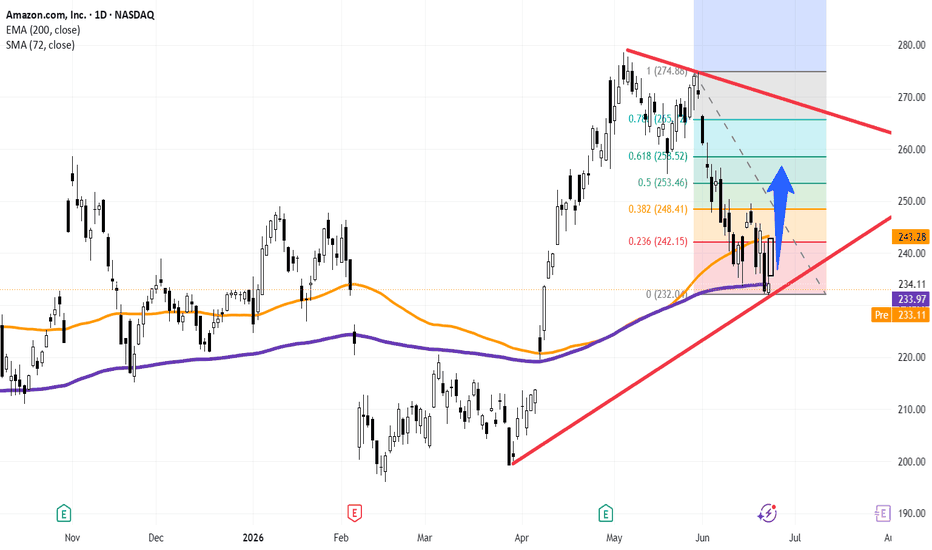
 Short
Short
Gold (GC1!) Daily: Historic 200 EMA Breakdown Signals Major MacrWe are publishing a macro technical study on Gold Futures ( COMEX:GC1! - COMEX) on the Daily (1D) chart, highlighting a major structural shift. The asset has just triggered a rare technical event that hasn't been observed in over two and a half years.
### Part 1: The Structural Breakdown (Ref: GC1!_2026-06-07_22-05-24.png)
* **The Historic 200 EMA Cross:** As highlighted inside the orange circle on our first chart, Gold has closed decisively below its **200-period Exponential Moving Average (Daily 200 EMA - blue line)**, currently tracking at **4,382.2**. The session wrapped up at **4,365.3**, printing a prominent **-3.10%** contraction candle.
* **The Historical Context:** To put this into perspective, Gold has not closed below its daily 200 EMA baseline since October 2023. Historically, Gold tends to quickly absorb liquidity and defend this dynamic layer; staying below it for an extended period would confirm a massive structural change in institutional sentiment.
* **Pattern Resolution:** This breakdown simultaneously forces a downside resolution out of the multi-month symmetrical compression triangle (demarcated by the purple trendlines).
### Part 2: Long-Term Fibonacci Projections (Ref: GC1!_2026-06-07_22-10-39.png)
Looking at the broader horizon on our second chart, we have mapped out a long-term Fibonacci expansion matrix to identify logical downside targets if sellers maintain control. However, a straight markdown is highly unlikely, as the price will face heavy institutional "battlegrounds" at key historical support layers:
1. **The 4,400 Zone (0.382 Fib at 4,408.8):** This represents the immediate structural hurdle where short-term buyers might attempt a counter-trend defensive bounce.
2. **The 4,100 Key Cluster (0.618 Fib at 4,102.4):** Plotted near the horizontal support line at **4,167.9**, this is a massive high-volume node. Expect heavy absorption and distribution fights in this pocket.
3. **The Macro Target (1.00 Fib at 3,606.5):** If the primary multi-year trend fully reverses and structural acceptance is found below 4,100, the mathematical 100% symmetrical extension projects a long-term target down toward the **3,606.5** macro floor.
### Tactical Mindset:
This 200 EMA breach is a primary warning flash on the macro dashboard. The professional playbook requires monitoring early-week candle closes. If the market fails to immediately reclaim the **4,382.2** baseline as support, the technical bias shifts heavily toward selling the rallies on lower timeframes (H4/H1 flags) down into the **4,100** value areas.
---
📊 **ChartPro Data** | By Rogerio
*Macro Commodity Research, Price Action Architecture & Systematic Risk Management.*
⚠️ **Disclaimer:** For educational and informational purposes only. This technical study represents a structural evaluation of the futures market and does not constitute financial advice, investment recommendations, or an explicit trade call.  Short
Short
Gold Futures Update: Price Action Squeezed Inside Tight TriangleGold Futures ( COMEX:GC1! - COMEX) is displaying a classic volatility compression framework on the Daily (1D) chart, with price action tightly coiled inside a prominent symmetrical triangle.
As highlighted by the yellow circle, the precious metal is undergoing a massive liquidity build-up, indicating that a major directional expansion is approaching.
### Key Structural Clusters:
* **The Symmetrical Squeeze:** The asset is currently bound between a descending line of resistance (LTB) and a rising line of short-term support (LTA), leading the price directly toward the pattern's apex.
* **The Institutional Demand Floor (4,381 - 4,408):** The lower boundary of this triangle features exceptional technical confluence. It rests immediately on top of the critical horizontal support wall at **4,408.3** and is heavily backed by the long-term **200-period Exponential Moving Average (EMA 200 - purple line at 4,381.3)**.
* **Macro Overhead Targets:** Should buyers validate a clean structural breakout above the triangle, the primary macro resistance targets remain firmly established at the horizontal red zones of **4,787.3** and **4,901.3**.
### Tactical Outlook & Execution Strategy:
Trading inside the absolute apex of a symmetrical triangle carries a low probability for directional swing-trading due to choppy, mean-reverting behavior. The professional approach mandates waiting for a confirmed breakout:
1. **The Bullish Expansion Scenario:** A daily candle close with strong volume above the descending LTB will signal a continuation of the primary macro uptrend, offering high-odds setups to target the upper horizontal levels.
2. **The Bearish Test Scenario:** If selling pressure breaks the lower trendline, a swift flush into the 4,408 - 4,381 block is expected, where institutional order absorption will likely offer a major long defensive setup.
Patience is our edge. We will let the market break the boundaries of the apex before establishing fresh swing positions.
---
📊 **ProData Chart** | By Rogerio Zaglia
*Technical Analysis, Price Action & Global Macro Strategy.*
⚠️ **Disclaimer:** For educational and informational purposes only. This study does not constitute investment advice or trading recommendations. NVDA: Higher Highs, Higher Lows, Higher ProbabilityNVDA - CURRENT PRICE : 224.36
HIGHER HIGHS CONFIRM THE TREND. HIGHER LOWS CREATE THE OPPORTUNITY.
This is NVIDIA's year-to-date daily chart, and the price action continues to paint a bullish picture. Since establishing its late-March low, NVDA has developed a well-defined sequence of higher highs and higher lows, which is one of the clearest characteristics of a healthy uptrend. Rather than showing signs of weakness, the stock continues to attract buyers during pullbacks, allowing the bullish structure to remain intact.
What makes the current setup particularly attractive is that the latest rebound emerged from another higher-low area. Instead of chasing price near the highs, buyers stepped in during a controlled retracement, suggesting continued confidence in the broader uptrend.
Momentum also supports the bullish narrative. During both recent pullbacks, the RSI successfully found support around the 50 level before turning higher again. In strong uptrends, RSI often treats the 50 zone as a dynamic support level, and repeated rebounds from this area indicate that bullish momentum remains healthy rather than fading.
The combination of a higher-high, higher-low market structure and RSI support near 50 creates a favorable buy-the-dip environment. As long as NVDA continues to respect these higher lows, the probability favors trend continuation rather than trend reversal.
Strong trends rarely move in a straight line. They advance, pull back, find support, and then continue higher. For trend-following traders, those pullbacks often provide the best opportunities to participate in the next leg of the move.
ENTRY PRICE : 220.00 - 224.36
FIRST TARGET : 240.00
SECOND TARGET : 256.00
SUPPORT : 208.00  Long
Long
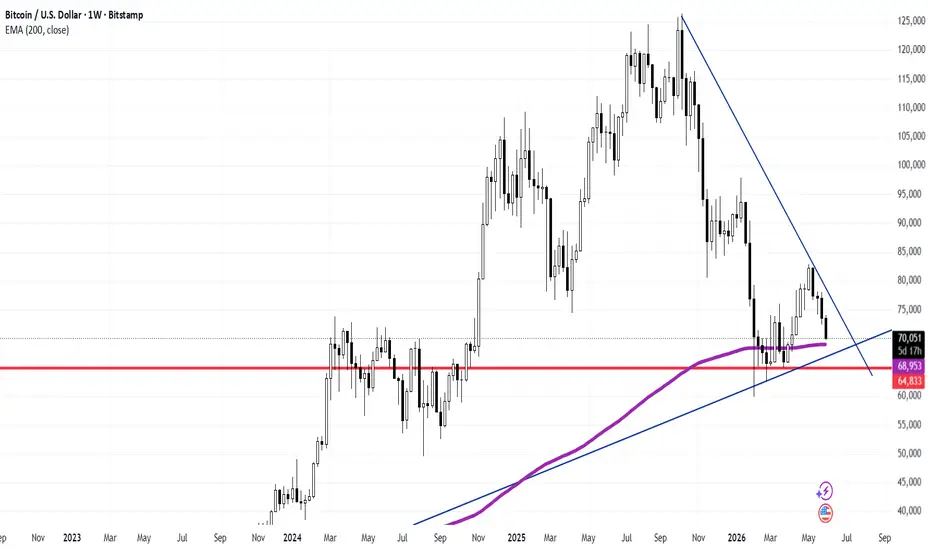
Bitcoin Weekly: BTC Tests Critical Major Confluence at the WeeklBitcoin ( BITSTAMP:BTCUSD - Bitstamp) is presenting an incredibly significant macro structural test on the Weekly (1W) chart. As long-term technical analysts, this is the exact type of high-probability confluence block we monitor for primary trend definitions.
Following a prolonged corrective cycle from its macro peaks, price action has compressed into a critical multi-layered demand territory.
### Key Macro Technical Factors:
* **The Weekly 200 EMA Baseline (68,953):** The dynamic purple baseline represents the 200-period Exponential Moving Average on the weekly timeframe, currently tracking at **68,953**. Historically, the Weekly 200 EMA serves as one of the most respected institutional floors in Bitcoin's history, acting as a definitive boundary between macro regimes.
* **The Horizontal Support Floor (64,833):** Directly beneath the dynamic average lies the vital structural support wall marked by the horizontal red line at **64,833**. This area represents a major historical liquidity pocket where long-term buyers have historically defended aggressive distribution.
* **The Trendline Compression Squeeze:** Price action is entering the final apex of a massive structural triangle, squeezed between the dominant descending macro trendline (upper blue LTB) and the primary ascending trendline (lower blue LTA).
### Strategic Outlook & Market Implications:
The intersection of the Weekly 200 EMA, the horizontal demand wall at 64,833, and the multi-month trendlines creates an exceptionally strong technical cluster.
* **The Bullish Defense Setup:** Because this zone represents deep institutional value, a clean weekly close showing deceleration (such as long lower rejection wicks or a bullish engulfing pattern) will confirm that the smart money is absorbing the supply, establishing a solid launchpad for the next macro expansion leg.
* **Risk Management Caution:** Conversely, any decisive weekly candle acceptance below the 64,833 support floor would invalidate this immediate accumulation thesis, opening the path for a deeper structural correction.
### Professional Execution Plan:
Chasing short positions directly into a rising weekly 200 EMA and historical horizontal support carries a highly unfavourable risk-to-reward ratio. The professional playbook requires monitoring lower timeframe structures (Daily or H4) inside this current high-value cluster, waiting for verified accumulation patterns or structural shifts (CHoCH) to position alongside primary institutional order flow.
---
📊 **ProData Chart** | By Rogerio Zaglia
*Macro Technical Analysis & Global Asset Research.*
⚠️ **Disclaimer:** For educational and informational purposes only. This study does not constitute financial advice or an investment recommendation. Past performance is not indicative of future results.  Long
Long
PATH - Hits Previous Targets, Fresh Buy Signal ActivatedPATH - CURRENT PRICE : 13.10
My previous PATH buy call has successfully achieved both upside targets. For those interested in reviewing the earlier analysis and setup, the previous report link has been shared for reference.
Following the recent price action, PATH has generated another bullish technical setup. The stock has decisively broken above its sideway consolidation resistance, signaling renewed buying interest after several months of accumulation. More importantly, the breakout occurred together with a move above the EMA200, which often indicates a potential shift from a bearish trend to a bullish trend.
Momentum indicators are also supporting the bullish outlook. The MACD has crossed higher and continues to expand positively, suggesting strengthening upside momentum. In addition, the breakout was accompanied by increased volume, indicating participation from buyers rather than a low-conviction move.
As long as PATH remains above the support level at USD11.20, the bullish bias remains intact. The first upside target is USD15.00, while the second target is USD17.00, representing the next major resistance zones on the chart.
Overall, the successful breakout above both the sideway resistance and EMA200, combined with improving MACD momentum, suggests PATH may be entering a new medium-term uptrend phase. Traders may consider maintaining a bullish stance while the stock holds above the USD11.20 support level.
ENTRY PRICE : 12.80 - 13.10
FIRST TARGET : 15.00
SECOND TARGET : 17.00
SUPPORT : 11.20  Long
Long
USDJPY Daily: Educational Case Study on the Power of the 200 EMAIn this technical analysis case study, we analyze the U.S. Dollar / Japanese Yen ( FX:USDJPY ) on the Daily Chart to visually demonstrate the immense structural power of the 200-period Exponential Moving Average (EMA 200) when combined with a major Ascending Trendline (LTA).
As technical analysts and institutional traders, we must always respect these critical macro intersections. The market's memory at these specific zones offers some of the highest-probability setups in professional trading.
### The Anatomy of Institutional Defense (Red Circles):
The two red highlights on the chart show a repeating, textbook behavior of how smart money utilizes dynamic value layers:
1. **The First Confluence Test (Jan/Feb):** Following a steep corrective phase, USDJPY drifted lower into the apex where the rising green LTA converged with the purple EMA 200 line. Notice the immediate reaction: robust bullish rejection wicks followed by strong, institutional size green candles, signaling heavy demand absorption.
2. **The Second Confluence Test (May):** History repeated itself with absolute mathematical precision. A sharp liquidation drop swept lower-timeframe stops, checking into the exact same structural confluence zone. Once again, long lower wicks and aggressive expansion buyers stepped in right after the touch, driving the exchange rate all the way back to the major **160.635** horizontal resistance ceiling.
### Professional Takeaways:
* **The 200 EMA as an Institutional Baseline:** The 200 EMA close (purple line) is not just a lagging indicator; it acts as a macro line in the sand for funds and commercial banks to reposition within a dominant trend.
* **Confirmation via Price Action:** Watching the moving average is only half the battle. The true validation comes from the *immediate candle response after the touch*. Strong daily bullish closes following a retest confirm that the dominant buyers are actively defending their territory.
### Trading Application:
Never short blindly into a rising 200 EMA conflux, and never chase a rally when it is overextended from it. The professional edge lies in identifying these structural clusters, waiting for the dynamic retest, and executing orders alongside institutional order flow once bullish momentum is verified.
---
📊 **ProData Chart** | By Rogerio Zaglia
*Technical Analysis, Price Action & Global Macro Strategy.*
⚠️ **Disclaimer:** For educational and informational purposes only. This study does not constitute investment advice or trading recommendations.  Long
Long