NIFTY SENTIMNET ANALYSIS FOR 03/07/2026# NIFTY 50 | HANUMAN Market Intelligence™ | Daily Sentiment Analysis | 03 Jul 2026
## The Market Doesn't Reward Opinions. It Rewards Preparation.
Every trading day begins with the same question:
**"Will the market go up or down?"**
I believe that's only half the story.
The more important question is:
**"What kind of market are we trading today?"**
Within the first few minutes of today's opening, my HANUMAN Market Intelligence™ framework analyzed the market using **Time, Price, Sentiment, and Options Positioning** to identify today's probable market character.
## Today's Market Read
🟢 Direction: Mild Bullish
⚠️ Market Character: Trap / Conflict
🔥 Behaviour: Explosive
📉 Options Bias: PE Dominant
This tells me one thing:
The market still favors buyers, but expect volatility, shakeouts, and emotional traps before the next meaningful move.
---
## Key Price Levels
🔴 24,490.15 → Major Resistance
🔴 24,434.15 → Resistance
🟣 24,378.15 → Opening Pivot
🔴 24,322.15 → Immediate Support
🔴 24,266.15 → Major Support
The Opening Pivot remains today's battlefield.
As long as price respects this structure, the bullish bias remains valid.
---
## Time Anchor
⏰ 11:15 AM
This is today's primary decision window.
Watch how price behaves around this time.
By then, the market should reveal whether today's gap-up has genuine institutional participation or whether it becomes another liquidity trap.
Remember:
Time Reveals.
Price Confirms.
---
## Sector Rotation
🥇 Auto / Consumer
Today's strength appears selective rather than broad-based.
Focus on quality rather than quantity.
---
## Trading Character
✅ Buy disciplined pullbacks.
❌ Don't chase breakout candles.
⚠️ Respect volatility.
A bullish market can still punish impatient bulls.
---
## Why I Share This Every Morning
The purpose of this analysis isn't to predict every candle.
It's to map the market's character before it becomes obvious.
For the last three months, I've been documenting these daily roadmaps publicly, allowing the market—not hindsight—to validate the framework.
Preparation over Prediction.
That's the philosophy behind HANUMAN Market Intelligence™.
---
💬 What do you think today becomes?
📈 Trend Day
or
⚠️ Trap Day
Share your view below before 11:15 AM.
---
Educational content based on my proprietary Time & Price research framework. This analysis is shared for educational purposes only and should not be considered investment advice.
EURGBP | Sellers Are Done Here, Accumulation Before 0.8657OANDA:EURGBP has been grinding lower for weeks, but look closely at the last stretch of this decline. Candles are getting smaller, wicks are growing on both sides, and price keeps stalling in the same zone around 0.8560. That is not trending behavior anymore. That is a market running out of sellers.
I am long from 0.8565, and this time the fundamentals are doing the heavy lifting:
📌 The ECB hiked in June while the Bank of England held for the fourth meeting in a row. The rate gap that carried the pound all year has narrowed to 150bp and it is closing, not widening
📌 UK political noise is building, with early election speculation creeping into sterling pricing. Political risk premium works against GBP, which means it works for this pair
📌 Two live catalysts ahead: ECB on July 23 and BoE on July 30. If the ECB stays hawkish and the BoE stays on hold, this pair gets repriced higher
📌 Technically, price is basing after an extended drop, and the choppy sideways action you see near the lows is what accumulation looks like while everyone else is still bearish
I expect the move up to be ugly, not clean. Pairs like EURGBP rally in zigzags, shaking out weak longs on every dip. That is why the white path on my chart is drawn the way it is. The dips are part of the trade, not a reason to abandon it.
🎯 Target: 0.8657, the origin of the breakdown and the level where trapped buyers from June will be waiting. First meaningful reaction likely near 0.8600 round number.
Risk is defined below the accumulation zone. I never trade without a hard invalidation, and my full risk parameters are shared with my community.
Gold paid us twice this week, both calls are on my profile. Same systems, different pair. Boost and follow if you want the updates as this one plays out.
Not financial advice. Trade your own plan. GOLD | Bulls Reclaim 4,122, Road Opens Toward 4,264Yesterday I posted the falling wedge long from 4,038 and said the recovery leg was loading. Price has moved almost 100 dollars since. This is the continuation setup, and in my opinion it is the cleaner of the two.
Gold bounced hard off a seven month low this week, and the fuel behind it is real. ADP came in at just 98k against expectations near 110k to 118k, the dollar softened, and rate hike confidence is fading right when everyone leaned bearish. When a market that fell for weeks stops reacting to bad news and starts rallying on it, the trend is telling you something.
On the 4H, buyers have now reclaimed the 4,122 level that capped price earlier. A reclaim of former resistance is not a random candle, it means the sellers who defended that level are trapped, and their exits become buy pressure.
Why I am long from 4,125:
📌 Former resistance at 4,122 flipped, price is accepting above it, not rejecting
📌 Momentum shift is confirmed by the strongest impulse leg since the June decline started
📌 Soft jobs data is pulling the dollar back exactly when gold structure turned bullish
📌 This is the second leg of the recovery I mapped yesterday, trend continuation, not a guess
🎯 Target: 4,264, the supply zone where the June breakdown accelerated. On the way there I expect a reaction at the weekly level near 4,199, that is the checkpoint, not the exit.
Risk is defined below the reclaimed structure. I never trade without a hard invalidation, and my full risk parameters are shared with my community.
Both of my systems fired on this one. If you want to follow the sequence live, boost and follow so you do not miss the updates.
Not financial advice. Trade your own plan.  Long
Long
Long 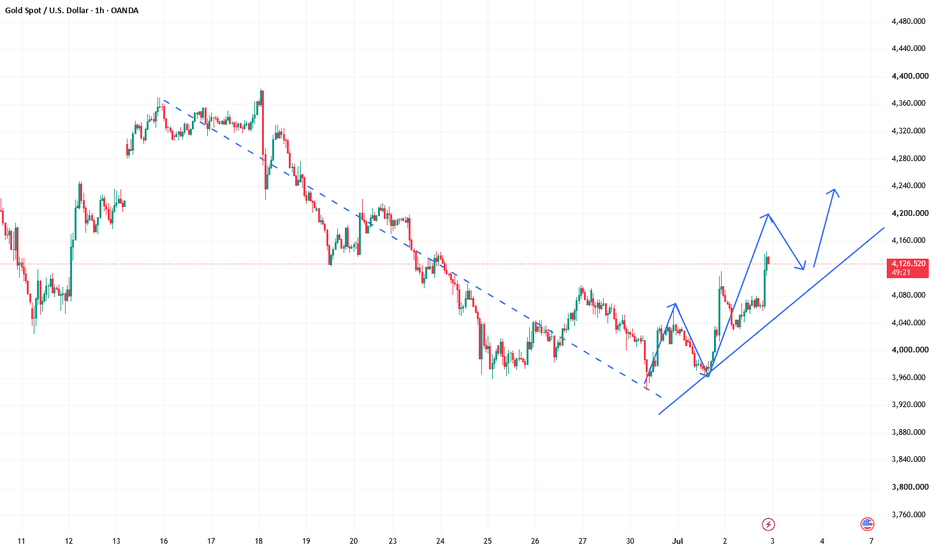
 Short
Short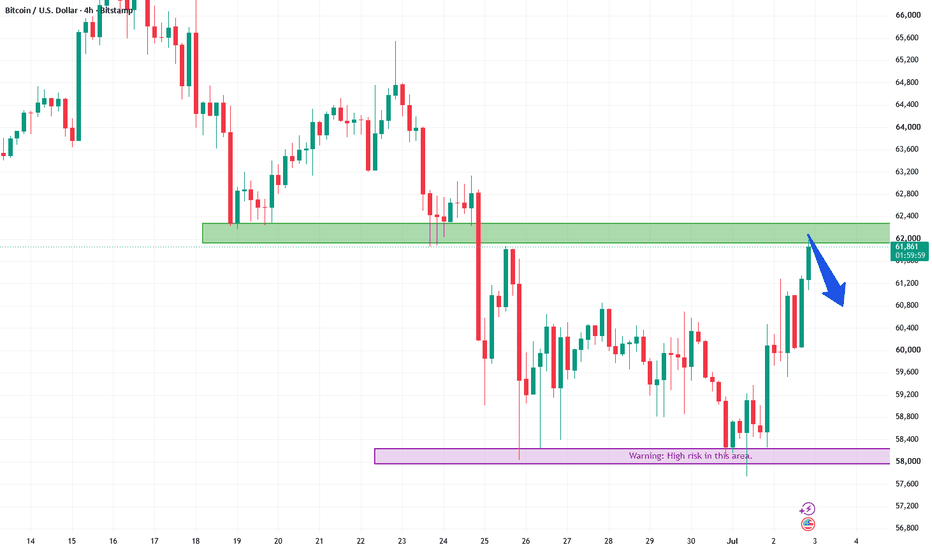
Short 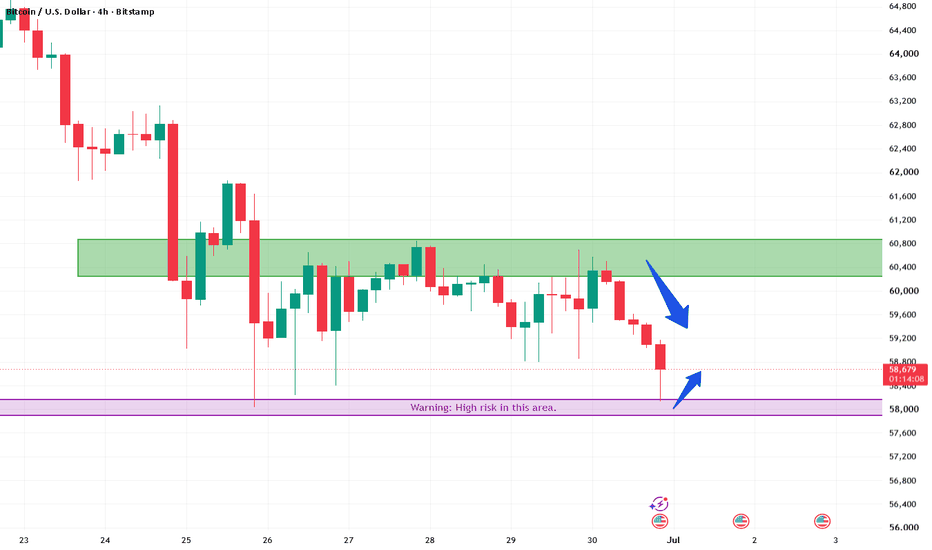
Long 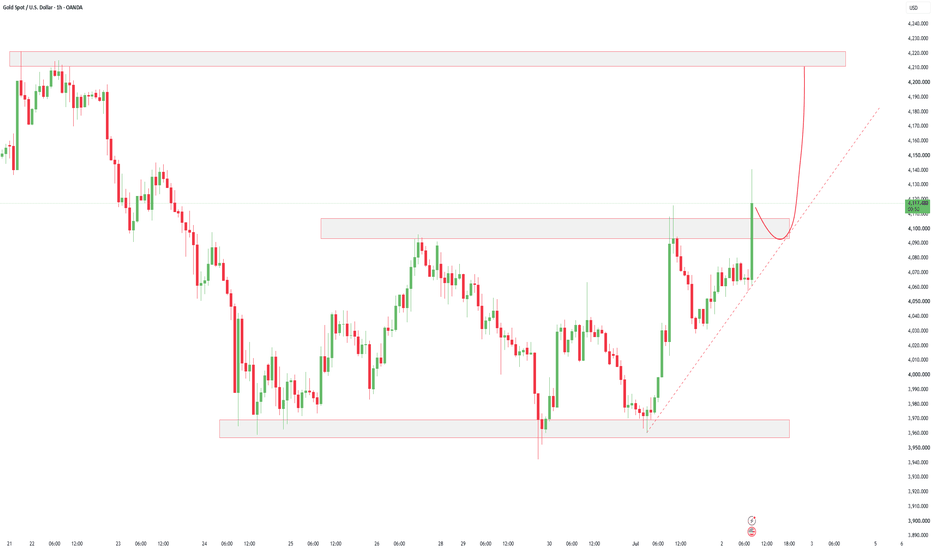

The drop in gold prices may not be over yet.The market is currently awaiting the release of US unemployment data for June; the Non-Farm Payroll (NFP) figures will directly influence expectations regarding the Federal Reserve's future policy, and short-term fluctuations in the US dollar will continue to constrain gold price movements. For us, this tug-of-war involving interest rates, inflation, and geopolitical risks is far from over.
Yesterday, dovish remarks from Warsh triggered a sharp drop in US Treasury yields, allowing gold prices to quickly break above $4,100. However, from a technical perspective, the daily chart shows the price facing continued resistance from moving averages; it failed to firmly establish itself above the $4,090–$4,100 level. During the New York session, gold experienced a "rollercoaster" ride—surging sharply, hitting resistance, and then pulling back. The price continues to trade near the lower band of the daily Bollinger Bands, while on the shorter-term 1-hour and 4-hour charts, moving averages are converging and the Bollinger Bands are narrowing.
Short-term bearish momentum continues to play out, and indicators have not yet entered oversold territory, leaving room for further intraday declines. The overall pattern reflects a pullback and correction following a peak; the short-term bullish rally has paused, giving way to a phase of range-bound consolidation. The primary strategy is to sell into rallies at higher levels, while considering buying opportunities upon pullbacks to key support levels.
My recommendations:
BUY: 4010–4020, SL: 3980, TP: 4100–4150;
SELL: 4100–4110, SL: 4140, TP: 4020–4000; Gold rebounds; Non-farm payrolls could drive a surge!Gold prices rebounded, and short positions can continue to be considered at 4100-4115 before tomorrow's non-farm payroll report. However, please note that the key focus should be on tomorrow's non-farm payroll report. Today's ADP data was lower than expected, which was bullish for gold. As a leading indicator for the non-farm payroll report, it is highly likely that the non-farm payroll report will also be lower than expected, which will drive gold to further rebound. Yet, despite the strength of the bulls, do not chase the rally.
However, it should be noted that the medium-term downtrend has not yet been completely reversed, and there is still resistance from higher-period moving averages above.
Key levels to watch:
Resistance: 4108, 4116
Support: 4040, 4034 Long 
BTCUSDT 4H Bearish Setup Below 62KHello traders! Here is my current technical view based on the BTCUSDT 4H chart structure. BTCUSDT was previously moving within a wide descending channel before price broke below key support, which confirmed strong bearish pressure in the market. After forming a significant low, Bitcoin managed to recover inside an ascending channel, but buyers were unable to sustain that momentum, and the channel eventually broke to the downside. At the moment, BTCUSDT is trading below the 62,000 Seller Zone while still holding above the 58,000 Buyer Zone. Price is now consolidating tightly under former support, which suggests that buyer strength remains limited while sellers continue to protect the resistance area. As long as BTCUSDT stays below the 62,000 Resistance Level, the bearish outlook remains active. If price rejects from the current consolidation range, the next possible downside target is the 58,000 Buyer Zone, marked as TP1. Please review the chart carefully, manage your risk, and share your thoughts. Short 
Demo Trading and Prop Firm ReadinessDemo trading is one of the most valuable tools available to a trader in development, yet it is often either ignored or used incorrectly. Many traders leave the demo stage too early, before they have built the level of structure the process requires. Others use demo accounts in a way that creates poor habits, such as trading unrealistic position sizes, ignoring the rules they plan to follow with real capital, or treating the account as a place for random testing instead of disciplined process-building.
When used properly, demo trading gives a trader the chance to develop the technical and mechanical parts of their approach without every mistake costing real money. When used poorly, it becomes an inaccurate simulation that can create confidence in behavior that may fail once real risk is involved.
What Demo Trading Helps Develop
Demo trading is useful for learning execution. It allows a trader to practice placing orders, setting stop losses, defining targets, managing open positions, and closing trades correctly. It also helps build platform familiarity, including understanding order types, layout, market depth, execution speed, and how conditions may change during faster periods.
It also gives traders time to observe market rhythm. The opening range, mid-session movement, slower periods, and afternoon volatility can all feel different. Demo trading allows these patterns to be studied repeatedly without unnecessary financial pressure.
Most importantly, a demo account provides a space to test whether a trading process has practical value. If a strategy has clear entry rules, stop placement, target logic, and management criteria, it can be tested across a meaningful sample of fifty trades, one hundred trades, or more. This helps determine whether the approach currently has potential before real capital is placed at risk.
What Demo Trading Does Not Replicate
The main limitation of demo trading is that it cannot reproduce the emotional pressure of real loss. This is why strong demo results do not automatically guarantee strong live performance.
In a demo account, a losing trade has no real consequence. In live trading, the loss is financial and personal. That difference can trigger hesitation, emotional exits, moving stop losses, avoiding valid setups, overcorrecting after losses, or entering revenge trades. These reactions usually do not appear in demo because the emotional conditions are not the same.
If a trader performs well in demo but struggles once live capital is involved, it does not always mean the strategy is broken. It may mean the trader is facing the real execution challenge for the first time. This is why the move from demo to live trading should be treated as a separate stage, not as a simple continuation.
Demo performance measures process quality, technical understanding, and analytical consistency. Live trading measures whether that same process can survive real pressure. Both are important, but they are not identical.
How Demo Trading Should Be Used
Every demo session should be treated as a serious training environment. The same rules intended for live trading should apply: daily loss limits, maximum number of trades, setup requirements, risk limits, and trade management rules. Ignoring rules in demo because there is no real consequence only trains the trader to ignore rules later.
Position sizing should also be realistic. A demo account traded at a size far larger than what will be used live does not prepare the trader for real conditions. It creates habits around numbers and risk levels that do not match the actual plan. Demo trading should be done with the same size planned for live trading, or even smaller.
Every trade should be recorded. A demo journal should include the setup type, entry price, stop loss, target, result, trade management notes, and whether the trade followed the plan. Over time, this creates a clear picture of process quality before real money is involved.
There should also be a defined completion standard. Demo trading with no endpoint can turn into endless practice without progression. A reasonable benchmark could be fifty consecutive trades executed according to the rules, with positive expectancy across different market conditions. This does not guarantee live success, but it shows that the process has reached a minimum level of consistency.
Preparing for a Prop Firm Evaluation
A prop firm challenge is not only a test of profitability. It is also a test of whether a trader can operate within strict risk rules while still producing returns. These two skills are connected, but they are not the same.
Many traders fail evaluations not because their analysis is completely wrong, but because they break risk rules. Industry pass rates are often estimated around five to ten percent, and only about seven percent of funded traders reach a payout. The most common reason for failure is usually a breach of the daily loss limit, often caused by revenge trading after a difficult session.
Before paying for an evaluation, the trader should fully understand the rules. This includes the daily loss limit, maximum drawdown, profit target, position-size restrictions, permitted instruments, news-trading rules, and any requirements around holding time or trading days. Simply reading the rules is not enough. The trader needs to practice following them until they become automatic.
A smart approach is to build a demo version of the evaluation before attempting the real one. Use the same starting balance, apply the same daily loss and drawdown limits, trade the same instruments, follow the same sessions, and respect the same restrictions. This simulation should be run for at least thirty trading sessions. Weaknesses that appear in the simulation are likely to appear in the real evaluation as well. Strength that survives the simulation is a better sign of readiness.
The Right Evaluation Mindset
A prop firm evaluation should not be treated as the final goal. It is a structured test designed to show whether the trader can manage risk and execute a process under defined conditions. Passing an evaluation does not automatically make someone a consistently profitable trader. It only proves that they met the required standards during that phase.
The best approach is to trade the evaluation with the same process intended for long-term use. A special high-risk strategy created only to hit the profit target quickly can create dangerous habits. Traders who pass by taking excessive risk are often the same traders who lose funded accounts quickly.
The evaluation should prepare the trader for the funded account. The funded account should prepare the trader for managing personal capital. Each stage should be treated as part of the same development path, not as a separate event where discipline can be abandoned.
Core Principle
Demo trading and prop firm preparation are not delays before real trading begins. They are the foundation that determines whether real trading can be approached with structure. The habits built during these stages are the same habits that will appear when real capital is involved.
Build the process carefully from the beginning, because the quality of that foundation will shape everything that follows.  Education
Bitcoin Bearish Structure and Key Support LevelsBitcoin is currently displaying weakening price action after failing to sustain upward momentum near the latest resistance area. From a technical standpoint, the broader structure still leans bearish, as price remains positioned below prior swing highs and has not managed to reclaim the resistance zone with strength. Until Bitcoin delivers a decisive breakout above the current consolidation range supported by strong volume, any short-term recovery may be viewed more as a corrective bounce than a confirmed trend reversal. Traders should also keep an eye on macroeconomic releases, institutional activity and broader risk sentiment, since these factors can have a direct impact on Bitcoin volatility. Positive market catalysts could create short-covering pressure and drive price higher, while weaker economic data or a shift toward risk-off conditions may reinforce the current downside bias. If Bitcoin breaks below the present support area with rising volume, it could activate stop-loss orders and attract additional short positioning, increasing the speed of the decline. The first major downside level to watch is around 56K, where buyers may attempt to defend price. If selling pressure continues to dominate, the next important support zone is located near 54K, which could become the following target. More context can be taken from the chart. Trade carefully and manage risk wisely. Short 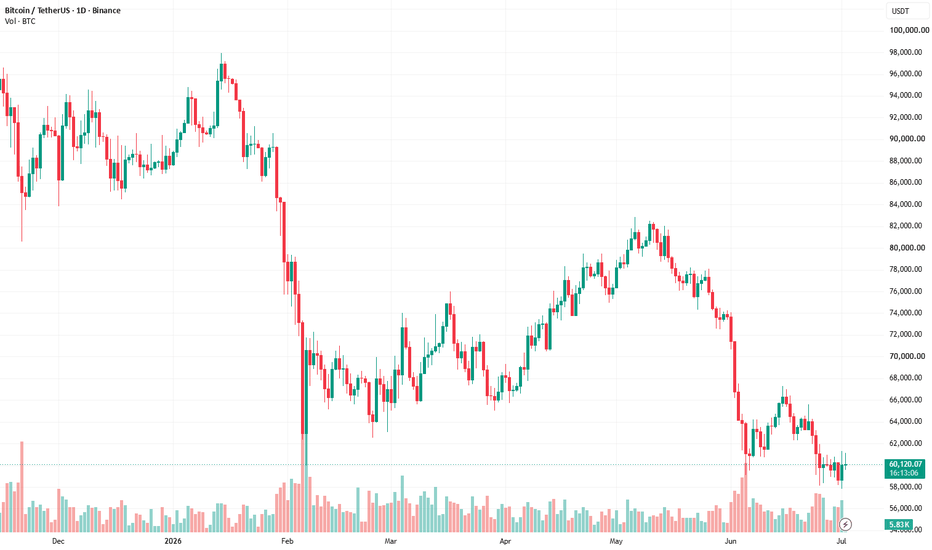
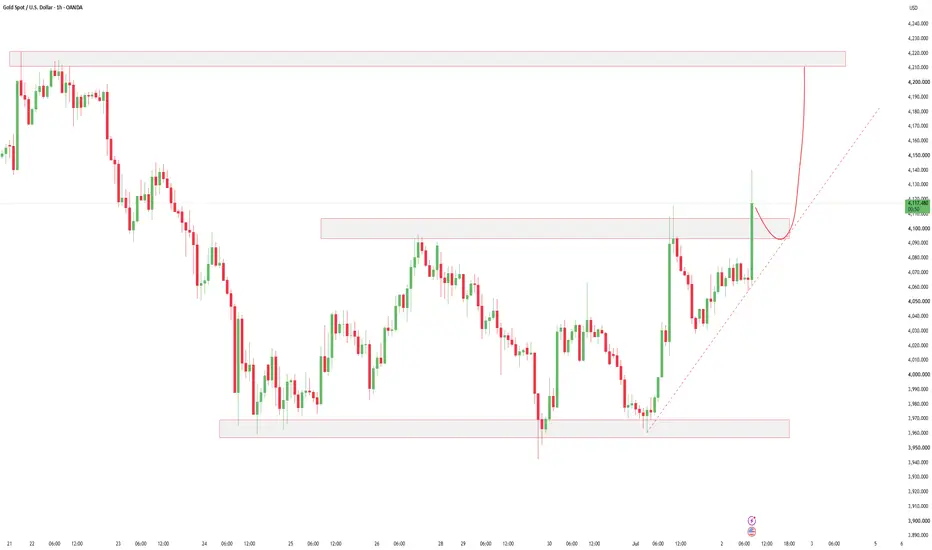
XAUUSD – Gold Is Holding The Buy Order Zone, But 4,120XAUUSD – Gold Is Holding The Buy Order Zone, But 4,120 Is The Real Test
Gold is showing a stronger recovery after reacting from the strong support area around 3,960.
Price is now trading near 4,069 after forming a clear bounce from the lower zone. The short-term structure has improved, and buyers are trying to build momentum above the buy order area around 4,036.
But the chart is now entering an important test. Gold has recovered well, but the next resistance zones will decide whether this is the start of a stronger bullish continuation or just another corrective move before sellers return.
FUNDAMENTAL ANALYSIS
Gold remains sensitive to the U.S. dollar, Treasury yields, and market expectations around interest rates. After the recent decline, the current rebound may be supported by technical buying from lower levels and short-term profit-taking from sellers.
For now, the technical structure is giving the clearest signal. Price has reacted from support, but buyers still need to break through the resistance zones before the bullish view becomes stronger.
TECHNICAL ANALYSIS – SMC + FIBONACCI
From an SMC perspective, gold has respected the strong support zone near 3,960 and created a strong bullish reaction. This shows that sellers lost momentum at the lower area, while buyers started to defend the market.
The current buy order zone around 4,036 is very important. As long as gold stays above this area, the short-term bullish recovery remains valid.
The recent pullback also respected the Fibonacci reaction area, showing that buyers are trying to hold structure instead of allowing price to fall back into the previous low. This gives the chart a cleaner recovery setup.
The first resistance is around 4,090 – 4,100. If gold breaks above this area, the next major resistance sits around 4,115 – 4,125. This zone is important because it aligns with the previous reaction area and could decide whether buyers can continue the move.
Above that, the stronger sell price reaction zone is around 4,155 – 4,165. If gold reaches this area, sellers may defend again, so confirmation is still needed before expecting a full bullish breakout.
KEY PRICE ZONES TO WATCH
Current price: 4,069
Buy order zone: 4,036
Short-term support: 4,036 – 4,045
Nearest resistance: 4,090 – 4,100
Key resistance: 4,115 – 4,125
Sell price reaction zone: 4,155 – 4,165
Strong support: 3,960 – 3,970
Bullish continuation target: 4,155 – 4,165
Invalidation for short-term bullish view: Below 4,036
TRADING SCENARIOS
Buy Scenario – Priority Recovery View
If gold continues to hold above the 4,036 buy order zone, I will watch for a bullish continuation setup.
Buy Zone: 4,036 – 4,045
Entry: Bullish rejection, liquidity sweep, lower-timeframe bullish CHoCH, or strong bullish displacement from the buy zone
SL: Below 4,036 or below the nearest swing low
TP1: 4,090 – 4,100
TP2: 4,115 – 4,125
TP3: 4,155 – 4,165
Breakout Buy Scenario
If gold breaks and holds above 4,100, buyers may continue pushing price toward the higher resistance zone.
Buy Condition: Clean breakout above 4,100, followed by retest and bullish confirmation
Target: 4,115 – 4,165
Sell Scenario – Reaction From Resistance
Sell is not the first view while gold stays above 4,036. However, if price reaches 4,115 – 4,165 and shows rejection, a short-term pullback may appear.
Sell Zone: 4,115 – 4,165
Entry: Bearish rejection, failed breakout, or lower-timeframe bearish CHoCH
TP1: 4,090
TP2: 4,045
TP3: 4,036
Invalidation: If price breaks and holds above 4,165, the sell reaction idea becomes weaker.
MY VIEW ON GOLD
My current view for gold is short-term bullish recovery while price holds above 4,036.
The chart has improved after the bounce from strong support, and buyers are now trying to build a cleaner continuation structure. But the real test is not the current price. The real test is how gold reacts around 4,100 and 4,115 – 4,125.
If buyers break these levels with strength, gold may continue toward the 4,155 – 4,165 sell reaction zone. But if rejection appears there, the market may pull back again to retest the buy order area.
For now, gold is recovering — but the next resistance will tell us whether buyers are truly in control.
Do you think gold can break above 4,125 and continue toward 4,165, or will sellers defend the resistance again?
Long 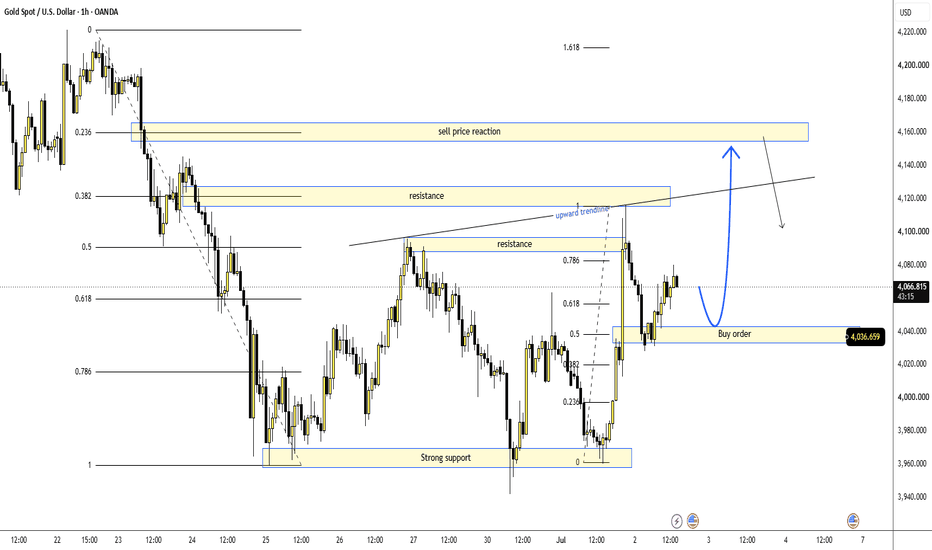
NIFTY SENTIMENT ANALYSIS FOR 02/07/2026📊 NIFTY 50 | HANUMAN Market Intelligence™ | Daily Sentiment Analysis | 02 Jul 2026
The Market Has a Character. Not Just a Direction.
Yesterday's framework identified:
✅ Launchpad Opening
✅ Buy-on-Dips Environment
✅ Bullish Market Character
The market respected the roadmap almost throughout the session.
Today, however, the personality has changed.
A gap-up opening doesn't automatically mean an easy bullish day.
The opening has changed...
The market's character has changed.
🧠 Today's Sentiment
🟢 Direction: Mild Bullish
⚠️ Market Character: Trap / Conflict
🔥 Behaviour: Explosive
📊 Options Bias: PE Dominant
This tells me one thing:
Expect larger moves than normal, but don't assume every breakout will sustain.
Today's market is likely to reward patience more than aggression.
🎯 Key Levels
🔴 24,187.75 → Major Resistance
🔵 24,131.75 → Decision Zone
🟣 24,075.75 → Opening Pivot
🔵 24,019.75 → First Support
🟠 23,963.75 → Major Support
⏰ Time Anchor
🎯 11:00 AM
This is today's most important decision window.
Watch whether buyers continue defending the gap-up momentum—or whether today's Trap/Conflict structure begins to dominate.
⚡ Sector Focus
🥇 Energy
🥈 PSU
Expect sector rotation, not broad market participation.
🎯 Trading Character
✔️ Buy quality dips.
❌ Don't chase green candles.
⚠️ Respect volatility.
Remember...
A bullish market can still trap impatient bulls.
The objective isn't to predict every candle.
It's to identify the market's character before it becomes obvious.
Time Reveals. Price Confirms.
💬 What do you think today becomes?
Trend Day 📈 or Trap Day ⚠️?
Share your view below.
Educational content based on my proprietary Time & Price research framework. This is a market observation, not investment advice. Short
ADP Data Sets Short-Term Direction! Secure Consistent Profits.
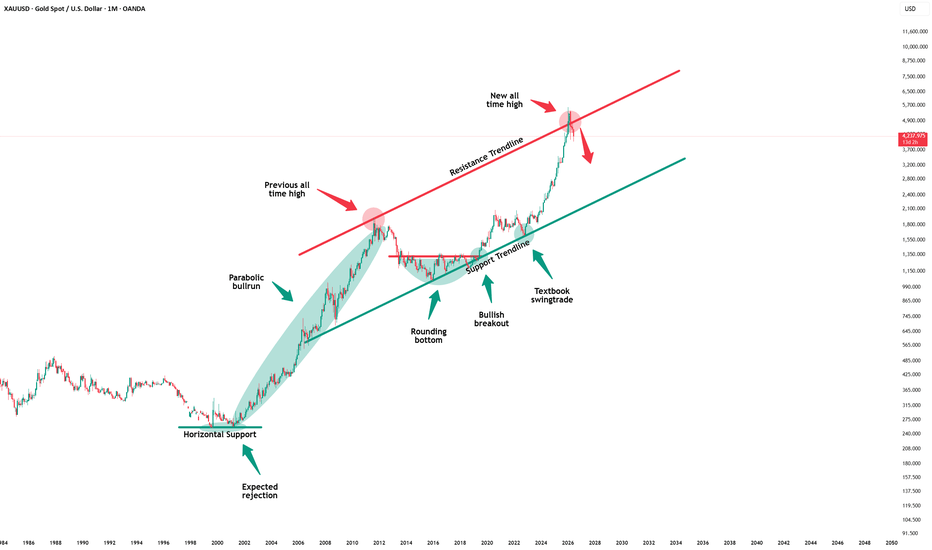
From a daily chart perspective, following a rapid ascent, gold has entered a phase of high-level consolidation, establishing a temporary equilibrium range near $4,000 per ounce. While the overall trend remains within a long-term upward channel, upward momentum has clearly decelerated, characterized by a "high-level plateau consolidation and momentum convergence" structure.
Resistance is concentrated in the $4,050–$4,080 zone; this range has repeatedly capped further gains, indicating significant profit-taking pressure at these elevated levels. Key support lies at the $3,950 mark; a breach here could trigger a pullback to the $3,900 level or lower.
Regarding trend patterns, daily MACD momentum is gradually converging—evidenced by shortening red bars—signaling a marginal weakening of bullish momentum. However, the absence of a clear "death cross" suggests the market remains in a phase of "high-level oscillation rather than a trend reversal."
The 4-hour chart reveals a high-level range-bound structure, with prices repeatedly fluctuating between $3,980 and $4,050. This indicates a short-term tug-of-war driven by economic data and interest rate expectations.
Short-term moving averages are flattening, with the price frequently crossing above and below them, suggesting a balance between bullish and bearish forces. Regarding momentum indicators, the RSI remains in the upper-neutral zone without entering clearly overbought territory; this implies room for an upward push, though sustained momentum may be lacking.
A decisive break below the $3,980 support level could open the door for a short-term pullback toward $3,950 or lower. Conversely, if the price stabilizes above $4,050, it may retest the previous highs, though a confirmed breakout would require support from bullish macroeconomic catalysts.
To position for anticipated bullish moves: consider opening light long positions near $4,000–$4,010, adding to positions in the $3,970–$3,980 range, and setting a stop-loss below $3,960. Targets are $4,100 (with a break leading to $4,150–$4,200); if upward momentum stalls at $4,200, a short-term short position could be considered.