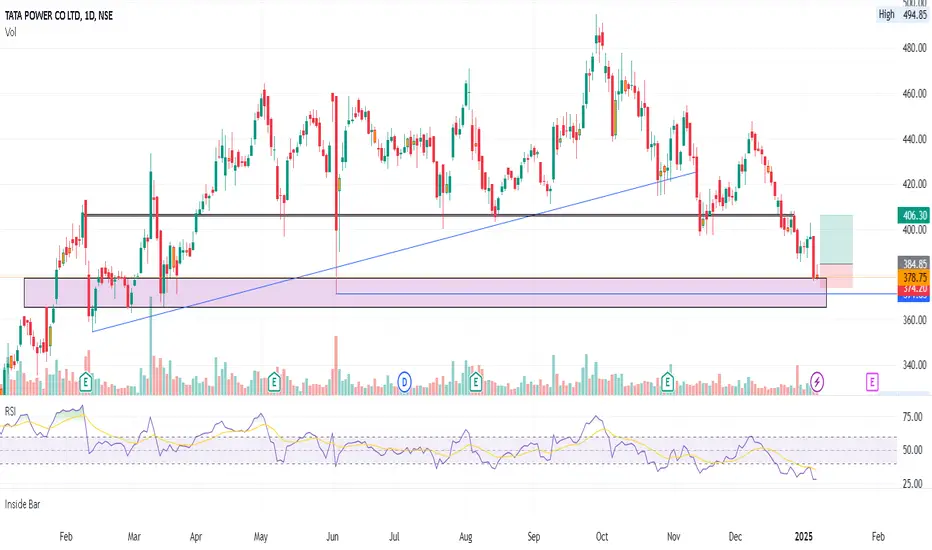
Nifty Analysis EOD – 20 July 2026 – Monday🟢 Nifty Analysis EOD – 20 July 2026 – Monday 🔴
Calm Before Expiry: Bulls and Bears Breathe Easy Inside a 112-Point Cage
🗞 Nifty Summary
Nifty opened with a gap down of 148 points after a weekend filled with geopolitical noise. The very first one-minute candle itself carved out the full 112.45-point range for the day — and then the session just lived inside that range till the close. Compact, yes. But plenty of drama packed in.
The day closed at 24,238.50 (adjusted close 24,238.50). What makes today’s candle interesting is that it fits a near-perfect inside bar pattern by the book — range well within the previous session’s range, both sides contained. With the ATR sitting at 239.60, today’s contraction feels deliberate. The market seems to be coiling energy ahead of tomorrow’s weekly expiry.
My back test data says most Mondays tend to stay within the IB range, or give a fakeout on either side. So I’m usually not looking for an IB breakout trade on Mondays — and that read played out today. The IBL breakdown ended up offering a nice contra trade opportunity instead.
Tomorrow’s opening is the one thing I’ll be watching closely before forming any directional bias for the session. The expiry session usually brings the volatility that today’s session held back.
🛡 5 Min Intraday Chart with Levels
📉 Daily Time Frame Chart with Intraday Levels
🕯 Daily Candle Breakdown
Open: 24,190.05
High: 24,266.10
Low: 24,135.85
Close: 24,238.50
Change: −95.80 (−0.39%)
🏗️ Structure Breakdown
Type: Bullish Inside Bar — demand absorbed the gap-down open and recovered toward the upper half
Range: ≈ 130 points — moderate volatility
Body: ≈ 48 points — mild buyer pressure, close well off the lows but below open
Upper Wick: ≈ 28 points — some supply resistance near the highs
Lower Wick: ≈ 54 points — decent demand response from the session lows
🛡 5 Min Intraday Chart
⚔️ Gladiator Strategy Update
ATR: 239.60
IB Range: 112.45 → Medium
Market Structure: Balanced
Trade Highlights:
10:34 Short Trade: Target Hit (R:R 1:4.16)
12:11 Long Trade: SL Hit
12:52 Long Trade: Target Hit (R:R 1:3.41)
Trade Summary: The short at 10:34 worked well — a 1:4.16 on a Monday inside-range session is not something to take lightly. The 12:11 long got stopped out, which is part of the game in a range-bound session where neither side commits fully. Good that the 12:52 long came back and delivered a 1:3.41. Two targets and one SL — the system held its shape today. Overall a decent Monday, especially given the kind of compressed price action we were working with.
🧱 Support & Resistance Levels
Resistance Zones: 24,260 | 24,300 | 24,360 ~ 24,380 | 24,430 | 24,460
Support Zones: 24,200 ~ 24,160 | 24,100 | 24,030
🧠 Final Thoughts
“Stillness is not absence of direction — it is direction holding its breath.”
Today was one of those sessions where the market said a lot by doing very little. A 148-point gap down at open, and then nearly the entire day spent inside that first candle’s range. The drama was real, just compressed.
For tomorrow, the levels I’m watching are 24,260 and 24,300 on the upside — if those give way early, the 24,360 ~ 24,380 zone becomes the next conversation. On the downside, 24,200 ~ 24,160 is the floor that needs to hold. A clean break below that, and 24,100 comes into the picture quickly on an expiry session.
Tomorrow I’ll let the opening play out before deciding anything. Weekly expiry sessions can flip fast — the plan is to watch, wait for a setup that makes sense, and not force a trade just because it’s expiry day.
✏️ Disclaimer
This is my personal digital diary and represents my own analysis and point of view. It is not financial advice; please consult a professional advisor before making any trading decisions.
Inside Bar
Nifty Analysis EOD – July 16, 2026 – Thursday🟢 Nifty Analysis EOD – July 16, 2026 – Thursday 🔴
Trapped in the Box: Nifty Delivers Yet Another Inside Bar Within a 260-Point Range
🗞 Nifty Summary
Another day of inside bar action — this time on Sensex weekly expiry — with a range of just 135 points.
Nifty opened with a gap-up of 75 points, landing within the previous day’s range and close to the resistance zone of 24,160. It found a base about 26 points below the open, then made an attempt to break through the resistance. Selling pressure pushed it back 70 points from the day high, and that became the Initial Balance. Through the middle of the IB, Nifty consolidated within a tight 35-point range for nearly 55 minutes, forming a wedge pattern inside the box. When that wedge broke out, the move was sharp — 77 points — breaching VWAP, the 24,160 resistance, and the IBH all in one push. But it couldn’t hold above the IBH, and what followed was a steady drop back below VWAP, which then led to a breach of both IBL and PDC.
At the bottom, the 24,050 level stepped in and acted as support. A 75-point recovery from there tested the intraday trend line, but the 3 PM move pulled Nifty back to the day low. And then — almost out of nowhere — a 40-point recovery in the last 5 minutes brought the close to 24,081.10, nearly identical to the PDC.
While everyone was waiting for a breakout, the market handed out one more inside bar.
🛡 Special Analysis:
— 22 Sessions, 31 Days (15th June to 16th July):
The pattern here is worth paying attention to:
16th July: Inside Bar
15th July: Outside Bar
14th July: Inside Bar
13th July: Outside Bar
9th July: Inside Bar
8th July: Master Candle / Mother Candle
3rd, 6th & 7th July: Fakeout
The main range sits at 23,785 ~ 24,260 — roughly 475 points.
The MC range is 23,805 ~ 24,300 — about 495 points. After the fakeout of 280 points, price has come back inside.
Since the 8th July, the range has actually been shrinking to a tighter 24,000 ~ 24,260 box — just 260 points over the last 4 sessions.
Nifty has been hovering within this 500-point range for 22 sessions. Everyone is watching it. Everyone is expecting it to break. And every evening, they go home waiting for tomorrow.
🛡 5 Min Intraday Chart with Levels
📉 Daily Time Frame Chart with Intraday Levels
🕯 Daily Candle Breakdown
Open: —
High: —
Low: —
Close: 24,081.10
Change: —
🏗️ Structure Breakdown
Type: Inside Bar — tight-bodied candle reflecting complete indecision within the prior day’s range
Range: ≈ 135 points — low volatility
Body: —
Upper Wick: —
Lower Wick: —
OHLC values not provided — candle structure derived from session narrative and close.
🛡 5 Min Intraday Chart
⚔️ Gladiator Strategy Update
ATR: 238.57
IB Range: 70.35 → Small
Market Structure: Balanced
Trade Highlights:
10:44 Long Trade: Target Hit (R:R 1:2.62)
11:32 Long Trade: SL Hit
12:25 Long Trade: SL Hit
13:15 Short Trade: Trailing Target Hit (R:R 1:1.24)
Trade Summary: The first trade set the tone well — the 10:44 long hit target at 1:2.62, which was a solid start. The next two longs at 11:32 and 12:25 both stopped out, which is the nature of a day where the market couldn’t hold its breakout. The 13:15 short made up some ground with a trailing target at 1:1.24. On a whipsaw day like this, two SL hits after a winning trade is not unusual — what matters is the system stayed honest with its entries. Net positive on the day, but the middle session was a reminder of how quickly things can reverse when a breakout fails.
🧱 Support & Resistance Levels
Resistance Zones: 24,160 ~ 24,200 | 24,260 | 24,300 | 24,360 ~ 24,380
Support Zones: 24,030 | 23,975 | 23,900 | 23,785 | 23,630
🧠 Final Thoughts
“The box doesn’t break on the day everyone is watching — it breaks when the watching stops.”
Twenty-two sessions. Thirty-one days. Same range. Today was a clean example of how a market in compression can give you the look of a breakout — the wedge broke, VWAP was crossed, IBH was touched — and still come back and close where it started. The move happened. It just didn’t stick.
For tomorrow, 24,160 ~ 24,200 remains the key resistance cluster. A sustained move above that, with a close above 24,260, would start to change the picture. On the other side, 24,030 held today, but a break below that brings 23,975 and then 23,900 into focus quickly. The range is tightening — at some point, the spring has to release.
Going into tomorrow, the plan stays simple: wait for the move, not the story. The setup will come from price, not from expectation. Two SL hits in the middle of today’s session are a good reminder that forcing trades inside a box rarely ends well.
✏️ Disclaimer
This is my personal digital diary and represents my own analysis and point of view. It is not financial advice; please consult a professional advisor before making any trading decisions.
Nifty Analysis EOD – 15 July, 2026 – Wednesday🟢 Nifty Analysis EOD – 15 July, 2026 – Wednesday 🔴
Bull Trap Wednesday: Nifty’s 132-Point Surge Fizzles at the 24,200 Zone
🗞 Nifty Summary
Nifty opened with a gap-up of around 50 points and, right from the first tick, added a sharp 132 points more — climbing to test the 24,200 ~ 24,175 zone. For most of the mid-session, the index stayed rangebound, grinding within a tight 25–30 point range that eventually shrank further to just 15–20 points. That range gave way at 12:15 PM, but the real move came a little later — at 12:53 PM, Nifty dropped 138 points in under five minutes, straight into the previous day’s low.
The day low was marked at 24,010, and from there Nifty recovered 96 points, closing at 24,073.45 — right near the IBL.
The session had the feel of a bull trap, though not a clean one, since price didn’t close below the PDL. Both sides got their opportunity today, but full moves were rare — the kind of day where most trades ended before they could fully breathe.
On the daily candle, it’s another doji — and compared to yesterday’s candle, today prints an outside bar. But zoom out to Monday’s candle, and today is still an inside bar relative to that range. Either way, it looks like consolidation is still playing out, just at a wider range than it appears at first glance.
🛡 5 Min Intraday Chart with Levels
📉 Daily Time Frame Chart with Intraday Levels
🕯 Daily Candle Breakdown
Open: 24,085.85
High: 24,220.35
Low: 24,010.55
Close: 24,078.50
Change: +26.45 (+0.11%)
🏗️ Structure Breakdown
Type: Doji with slight bullish close — indecision printed across the full session
Range: ≈ 210 points — moderate volatility
Body: ≈ 7 points — nearly no net commitment from either side
Upper Wick: ≈ 142 points — supply came in hard near the 24,200 zone
Lower Wick: ≈ 68 points — some demand emerged at the day low, but recovery was limited
🛡 5 Min Intraday Chart
⚔️ Gladiator Strategy Update
ATR: 249.91
IB Range: 149.10 → Medium
Market Structure: Balanced
Trade Highlights:
10:27 Short Trade: Target Hit (R:R 1:2.28)
12:27 Short Trade: Target Hit (R:R 1:5.48)
14:27 Long Trade: Exit in minor loss (time over)
Trade Summary: Two shorts, both targets hit — the system did its job on the short side today. The 12:27 trade in particular gave a clean 1:5.48, which is the kind of move that doesn’t show up every session. The afternoon long didn’t quite work out — exited in a minor loss as time ran out, which is the right thing to do rather than holding past the window. A decent day overall; the discipline of exiting on time is as much a part of the process as hitting targets.
🧱 Support & Resistance Levels
Resistance Zones: 24,160 ~ 24,200 | 24,260 | 24,300 | 24,360 ~ 24,380
Support Zones: 24,030 | 23,975 | 23,900 | 23,785 | 23,630
🧠 Final Thoughts
“A trap needs bait, and today the bait was a gap and run — the wise ones waited for the Levels.”
Today’s session was a reminder that not every gap-up is an invitation. The early push to 24,200 looked promising, but price couldn’t hold it — and what followed was swift enough to catch anyone off guard who was still thinking bullish.
For tomorrow, the 24,160 ~ 24,200 zone is the one to watch on the upside. If Nifty can reclaim and hold above that area, there might be another attempt at higher levels. Below, 24,030 is the first meaningful support — a break of that could bring 23,975 into play fairly quickly.
The day gave opportunities on both sides, but the real edge came from reading what the range was saying before it broke. Tomorrow might offer similar setups — the plan is to stay patient, let the IB form, and not assume direction from the open.
✏️ Disclaimer
This is my personal digital diary and represents my own analysis and point of view. It is not financial advice; please consult a professional advisor before making any trading decisions.
NQ Power Range Report with FIB Ext - 7/6/2026 SessionCME_MINI:NQU2026
- PR High: 29979.50
- PR Low: 29860.75
- NZ Spread: 265.75
Key scheduled economic events:
09:45 | S&P Global Services PMI
10:00 | ISM Non-Manufacturing Prices
- ISM Non-Manufacturing PMI
Session Open Stats (As of 12:15 AM)
- Session Open ATR: 746.26
- Volume: 151K
- Open Int: 276K
- Trend Grade: Short
- From BA ATH: -4.5% (Rounded)
Key Levels (Rounded - Think of these as ranges)
- Long: 31904
- Mid: 29517
- Short: 27131
Keep in mind this is not speculation or a prediction. Only a report of the Power Range with Fib extensions for target hunting. Do your DD! You determine your risk tolerance. You are fully capable of making your own decisions.
BA: Back Adjusted
BuZ/BeZ: Bull Zone / Bear Zone
NZ: Neutral Zone
Nifty Analysis EOD – July 1, 2026 – Wednesday🟢 Nifty Analysis EOD – July 1, 2026 – Wednesday 🔴
Inside Bar Standoff: Nifty Holds Above 24,000
🗞 Nifty Summary
Nifty opened flat to positive and found a base around 23,895, then climbed steadily and gradually up to test 24,020. At this point it faced rejection and slipped sharply by 73 points, but VWAP came to the rescue. Another push higher led to a breach of PDH, though the index couldn’t sustain above it — IBH and R1 on the downside acted as support, and price formed an MC around the mid-session mark. The rest of the session was spent between 24,000 ~ 24,050, and the day closed at 23,988.10, with an adjusted close of 24,005.85, holding above the 24K mark.
Overall, as expected, today looked like a consolidation day — that holds up if we ignore the 15-point upper shadow above PDH, in which case the daily candle forms an inside bar pattern. This session is reminding me of the previous Wednesday’s move, the one right after the Nifty weekly expiry on 23 June.
Going into the next session, bulls will have to deal with the 24,075 ~ 24,125 zone, which could turn into a real hurdle, along with an LTF trendline have to face the same area.
Before any of that though, tomorrow’s opening tick matters most — if it opens inside today’s range, the breakout plan is clearer, but a gap up or down either side means waiting for IB to guide things.
The daily candle forming an inside bar suggests the market might still be deciding its next direction.
🛡 5 Min Intraday Chart with Levels
📉 Daily Time Frame Chart with Intraday Levels
🕯 Daily Candle Breakdown
Open: 23,897.65
High: 24,049.90
Low: 23,895.10
Close: 24,005.85
Change: +140.10 (+0.59%)
🏗️ Structure Breakdown
Type: Strong Bullish — buyers stayed in control through most of the session
Range: ≈154.80 points — moderate volatility
Body: ≈108.20 points — reflects fairly firm buying pressure through the day
Upper Wick: ≈44.05 points — a bit of rejection near the highs
Lower Wick: ≈2.55 points — barely any selling pressure, lows were defended easily
🛡 5 Min Intraday Chart
⚔️ Gladiator Strategy Update
ATR: 244.88
IB Range: 101.30 → Medium
Market Structure: Balanced
Trade Highlights:
09:29 Long Trade: Target Hit (R:R 1:3.62)
11:33 Short Trade: SL Hit
14:34 Short Trade: Trailing SL Hit
Trade Summary: The morning long trade worked out well, hitting target with a solid R:R of 3.62 — the system did its job there. The 11:33 short didn’t work and stopped out, and the 14:34 short also got stopped, though trailing at least protected part of that move. Two out of three not landing is a reminder that not every setup plays out, even when the logic looks fine going in. Still sticking with the process and taking whatever the day gives.
🧱 Support & Resistance Levels
Resistance Zones: 24040 | 24075 ~ 24125 | 24190 | 24235 ~ 24285
Support Zones: 23970 | 23900 | 23855 | 23790 | 23650 ~ 23620
🧠 Final Thoughts
“Some days the market just wants to breathe — today felt like one of those pauses.”
Today felt like a pause after the recent run — price pushed toward 24,020, got rejected, but never really broke down before buyers stepped back in near VWAP.
The 24,075 ~ 24,125 zone looks like the next real test, and the LTF trendline sits right around there too. If tomorrow opens inside today’s range, the plan is clearer; a gap either side and it’s probably better to just wait for IB to settle first.
Nothing to force here — just watching how price reacts at that zone before deciding anything.
✏️ Disclaimer
This is my personal digital diary and represents my own analysis and point of view. It is not financial advice; please consult a professional advisor before making any trading decisions.
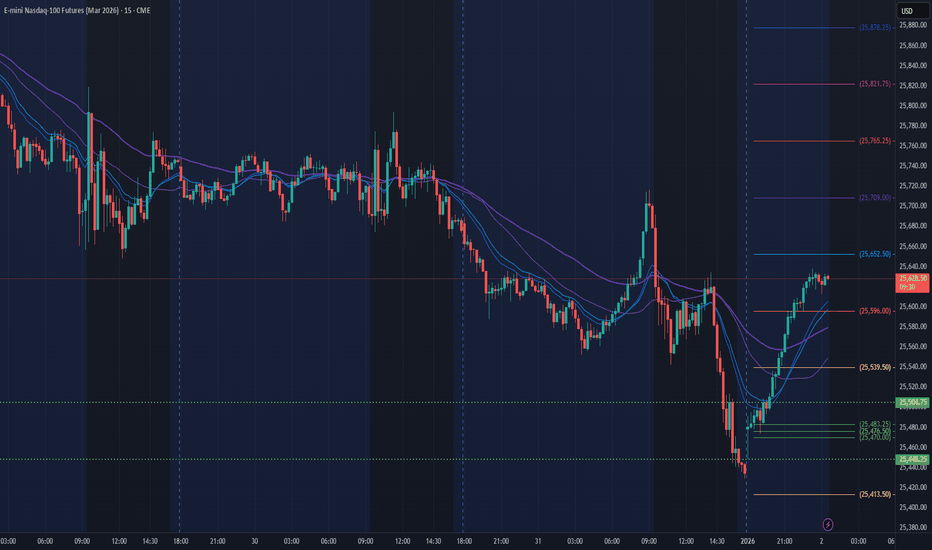
NQ Power Range Report with FIB Ext - 1/5/2026 SessionCME_MINI:NQH2026
- PR High: 25463.25
- PR Low: 25406.50
- NZ Spread: 126.75
Key scheduled economic events:
10:00 | ISM Manufacturing PMI
- ISM Manufacturing Prices
Session Open Stats (As of 12:15 AM)
- Session Open ATR: 339.04
- Volume: 32K
- Open Int: 271K
- Trend Grade: Long
- From BA ATH: -3.4% (Rounded)
Key Levels (Rounded - Think of these as ranges)
- Long: 26521
- Mid: 25264
- Short: 24008
Keep in mind this is not speculation or a prediction. Only a report of the Power Range with Fib extensions for target hunting. Do your DD! You determine your risk tolerance. You are fully capable of making your own decisions.
BA: Back Adjusted
BuZ/BeZ: Bull Zone / Bear Zone
NZ: Neutral Zone
NQ Power Range Report with FIB Ext - 1/2/2026 SessionCME_MINI:NQH2026
- PR High: 25504.00
- PR Low: 25448.50
- NZ Spread: 124.0
Key scheduled economic events:
09:45 | S&P Global Manufacturing PMI
Session Open Stats (As of 12:25 AM)
- Session Open ATR: 333.71
- Volume: 26K
- Open Int: 275K
- Trend Grade: Long
- From BA ATH: -2.9% (Rounded)
Key Levels (Rounded - Think of these as ranges)
- Long: 26521
- Mid: 25264
- Short: 24008
Keep in mind this is not speculation or a prediction. Only a report of the Power Range with Fib extensions for target hunting. Do your DD! You determine your risk tolerance. You are fully capable of making your own decisions.
BA: Back Adjusted
BuZ/BeZ: Bull Zone / Bear Zone
NZ: Neutral Zone
NQ Power Range Report with FIB Ext - 12/19/2025 SessionCME_MINI:NQH2026
- PR High: 25257.50
- PR Low: 25209.75
- NZ Spread: 106.75
Key scheduled economic events:
08:30 | Core PCE Price Index (MoM|YoY)
10:00 | Existing Home Sales
Session Open Stats (As of 12:55 AM)
- Session Open ATR: 430.77
- Volume: 35K
- Open Int: 271K
- Trend Grade: Long
- From BA ATH: -4.1% (Rounded)
Key Levels (Rounded - Think of these as ranges)
- Long: 26521
- Mid: 25264
- Short: 24008
Keep in mind this is not speculation or a prediction. Only a report of the Power Range with Fib extensions for target hunting. Do your DD! You determine your risk tolerance. You are fully capable of making your own decisions.
BA: Back Adjusted
BuZ/BeZ: Bull Zone / Bear Zone
NZ: Neutral Zone
NQ Power Range Report with FIB Ext - 12/9/2025 SessionCME_MINI:NQZ2025
- PR High: 25728.50
- PR Low: 25692.00
- NZ Spread: 81.5
Key scheduled economic events:
10:00 | JOLTs Job Openings
13:00 | 10-Year Note Auction
Session Open Stats (As of 12:25 AM).
- Session Open ATR: 413.46
- Volume: 23K
- Open Int: 310K
- Trend Grade: Long
- From BA ATH: -2.7% (Rounded)
Key Levels (Rounded - Think of these as ranges)
- Long: 26521
- Mid: 25264
- Short: 24008
Keep in mind this is not speculation or a prediction. Only a report of the Power Range with Fib extensions for target hunting. Do your DD! You determine your risk tolerance. You are fully capable of making your own decisions.
BA: Back Adjusted
BuZ/BeZ: Bull Zone / Bear Zone
NZ: Neutral Zone
NY SESSION STRUCTURE UPDATEES continues to hold an inside-day structure, with price contained inside yesterday’s range.
This keeps the market in a balancing regime under MSM — compression, not trend.
The key level today is the inside-day break.
Until price resolves either side of the range, there is no confirmed directional intent.
The behaviour is straightforward:
– Liquidity is building at both edges
– Momentum remains muted
– No side is showing initiative
– Structure is coiling, not expanding
Operator approach:
Ignore early movement.
The valid move only appears once the inside-day resolves and behaviour confirms expansion.
— CORE5DAN
Institutional Logic. Modern Technology. Real Freedom.
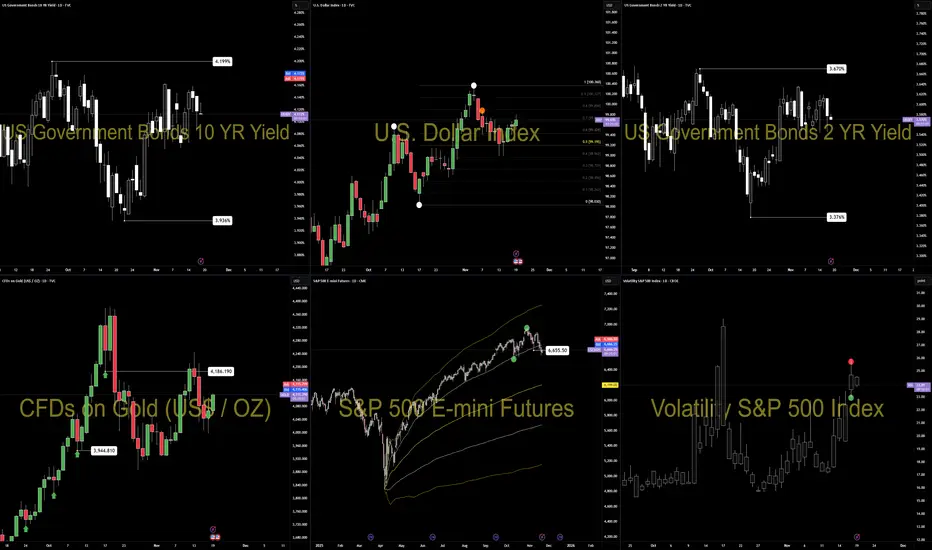
DXY — Triple Compression: CPI Meets a 3rd Weekly & 4th Daily Ins
The U.S. Dollar Index is locking in tight — 3rd consecutive weekly inside bar, and a 4th possible daily inside bar — as U.S. inflation holds firm and Japan’s core inflation uptick adds fuel.
Context
We’re locked in structural compression: three weeks of internal price action, and today presents a 4th daily inside bar formation.
Weekly key range: low 97.561 and high 99.197. Price is stuck in the mid-zone, patiently waiting.
For bias confirmation: Break of Tuesday’s 21 Oct daily candle low at 98.143 or high at 98.613 will signal directional bias.
Macro queue: Big data hits next week (inflation prints, central-bank focus). Volatility is coiled.
Technical
Weekly frame: Still inside the bearish range (97.561 – 99.197).
Daily frame: Bias leans bullish until the range breaks — think “bullish inside bar pending expansion”.
In symmetrical measures: Risk of overbought cognition; if today’s low holds and Monday fails to trade through it, we may see a higher low setup. Execution: Wait for clean breakout of the inside bar structure; use volume confirmation; avoid getting sucked into a false squeeze.
Fundamentals
U.S. inflation: The Consumer Price Index for September is published today (24 Oct) after delay due to shutdown.
Bureau of Labor Statistics +2
The Financial Express +2
Japan inflation: September core inflation rose to 2.9% YoY, moving above the Bank of Japan target and adding pressure to the JPY‐rate story.
Trading Economics
+2
Bloomberg
+2
Impact mechanism: Sticky inflation → reduces odds of immediate rate cuts → supports USD strength; yet structural squeeze in DXY means the market is holding its breath for breakout.
Plan & Mindset
Plan: Hold off trading until Monday’s price action gives clarity through breakout of the inside-bar structure. Then map cross-assets (EURUSD, GBPUSD) accordingly.
Mindset
Structure rules story. Don’t fight a tight coil. Today you “wait with purpose.” If price breaks, act decisively; if it breaks wrong, adapt quickly.
- Like waiting for the popcorn — you don’t eat the kernels while still heating.
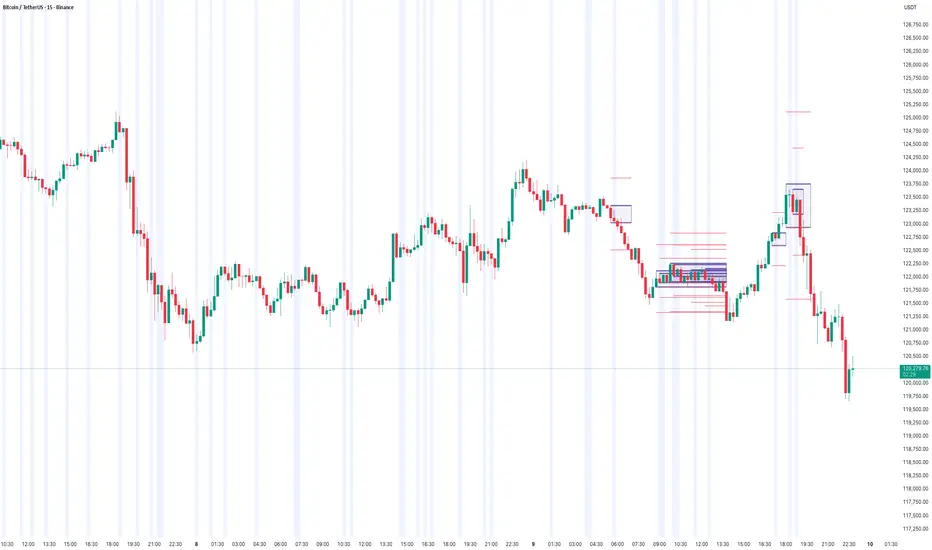
How to use Candle Range Detector – Fibo-Based Volatility mapping🧠 Concept Overview
The Candle Range Detector (CRD) visualizes how market volatility expands and contracts across time.
Instead of using a static multiplier, it applies Fibonacci ratios (0.618, 1.0, 1.618, 2.618, etc.) to dynamically scale candle ranges, helping traders spot where price might react or exhaust.
Each detected candle range forms a zone or band representing potential continuation or reversal interest areas.
This adaptive approach captures market rhythm more naturally than uniform multipliers.
⸻
⚙️ How It Works
1. Range Detection:
The indicator measures the true range (high–low) of key candles and maps them forward on the chart.
2. Fibonacci Expansion Logic:
Instead of a normal “x times range” multiplier, Fibonacci levels are used to project natural extensions and contractions from each candle’s body or wick.
3. Zone Formation:
Each candle’s range forms a rectangular area (as shown on your chart).
• Thicker Boxes: Represent strong impulsive candles or high-volume bars.
• Lighter Boxes: Represent pullback or resting candles.
4. Automatic Overlap Handling:
When two zones overlap, the indicator visually merges them, highlighting confluence where multiple candle ranges align — a sign of strong market memory.
⸻
📊 How to Interpret
• When price revisits a previously detected Fibonacci expansion zone, it often reacts (pause or reversal).
• A cluster of zones at similar levels acts like a dynamic supply/demand region.
• Breakouts beyond upper/lower Fibonacci bands may indicate trend continuation.
• Tight clusters of small ranges suggest compression – potential breakout setup.
⸻
💡 Practical Use-Cases
• Identify where short-term volatility clusters before big moves.
• Spot pullback re-entries aligned with prior expansion zones.
• Detect imbalance areas that later act as resistance/support.
• Enhance confluence with volume, VWAP, or order flow indicators.
⸻
🧩 Customization Tips
• Fib Ratios: You can select or deselect Fibonacci levels from the settings panel. Right now its set to 1.618
• Zone Opacity: Adjust transparency to visualize overlaps better.
• Lookback Range: Control how many historical ranges are plotted for context.
⸻
🏁 Summary
The Candle Range Detector (Fibonacci Mode) transforms traditional range analysis into a visual map of volatility zones.
By using Fibonacci expansion instead of arbitrary multipliers, it synchronizes with natural market rhythm and highlights where liquidity and volatility converge.
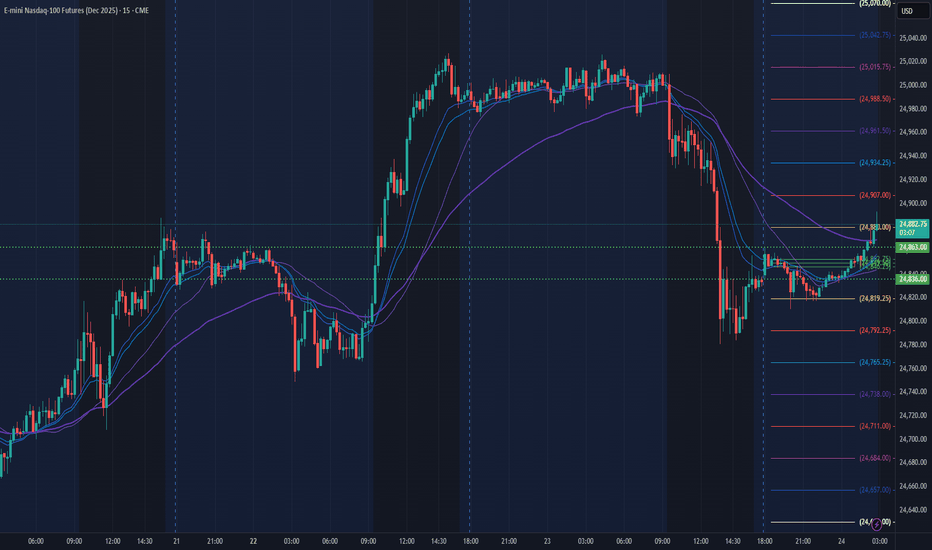
NQ Power Range Report with FIB Ext - 9/24/2025 SessionCME_MINI:NQZ2025
- PR High: 24863.00
- PR Low: 24836.00
- NZ Spread: 60.5
Key scheduled economic events:
10:00 | New Home Sales
Session Open Stats (As of 12:15 AM 9/24)
- Session Open ATR: 267.57
- Volume: 18K
- Open Int: 274K
- Trend Grade: Long
- From BA ATH: -0.7% (Rounded)
Key Levels (Rounded - Think of these as ranges)
- Long: 25204
- Mid: 23571
- Short: 21939
Keep in mind this is not speculation or a prediction. Only a report of the Power Range with Fib extensions for target hunting. Do your DD! You determine your risk tolerance. You are fully capable of making your own decisions.
BA: Back Adjusted
BuZ/BeZ: Bull Zone / Bear Zone
NZ: Neutral Zone
NQ Power Range Report with FIB Ext - 9/9/2025 SessionCME_MINI:NQU2025
- PR High: 23829.00
- PR Low: 23798.00
- NZ Spread: 69.5
No key scheduled economic events
Session Open Stats (As of 12:25 AM 9/9)
- Session Open ATR: 295.63
- Volume: 18K
- Open Int: 284K
- Trend Grade: Long
- From BA ATH: -0.9% (Rounded)
Key Levels (Rounded - Think of these as ranges)
- Long: 24382
- Mid: 23239
- Short: 22096
Keep in mind this is not speculation or a prediction. Only a report of the Power Range with Fib extensions for target hunting. Do your DD! You determine your risk tolerance. You are fully capable of making your own decisions.
BA: Back Adjusted
BuZ/BeZ: Bull Zone / Bear Zone
NZ: Neutral Zone
Nifty Analysis EOD – August 5, 2025 – Tuesday 🟢 Nifty Analysis EOD – August 5, 2025 – Tuesday 🔴
🌀 Double Inside Day – Calm Before the Storm?
📊 Nifty Summary
In the wind of negative news, yet Nifty starts neutral at the resistance zone of 24,725 ~ 24,735 but was unable to hold there and fell 140 points within the first 45 minutes.
After this initial sell-off, Nifty found support around 24,590, which coincided with yesterday's Fib 0.786 level, R1, and Previous Week Low (PWL).
These levels were well-defended throughout the session. Near the end, the index recovered ~80 points and closed at 24,649.55, close to yesterday’s Fib 0.5.
Can we consider today's move a retracement or a pullback of yesterday's move?
Same as Monday, today’s action stayed inside the previous session’s range, forming an Inside Bar. Now it appears as a Double Inside Bar on the daily chart.
📉 5 Min Time Frame Chart with Intraday Levels
📉 Daily Time Frame Chart with Intraday Levels
🕯 Daily Candle Breakdown
Open: 24,720.25
High: 24,733.10
Low: 24,590.30
Close: 24,649.55
Change: −73.20 (−0.30%)
Candle Structure Breakdown:
🔴 Red Candle (Close < Open):
24,720.25 − 24,649.55 = 70.70 points
🔼 Upper Wick:
24,733.10 − 24,720.25 = 12.85 points
🔽 Lower Wick:
24,649.55 − 24,590.30 = 59.25 points
Interpretation:
After a flat open, the index tried to move higher but faced resistance near 24,730, then reversed.
Buying interest was seen near the 24,590 zone, but sellers remained in control.
It closed below the open with a decent lower wick, indicating some buying support but overall weakness.
Candle Type:
🕯 A pullback candle with a moderate real body and long lower wick – suggests buyers attempted to support the fall, but sellers dominated.
🛡 5 Min Intraday Chart
⚔️ Gladiator Strategy Update
ATR: 202.71
IB Range: 139.95 → 🟠 Medium
Market Structure: Balanced
Trade Summary:
❌ No entry triggered by system
📌 Support & Resistance Levels
🔼 Resistance Zones:
24,725 ~ 24,735
24,780 ~ 24,795
24,860 ~ 24,880
🔽 Support Zones:
24,675 ~ 24,660
24,620
24,542 ~ 24,535
24,500
24,470 ~ 24,460
🧠 Final Thoughts
Today's double inside bar structure signals contraction and indecision — markets are waiting for a decisive breakout.
“The tighter the coil, the bigger the breakout.”
Keep an eye on these tight ranges. Patience before power!
✏️ Disclaimer
This is just my personal viewpoint. Always consult your financial advisor before taking any action.
Nifty Analysis EOD – August 4, 2025 – Monday🟢 Nifty Analysis EOD – August 4, 2025 – Monday 🔴
A Monday full of mind games.
Nifty opened with a slight positive gap and immediately tested the TC of CPR, but that optimism didn’t last long — sharp rejection took it to day’s low (24,554). What followed was a rollercoaster: a 100-point recovery, a 50-point pullback — all within 10 minutes. This wild price action defined the rest of the day.
Throughout the session, Nifty remained trapped within the CPR zone. Both sides experienced multiple fakeouts, especially around initial balance (IB) zones. Even when prices nudged toward R1, repeated failed attempts to break above reflected the market’s indecisiveness. The day finally closed near the high, but conviction was still lacking.
Many option buyers likely struggled due to deceptive shadows and unexpected fractal breakouts. The entire price action stayed within Friday’s range — forming an Inside Bar structure on the daily chart. This suggests a potential range breakout trade tomorrow.
The market faced resistance near the Fibonacci 0.618–0.786 retracement of the prior fall — aligning with 24,740–24,780 zones. A close above 24,780 tomorrow could shift momentum back in the bulls’ favour. If not, bears still hold the upper ground.
📈 5 Min Time Frame Chart with Intraday Levels
📉 Daily Time Frame Chart with Intraday Levels
📊 Daily Candle Breakdown
Open: 24,596.05
High: 24,736.25
Low: 24,554.00
Close: 24,722.75
Change: +157.40 (+0.64%)
Candle Type:
🟢 Bullish Marubozu-like — reflects a strong control by buyers after early weakness.
Structure Breakdown:
Real Body: 126.70 pts (Bullish)
Upper Wick: 13.50 pts (Minor resistance near close)
Lower Wick: 42.05 pts (Early dip got bought aggressively)
Key Insight:
Closed near the high of the day — positive bias for tomorrow
Inside Bar formed – Expect a breakout trade
24,780+ closing will turn sentiment bullish
🛡 5 Min Intraday Chart
⚔️ Gladiator Strategy Update
ATR: 209.36
IB Range: 115.95 → Medium
Market Structure: Balanced
Trade Summary:
🕚 11:30 AM – Long Entry → SL Hit
🕛 12:30 PM – Long Entry → SL Hit
🕐 13:10 PM – Short Entry → SL Hit
Tough day — strategy got chopped in noise-heavy moves.
🔍 Support & Resistance Levels
Resistance Zones:
24,725 ~ 24,735
24,780 ~ 24,795
24,860 ~ 24,880
Support Zones:
24,675 ~ 24,660
24,620
24,542 ~ 24,535
24,500
24,470 ~ 24,460
💭 Final Thoughts
"Markets love to test your patience before they reward your conviction."
Today was a lesson in restraint — avoid overtrading when structure lacks clarity. Inside bar gives us a clean slate for tomorrow. Let price lead.
✏️ Disclaimer
This is just my personal viewpoint. Always consult your financial advisor before taking any action.
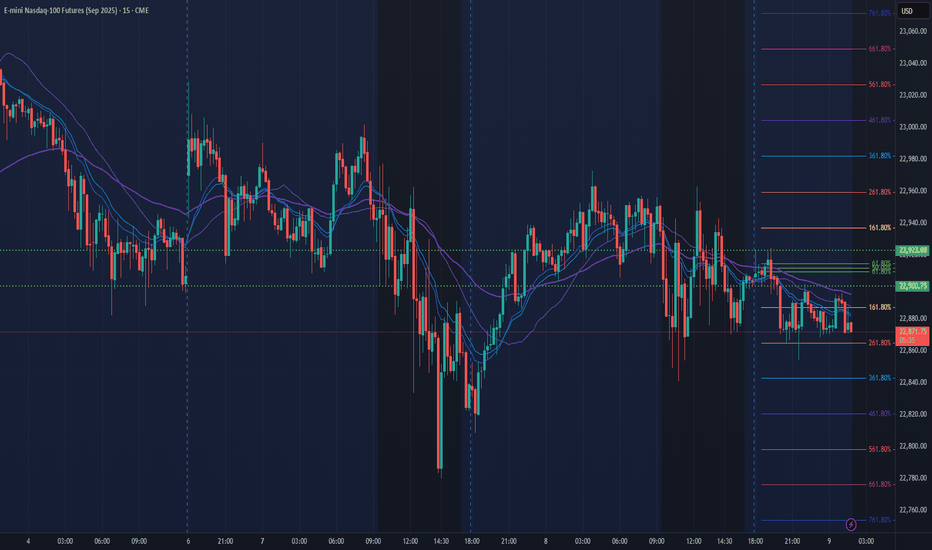
NQ Power Range Report with FIB Ext - 7/9/2025 SessionCME_MINI:NQU2025
- PR High: 22923.00
- PR Low: 22900.50
- NZ Spread: 50.5
Key scheduled economic events:
10:30 | Crude Oil Inventories
13:00 | 10-Year Note Auction
14:00 | FOMC Meeting Minutes
Session Open Stats (As of 12:25 AM 7/9)
- Session Open ATR: 303.33
- Volume: 16K
- Open Int: 270K
- Trend Grade: Neutral
- From BA ATH: -0.8% (Rounded)
Key Levels (Rounded - Think of these as ranges)
- Long: 23239
- Mid: 21525
- Short: 20383
Keep in mind this is not speculation or a prediction. Only a report of the Power Range with Fib extensions for target hunting. Do your DD! You determine your risk tolerance. You are fully capable of making your own decisions.
BA: Back Adjusted
BuZ/BeZ: Bull Zone / Bear Zone
NZ: Neutral Zone
FOMO & An Inside Bar Entry Into A Larger Head & Shoulder PatternAn handful of lessons in this video so hang on.
1) We take a look at the dangers that come with entering a trade too early & what you should do if you ever find yourself in that situation.
2) A discussion ion inside bars, what they are, how to trade them and an indicator that will help you spot them.
3) How to use that inside bar as an entry reason into a bigger head and shoulders pattern on the larger timeframe.
Please leave any questions or comments below!
Akil
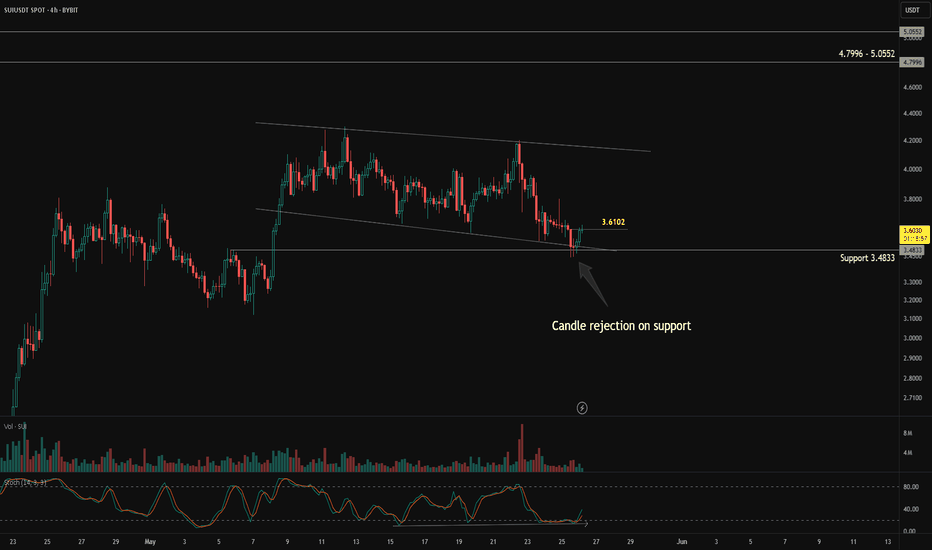
Failed Wedge, New Setup. Is SUI About to Break Out?In my previous post about BYBIT:SUIUSDT , I mentioned a potential falling wedge pattern. However, the breakout above the 4.0040 resistance turned out to be a false breakout, and the price eventually dropped to the invalidation level at 3.5868. This made the setup invalid.
But despite the failed wedge breakout, BYBIT:SUIUSDT remains in a bullish trend overall. During the current consolidation, the price appears to be forming a new bullish pattern — a Descending Broadening Wedge (DBW).
This pattern typically starts with low volatility and gradually widens. Once price reaches its lower boundary, it often experiences a strong breakout to the upside.
Let’s break down the key price action in this DBW setup:
Price is moving within a Descending Broadening Wedge and is currently near the lower boundary of the pattern.
It’s also sitting around a key support level at 3.4833.
A rejection candle formed right at 3.4833, showing the market’s response to this support area.
A reversal confirmation would come if the price breaks above 3.6102.
A bullish divergence is also visible — price is forming lower lows, while the stochastic indicator is forming higher lows.
Based on these five price action signals, it seems that buyers are still in control, even though short-term volatility has created a series of lower lows.
That’s why I still believe BINANCE:SUIUSDT has more room to go up. What’s your take on this?
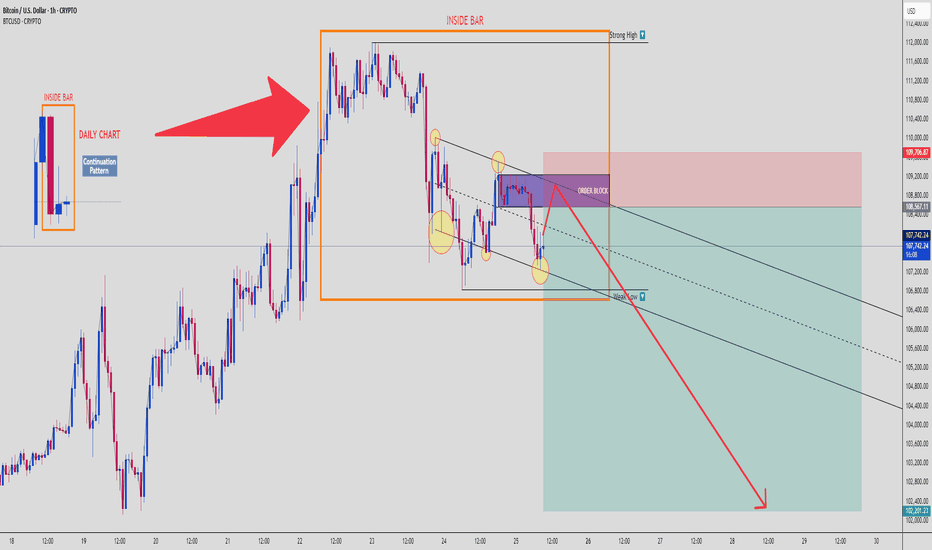
BTCUSD: Inside Bar Trap + Order Block Rejection Targeting $102K📉 Bitcoin | SMC Breakdown | 1H Chart
Welcome to a clean Smart Money setup, where retail gets baited and Smart Money gets paid. Let’s break down what’s happening on BTCUSD, 1H chart, using multi-timeframe confluence and Smart Money Concepts. 👇
🗓️ 1. Daily Chart Confluence
We start with a Daily Inside Bar Pattern – a classic continuation setup, often used by institutions to trap traders before expansion. BTC ranged tightly, then broke to the upside to grab liquidity, not start a rally.
🟥 Daily High = Liquidity Pool
🟧 Inside Bar Range = Manipulation Zone
This is the trap zone.
🧱 2. Order Block Rejection (1H)
Price tapped a clearly defined Bearish Order Block in premium pricing, just above the mid-range of the Inside Bar.
💥 Reaction confirmed:
Rejection candles from OB
Structure respecting downside bias
Fakeout = Fuel for downside expansion
📉 3. Bearish Continuation Structure
Price is moving within a descending channel, respecting internal supply zones. Each lower high is met with supply pressure, and internal lows are swept before moving lower.
You’re looking at a high-probability continuation move toward the weak low marked near $102,200.
🧊 4. Weak Low as Final Target
This level is a classic liquidity magnet – weak lows = retail stop clusters = Smart Money target.
We expect BTC to:
Tap OB
Reject with minor pullback
Break structure
Fill imbalance and target weak low
It’s a beautiful setup if managed correctly.
🧠 5. Psychology & Trap Narrative
Retail is:
Buying the breakout of Inside Bar
Placing stops under weak lows
Ignoring the OB rejection
Smart Money is:
Selling from OB
Riding the imbalance
Grabbing liquidity from below
This is where you flip from reaction-based trading to narrative-based execution.
🧮 6. Trade Setup Summary
📍 Entry Zone: $108,500–$109,700 (OB zone)
🔐 Stop Loss: Above $109,800 (invalidate OB)
🎯 Target:
TP1: $106,500
TP2: $104,000
TP3: $102,200 (Sell-side Liquidity Sweep)
⚖️ RRR: Approx. 1:4 to 1:5 depending on entry
⚠️ Risk Management:
Do not overleverage.
This setup rewards patience and narrative confirmation, not emotional entries. Wait for OB confirmation and rejection.
📈 If this hits, it’s a chart you screenshot and study again and again.
💬 Comment “INSIDE BAR MASTERCLASS” if you’re watching this play out live. Share with your trading circle.
Clear DayTrading strategy video. The "Inside Bar"🔉Sound on!🔉
📣Make sure to watch fullscreen!📣
Thank you as always for watching my videos. I hope that you learned something very educational! Please feel free to like, share, and comment on this post. Remember only risk what you are willing to lose. Trading is very risky but it can change your life!