Ichimoku Keltner Strategy (by Flexa)-INDICES/METALS BacktestingThe pair and the timeframe you see is the winner in the INDICES/METALS category with profit factor criteria
From 4032 results we have for this strategy :
* 1012 results with Profit Factor > 1
* 1002 results with Profit Factor>1 and Sharpe Ratio>0
* 82 results with Profit Factor>1 and Sharpe Ratio>0 and Percent Profitable>50
Using the previous data :
* Best timeframe for all categories : 1m with 46 and 10m with 42 pairs
* Best pair for all categories : BINANCE:ETHUSD with 27 timeframes
* My rat
Keltner Channels (KC)
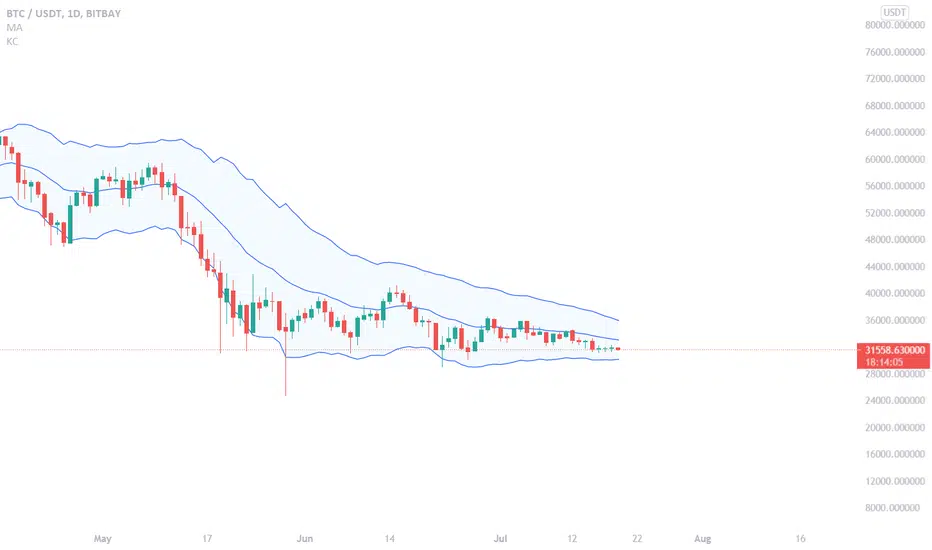
As Keltner Channel Flattens out - BIG move for Bitcoin comingAs we can see BTC is caught in the lower half of the Keltner Channel, which is a type of consolidation typically seen just prior to explosive price movements.
I cannot say this will be the upward trend we are waiting for, it could go down much further. But either way, the next move should be big.
B
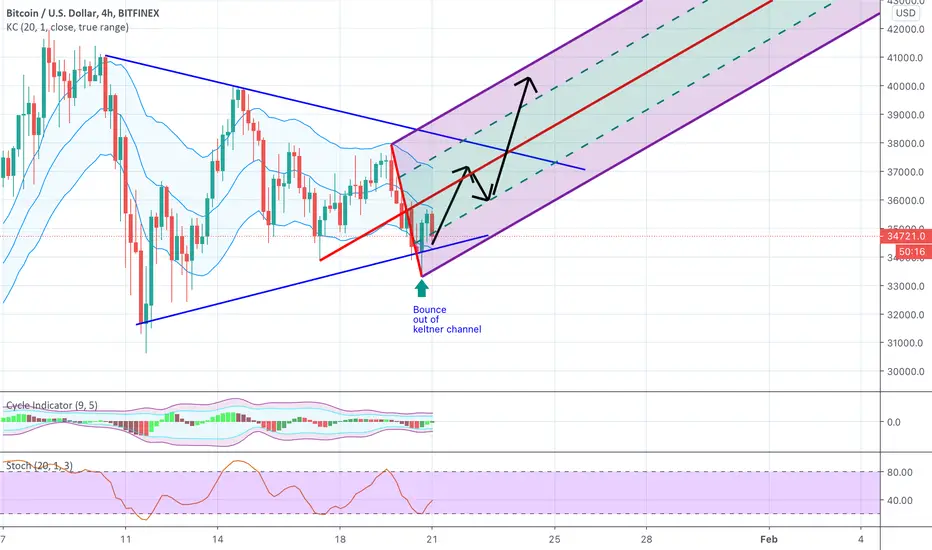
BTCUSDT - Short by Keltner Channels 23 Jan 20211. How to use Keltner Channels
a_ Length of Keltner's basis line is 50. It gives the best result in finding rule of BTCUSD.
b_ How to confirm a trend.
- Upper 2 is used to confirm Keltner channels at Uptrend.
- Lower 2 is used to confirm Keltner channels at Downtrend.
c. How to determine a swing Entry.
_ Upper 1 is used to buy when the market makes a corrective.
_ Lower 1 is used to sell when the market makes a corrective.
2. Long signal is confirmed when Closed of candle crossover the Upper 2.
EURUSD - Signal by Keltner - Stoch - ADX 14 Jan 2021Risk/reward: 1/1.3 | Entry by: Upper/Lower | Keltner crossing: 2 | Candle not entry: 80% | Stochastic: 70/15 | Adx: 31/9/9 | Notrade friday
Max risk: 1.5% - Risk / reward: 1 / 1.3.
1. Trend identification:
... Keltner: Price Through Upper / Lower 1 gives 1 point. 2 points are eligible for entry.
... Stochastic:
...... k> 70: Uptrend. k <15: Down trend.
... ADX: 31 provides strong trend following signal.
2. Entry point:
... Price corrects to Upper / Lower when 3 conditions Keltner , Stochastic &
EURUSD - Signal by Keltner - Stoch - ADX 12Jan 2021Risk/reward: 1/1.3 | Entry by: Upper/Lower | Keltner crossing: 2 | Candle not entry: 80% | Stochastic: 70/15 | Adx: 31/9/9 | Notrade friday
Max risk: 3% - Risk / reward: 1 / 1.3.
1. Trend identification:
... Keltner: Price Through Upper / Lower 1 gives 1 point. 2 points are eligible for entry.
... Stochastic:
...... k> 70: Uptrend. k <15: Down trend.
... ADX: 31 provides strong trend following signal.
2. Entry point:
... Price corrects to Upper / Lower when 3 conditions Keltner , Stochastic & A
GBPSD - Signal by Keltner, Stochastic & HigherLow LowerHighstop / profit: 2/2; keltner cross: 1; reset entry; keltner confirm: upper / lower 1; stochastic: 80/17; LH / HL: 5
Max risk: 4%.
Trend identification:
- Keltner Channel: Price cross Upper / Lower 1.
- Stochastic:
... Up trend: index k> 80
... Down trend: index k <17.
- Higher High Higher Low:
... Increase: Higher Low (HL)
... Decrease: Lower High (LH)
How to enter an order:
All 3 above conditions enter the order when the Stochastic indicator lets k crossover d into the Buy order. k crossunde
EURUSD - Signal by Keltner - Stoch - ADX 31/12/2020Risk/reward: 1/1.3 | Entry by: Upper/Lower | Keltner crossing: 2 | Candle not entry: 80% | Stochastic: 70/15 | Adx: 31/9/9 | Notrade friday
Max risk: 3% - Risk / reward: 1 / 1.3.
1. Trend identification:
... Keltner: Price Through Upper / Lower 1 gives 1 point. 2 points are eligible for entry.
... Stochastic:
...... k> 70: Uptrend. k <15: Down trend.
... ADX: 31 provides strong trend following signal.
2. Entry point:
... Price corrects to Upper / Lower when 3 conditions Keltner , Stochastic & A
NZDJPY - Day trade by Keltner 16/12/2020The right screen is never predicting before. Just a the best result at the history for confident to using for Trade.
------------------------
Risk: 1%.
1. The Long signal is calculate by the Close of candle crossing up The Keltner Channel Upper.
2. The Short {Sell] signal is calculate by the Close of candle crossing down The Keltner Channel Lower.
3. Reset the Up/Down confirm at Entry.
4. Don''t entry when occurs the Reversal Candle (over 80% the Heigh of Keltner Channel).
5. Stoploss and Ta
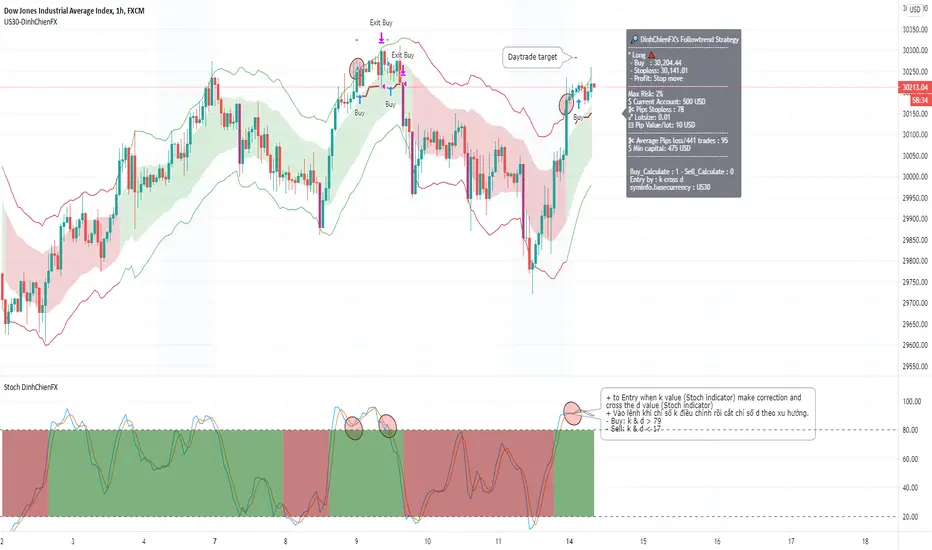
US30 - Follow the trend by Keltner & Stoch indicatorMax risk: 2%.
Stop loss move follow the trend.
------
+ A Long trend is when the price close & crossover the Keltner Upper 2 + k value of Stochastic indicator crossover 80.
------
+ A Short trend is when the price close & crossunder the Keltner Lower 2 + k value of Stochastic indicator crossunder 20.
------
+ to Entry when k value (Stoch indicator) make correction and cross the d value (Stoch indicator)
- Buy: k & d > 79
- Sell: k & d < 17
NZDJPY - Day trade by Keltner 11/12/2020- Double bottom is with false breakdown.
- Higher High H4 timeframe
------------------------
The right screen is never predicting before. Just a the best result at the history for confident to using for Trade.
------------------------
Risk: 1%.
1. The Long signal is calculate by the Close of candle crossing up The Keltner Channel Upper.
2. The Short {Sell] signal is calculate by the Close of candle crossing down The Keltner Channel Lower.
3. Reset the Up/Down confirm at Entry.
4. Don''t entry
Neo may test bullish channelThe moving average at 100 day close and 21 close are beginning to converge amidst resistance test. This local resistance is at $118 and will be approached in in the coming day. If volume picks up and Bollinger bands and Keltner channels stay tight with increased volume, a bull run is possible. If a bounce off the resistance happens and movement breaks the local support at $94 expect a bear run to the next support. Overall, optimistic that Neo will shine this spring and will be $250 by summer.
NLong
Gold Trades in Tiny Range as Big News Weekend AwaitsGold closed up a point and a half today on an extremely low volatility day and ended the day trapped within the net of the 7 day moving average and the upper band of the Keltner Channel. I expect another quiet day tomorrow as the world is waiting for the results of the French election this weekend. If the populist candidate wins and the French decide they want out of the EU, this could create major disruption in the global markets. Gold could be the big winner in all of this as the precious meta
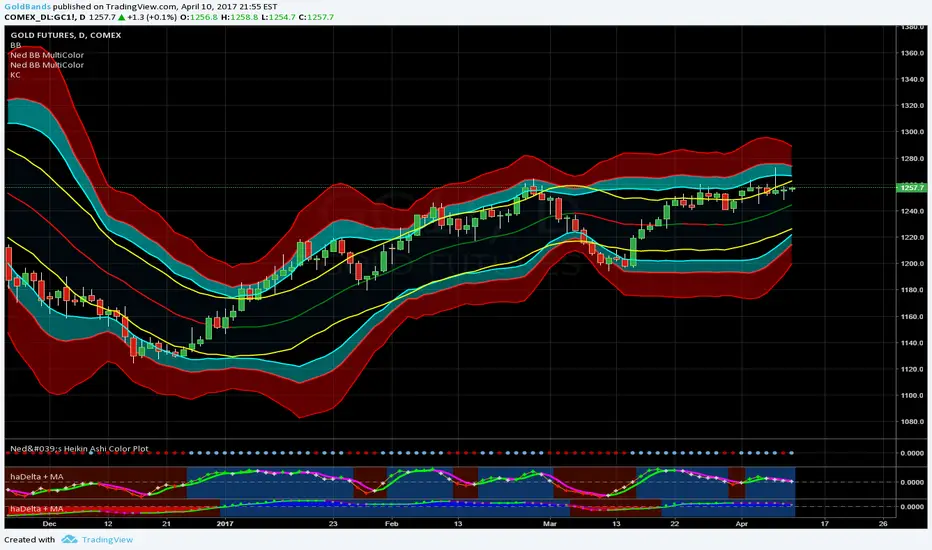
Gold Falters Amid Profit Taking at Over Bought LevelsGold closed flat on the day after pushing up into the 2 to 3 Std Dev Bollinger Bands. The low of the day was at the .618 Fib level. The daily haDelta also turned red today (top indicator) although the weekly haDelta remains bullish (middle indicator). So while it is clear that Gold is over bought, there is no confirmation yet that the uptrend is over. I will be watching to see the reaction at the 1277 level which is where both the 7 day moving average and the upper Keltner Channels are.
The Hei
Gold Stays Range-Bound After Friday's KnockdownOn Monday, Gold closed up .8 points but did not recover any of the momentum after last Friday's explosive move up and then equally explosive sell off to end the day and the week. After that action last Friday, Gold continues to trade within a tight range that started on March 22. It is obvious that the Bollinger Bands are contracting and the haDelta is poised to cross over to the downside. In addition, Monday's Heikin-Ashi candle was red (see chart below). The overall outlook, at this point, is
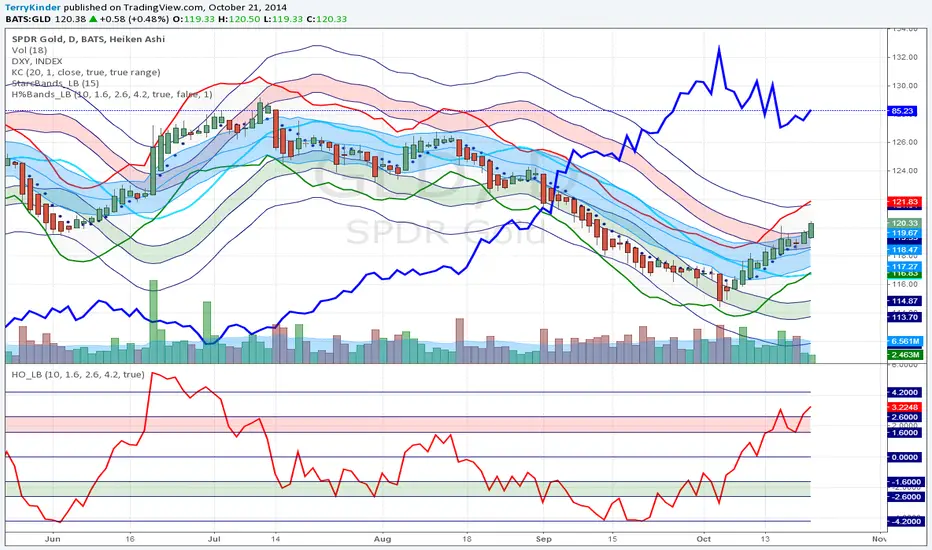
GLD Overbought, but Could Become More SoGLD has become overbought as shown by the Hurst Bands. Price could possibly exceed the overbought Hurst Band (pink colored band).
The Starc - (minus) Band has crossed over the middle (light bluw) line of the Hurst Bands. This is typical when price action begins to become extreme. It does not mean that the extreme price action cannot or will not continue for a while longer. I'm thinking it probably will.
Price is approaching the top of the Keltner Channels (blue bands) which indicates strong pr
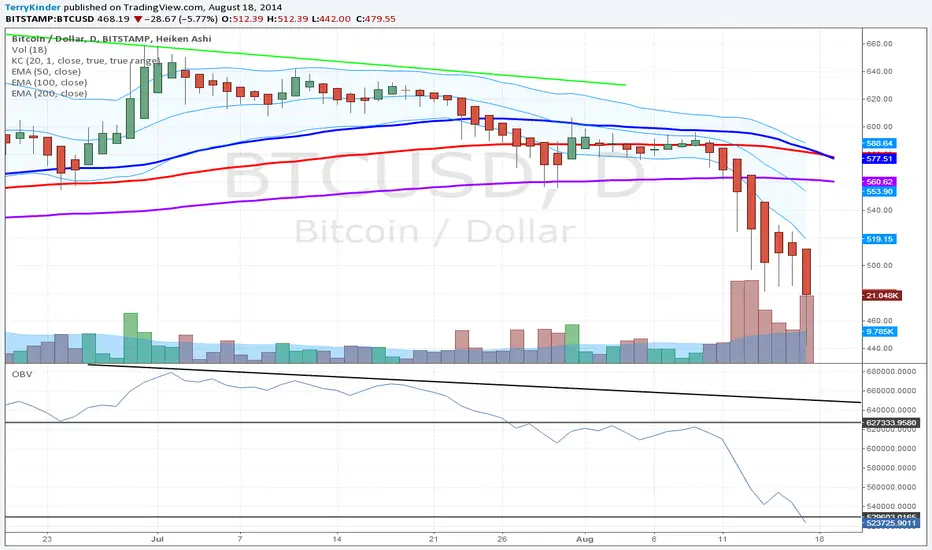
Bitcoin Technical Breakdown ContinuesBitcoin continues its technical breakdown. On the 1-day chart the 50-day EMA has crossed below the 100-day EMA. You'll also notice Bitcoin price has dropped far below the 200-day EMA as well.
In addition, Bitcoin has fallen below the Keltner Channels, which is something I had mentioned as a possibility in the past.
On Balance Volume (OBV) is at an extremely low level. The last time OBV was at these levels Bitcoin price was closer to $100 than $200.
Expect the pain to continue.
Bitcoin Price and Volume Trend is Still DownAt this point the Bitcoin price has made a decent recovery from past couple of days where price dropped to the mid-$550's. However, looking at the chart the Bitcoin price and volume trends from June are still down. While the price in relation to the Keltner Channels and moving averages did not behave as I thought, I believe they will still exert influence on the price.
For example, the price could go to the top, or perhaps even above the Keltner Channels - somewhere just North of $620. But, the