SP500 RISINGS&P500 starting to make it's way UP. Looking for the next minor zone before seeing the reaction and analyzing it's next move.Longby SETLifeTrading2
QNT | Crypto | Q4 Oct 2026 - Day chartQuant (QNT) is an enterprise-grade cryptocurrency network focused on blockchain interoperability through its proprietary operating system, Overledger. Unlike typical decentralized blockchain projects, Quant operates as a traditional corporate entity (Quant Network Ltd.) to cater directly to central banks, institutional financial networks, and large enterprises -------------------------------------------- This is Multiple timeframe analysis through 8 timeframes. Everything labeled on screen anby ChartGallery2
ES 1H || pre market lower low1H Chart Context & Bias During the pre-market session, price established a lower low, closing lower than the previous day's low. Based on this structure, our primary bias for the day is strictly short. Alternative Scenario: If price manages to close above the 1H SL level at 7693.75 prior to the NY session open, our short bias is invalidated, and we stand aside. 5m Chart Entry Trigger (Short Model) Once aligned with the 1H short bias, we drop down to the 5m timeframe for precise executioShortby kamartrades22
SOL: Macro Liquidity Purge and CISD Confirm Bullish ExpansionThe Structural Shift: A decisive sweep of multi-month sell-side liquidity ($$$) purged resting stops, sparking an energetic Change in State of Delivery (CISD) on the weekly timeframe. This displacement confirms institutional absorption and shifts structural market delivery firmly bullish. The Key Mitigation: Price has pulled back cleanly into high-confluence demand, retesting the breached S&R flip and resting inside the 1-week Fair Value Gap (FVG). Defending this discount pocket provides theLongby SmellyTaz2
XAU/USD 03 November 2026 Intraday AnalysisH4 Analysis: -> Swing: Bullish. -> Internal: Bearish. Bias and analysis remains the same as yesterday's analysis dated 02 November 2026. Price has finally printed according to my bias and analysis dated 30 June 2026 where I mentioned price to trade up to either premium of internal 50% EQ, or H4 demand zone before targeting weak internal low, priced at 3,942.100. This clearly demonstrates the fractal nature of the markets and the power of Technical Analysis. Price has printed a bearishby Khan_YIK11
High Probability Day Trading: The Support Gained & Lost Strategy Market momentum moves through three distinct phases before establishing a clear direction. Uptrend Momentum Price consistently forms higher highs and higher lows. Buyers are in clear control, pushing the market upward. Downtrend Momentum Price establishes lower highs and lower lows. Sellers dominate, forcing the market downward. Accumulation / Distribution Price moves sideways within a defined range. The market is consolidating and building liquidity before deciding on its next major dEducationby kamartrades4
CRUDE OIL (WTI): Pullback From Support Continues Crude Oil dropped to a key daily horizontal support level yesterday. The price formed a double bottom on that on an hourly time frame and successfully violated its horizontal neckline this morning. Expect a pullback to 98.0 level. ❤️Please, support my work with like, thank you!❤️ I am part of Trade Nation's Influencer program and receive a monthly fee for using their TradingView charts in my analysis.Longby VasilyTrader12
Trend First: How to Identify Market StructureEducational Series — Part 1 Before looking for entries, indicators, or chart patterns, I believe every trader should answer one fundamental question: What is the market actually doing? Understanding the trend provides context for almost every trading decision. And we don't need complicated indicators to identify it. 1. Understanding Market Structure Market structure is the sequence of highs and lows formed by price. Uptrend: Higher Highs (HH) and Higher Lows (HL). Price forms progEducationby Donatelio29
USDCHFOn the daily chart, price has broken through the demand zone shifting market structure from bullish to bearish. Price is seeking to contact the unmitigated demand at the weekly level where we have placed our buy limit orders at 0.8115. The targeted exit is the price imbalance ranging from 0.845 to 0.87.Longby morrisgitau5
CHFJPYOn the weekly charts, we have a shift in market structure from bearish to bullish. Presently, price is seeking to clear the price imbalance which coincides with ideal sell limit entries either at 196.325 or 195.27. Our exit is the price imbalance at 178.Shortby morrisgitau2
EURCHF: Two-Week Floor Broke. Sell the Retest Towards 0.9100?EURCHF just lost the floor it had been sitting on for two weeks, and the franc has had its strongest month in years. October was brutal for this pair. It dropped from the 0.9480s at the end of September to the 0.9200s, roughly 3% in a month, which is a big move for EURCHF. For the last two weeks it found a floor around 0.9180-0.9195. It held the week of 19 October, held again last week, and held again on Friday. Yesterday it finally gave way and dropped to 0.9156. So the question is: is the Shortby AlgoVaults0
INMD | Q4 Oct 2026 - Day chart 11/11 EarningsInMode Ltd. | "designs, develops, manufactures and markets minimally-invasive aesthetic medical products" Basic EPS (TTM) 1.24 USD Price to earnings Ratio (TTM) 10.96 -------------------------------------------- This is Multiple timeframe analysis through 8 timeframes. Everything labeled on screen and is explained below. If you care to understand "Candle Science" (price action T.A.) continue reading... Its 4 candles total - 2 on the support side, 2 on the resistance side. These 4 candles creaby ChartGallery1
CFOR | Q4 Oct 2026 - Week chart | 8.17 RVol on Monday afternoonWhat is CFOR? C4 of stocks maybe cause its exploding out the gate with 8.17x its weekly volume on a Monday. Lets just see what happens. Multiple timeframe analysis only shows yearly, monthly and 1 weekly level of interest ----------------------------------------------- CFOR | CapForce Inc. "is a precision medicine company, which engages in the power of molecular diagnostics and informatics to help combat infectious disease. " ------------------------------------------------ This is Multiplby ChartGallery0
HNGE | Q4 Oct 2026 | Day chart | Earnings & < 100M float sharesHinge Health, Inc. | "is a digital healthcare company, which engages in software for joint and muscle health care. It leverages software, including artificial intelligence, to automate care for joint and muscle health, delivering member experience, member outcomes, and cost reductions for its clients. " Is stock profitable? EPS dil TTM = $1.30 Is stock under/over valued? P/E = 88.16 (industry avg ~ 42) FCF per share TTM: $3.40 Total debt per share FQ: $0.07 --------------------------------by ChartGallery0
TSLA 2023 vs. 2026: Breakout or Fake-out?TSLA is respecting the same algorithms we saw in 2023 and telling a very similar story. Here’s the side-by-side: and my plan to confirm the breakout, rejection, or invalidation. Liquidity build (high to low) 2023: ~$414 to $101.81, -75% over ~61 weeks Now: $498.83 to ~$298, -40% over ~31 weeks Bottom to break of the black 2023: +138% in ~22 weeks Now: +36% in ~14 weeks The bounce is faster and stronger this time. The key difference In 2023, price respected a tapered, weaker buyingby BtheTrade838
BTC | Wk 45!! - 1hr chart Price is in distribution on the higher timeframes still and must find a higher timeframe level of support. What higher timeframe levels of support are below price? (or levels acting as support so long as price stays above them?) Daily Inv.BS levels could act as support long enough for price to develop the levels of support needed to create an accumulation trend but I don't bank on those probabilities, I'm simply aware of them. I look for the Frontside support levels and the Inverse Frontside reby ChartGallery0
XAUUSD: Bullish Scenario Confirmed – Targets at 4009 and 4049A few hours ago, we outlined two possible scenarios for Gold after its sharp selloff. The first scenario was a recovery from the daily support area, and that is now playing out. TVC:GOLD Gold reacted to the support around 3886 and started recovering. After the initial move, we identified a potential buy zone on the 15-minute chart, where price found buyers and moved higher. The bullish setup is now active. Current Buy Setup M15 Buy Zone: 3940–3950 Support Zone: Around 3915–3923 Invalidby pullbacksignal22
# Bitcoin 2H | One Five-Wave Advance, Two Different Interpretati**Reading time: Approximately 2 minutes** Was Bitcoin’s previous five-wave advance the beginning of a new bullish trend, or the final upward move before a larger reversal? Before the Binance security incident, several analysts, including myself, had already considered the possibility that this advance was a bull trap. In my wave count, it could have represented the final wave of a larger-degree **Expanded Flat**. Now, two interpretations remain on the table: ### 🟢 Bullish Case | A Correctionby Mehdi_Abbasi_EWP618
EURUSD pushing itEURUSD has gained some momentum to rise after the markets opened. Currently in a Pullback in the lower TimeFrame and starting to make some shifts. On the Daily waiting to see if today will close strong for extra confirmation.Longby SETLifeTrading3
GBPJPY: Pullback From Key Level 🇬🇧🇯🇵 I took a short trade on GBPJPY pair after the formation of an imbalance bearish candle on an hourly time frame. The imbalance occurred after the test of a key historical resistance level. The market will likely retrace to 211.41 level. ❤️Please, support my work with like, thank you!❤️ I am part of Trade Nation's Influencer program and receive a monthly fee for using their TradingView charts in my analysis. Shortby VasilyTrader25
Why Does Price Respect Some Zones but Ignore Others?Have you ever wondered why price reacts beautifully from one demand or supply zone, but completely ignores another? Both zones may look similar on the chart. Both may have been identified using the same methodology. Yet, their outcomes can be very different. The reason? Not all zones are created equal. Zone quality matters. So, what separates a high-quality demand or supply zone from a weak one? Let's look at four important factors we consider when evaluating zones. 1. ZONE FRESHNESS – HEducationby SurjeetKakkar45
Bitcoin / U.S. Dollar (BTCUSD - 4H Structural Outlook)Bitcoin / U.S. Dollar (BTCUSD - 4H Structural Outlook) Price is currently navigating between key demand and supply structures. We are closely monitoring the reaction around our highlighted interest zones to determine the next directional move. Trading Rule: Patience is key. Avoid front-running the market and ensure price confirms structural validation before any execution. Where do you see Bitcoin heading next? Are you expecting a push higher or further consolidation? Drop your thoughtby eLs-Trading1
XAU/USD 02 November 2026 Intraday AnalysisH4 Analysis: -> Swing: Bullish. -> Internal: Bearish. Price has finally printed according to my bias and analysis dated 30 June 2026 where I mentioned price to trade up to either premium of internal 50% EQ, or H4 demand zone before targeting weak internal low, priced at 3,942.100. This clearly demonstrates the fractal nature of the markets and the power of Technical Analysis. Price has printed a bearish iBOS. Current CHoCH positioning is denoted with a blue dotted horizontal line. Iby Khan_YIK1
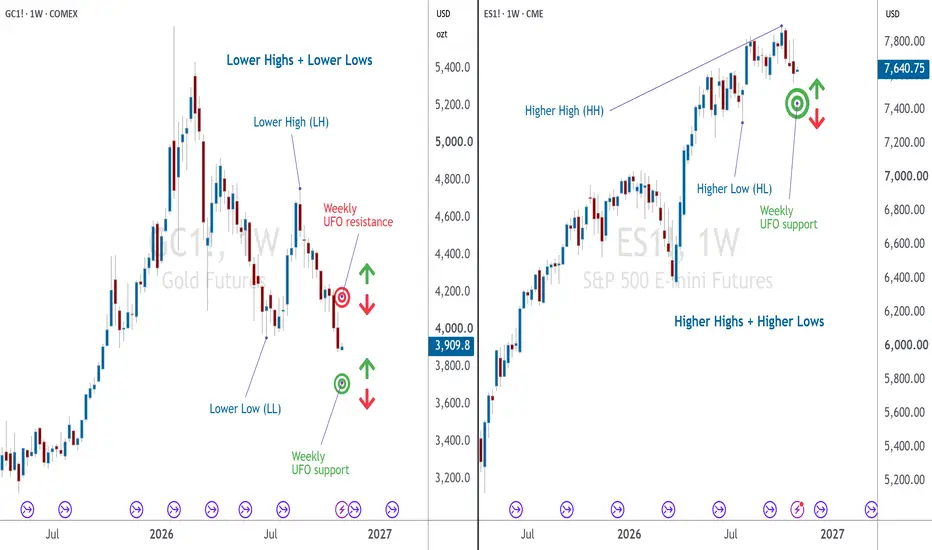
US Midterms: Same Direction, Different Market StructuresThe Same Price Direction Can Tell Two Different Stories With the US midterm elections scheduled for November 3, 2026, traders are approaching another significant event on the economic and financial calendar. Although the outcome of the elections and the subsequent market reaction remain uncertain, periods surrounding major scheduled events provide opportunities to examine how different markets respond to changing expectations. Gold and the S&P 500 offer an interesting comparison. As illustraEducationby traddictiv625
 LongLong
 Short
 Long
 Education
 LongEducation

 Long
 Short
 Short


 Long
 ShortEducationEducation