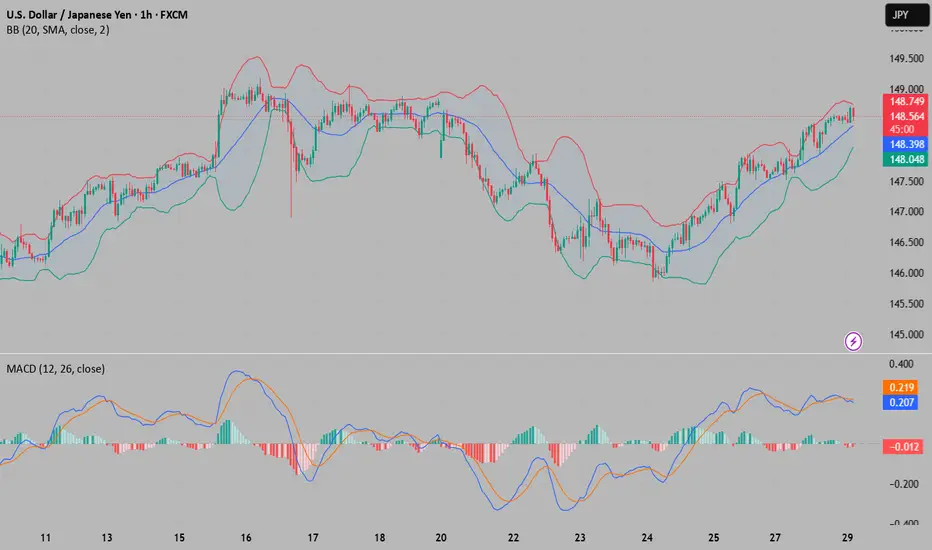
USD/JPY(20250729)Today's AnalysisMarket news:
After gold prices soared to an all-time high of more than $3,500 an ounce in April, the latest report from the Commodity Futures Trading Commission (CFTC) showed that fund managers have increased their bullish bets to the highest level in 16 weeks.
Technical analysis:
Today's buy and sell boundaries:
148.19
Support and resistance levels:
149.23
148.84
148.59
147.78
147.53
147.14
Trading strategy:
If the price breaks through 148.59, consider buying, the first target price is 1
Pin Bar
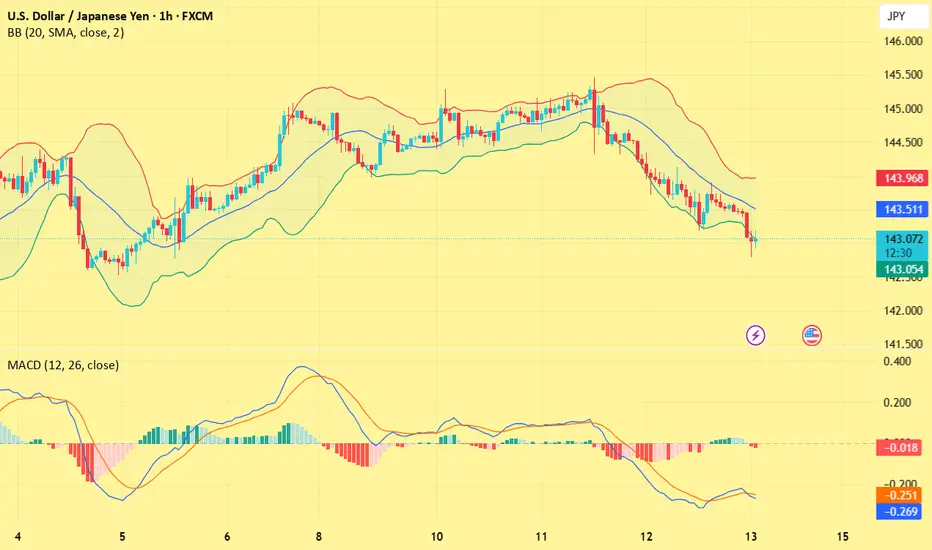
USD/JPY(20250728)Today's AnalysisMarket news:
Trump announced that the US and Europe reached a trade agreement: 15% tariffs on the EU, $600 billion in investment in the US, zero tariffs on the US by EU countries, the EU will purchase US military equipment, and will purchase US energy products worth $750 billion. However, the US and Europe have different opinions on whether the 15% tariff agreement covers medicines and steel and aluminum. Von der Leyen: 15% tariff rate is the best result that the European Commission can achieve
USD/JPY(20250724)Today's AnalysisMarket news:
U.S. President Trump continued to lash out at the Federal Reserve on Tuesday, but seemed to back off from the remaining plan to fire Chairman Powell. "I think he's doing a bad job, but he's going to be out of office soon anyway," Trump said in an exchange with reporters at the White House. "In eight months, he'll be out of office."
Technical analysis:
Today's buying and selling boundaries:
146.60
Support and resistance levels:
147.70
147.29
147.02
146.18
145.92
145.51
Trading
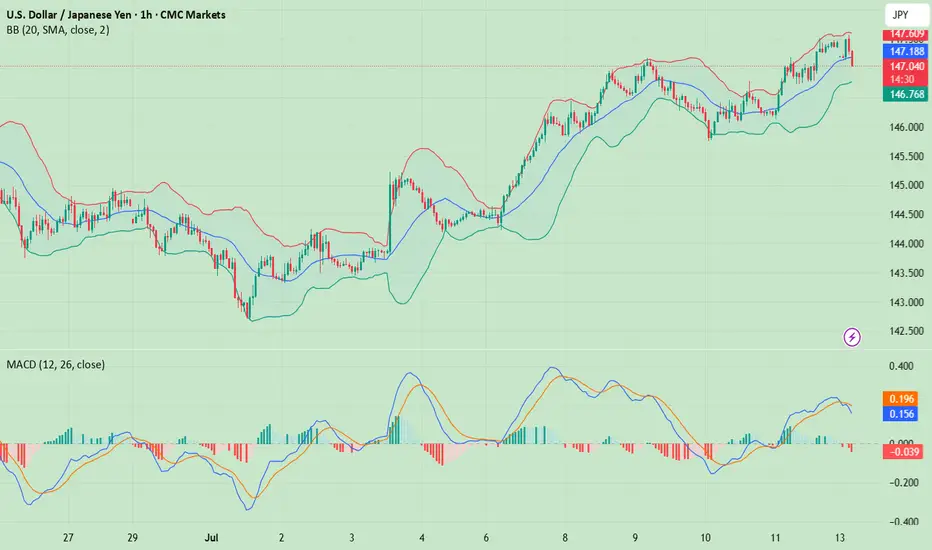
USD/JPY(20250714)Today's AnalysisMarket news:
① Fed's Goolsbee: The latest tariff threat may delay rate cuts. ② The Fed responded to the White House's "accusations": The increase in building renovation costs partly reflects unforeseen construction conditions. ③ "Fed's megaphone": The dispute over building renovations has challenged the Fed's independence again, and it is expected that no rate cuts will be made this month. ④ Hassett: Whether Trump fires Powell or not, the Fed's answer to the headquarters renovation is the key.
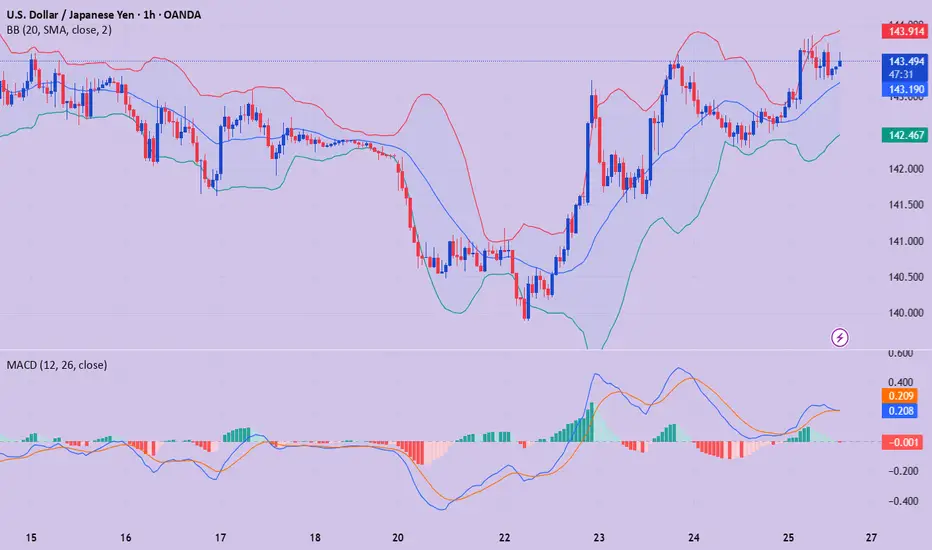
USD/JPY(20250616)Today's AnalysisMarket news:
Trump: The United States may still intervene in the Iran-Israel conflict. If Iran launches an attack on the United States, the United States will "fight back with all its strength on an unprecedented scale." Iran and Israel should reach an agreement.
Technical analysis:
Today's buying and selling boundaries:
143.79
Support and resistance levels:
145.47
144.84
144.43
143.15
142.74
142.12
Trading strategy:
If the price breaks through 144.43, consider buying in, the first target pri
USD/JPY(20250613)Today's AnalysisMarket news:
The number of initial jobless claims in the United States for the week ending June 7 was 248,000, higher than the expected 240,000, the highest since the week of October 5, 2024. The monthly rate of the core PPI in the United States in May was 0.1%, lower than the expected 0.30%. Traders once again fully priced in the Fed's two interest rate cuts this year.
Technical analysis:
Today's buying and selling boundaries:
143.73
Support and resistance levels:
145.09
144.58
144.25
143.21
USD/JPY(20250604)Today's AnalysisMarket news:
Fed Logan: We should focus on achieving the 2% inflation target rather than trying to make up for past inflation shortfalls; Bostic: We still think there may be a rate cut this year.
Technical analysis:
Today's buying and selling boundaries:
143.47
Support and resistance levels:
145.19
144.55
144.13
142.81
142.39
141.75
Trading strategy:
If the price breaks through 144.13, consider buying in, with the first target price of 144.55
If the price breaks through 143.47, consider sell
USD/JPY(20250429)Today's AnalysisMarket news:
The U.S. Treasury Department raised its second quarter debt forecast to $514 billion. U.S. Treasury Secretary: The "X Day" for the debt ceiling issue will be announced soon.
Technical analysis:
Today's long-short boundary:
142.62
Support and resistance levels:
144.52
143.81
143.35
141.89
141.43
140.72
Trading strategy:
If the price breaks through 142.62, consider buying, the first target price is 143.35
If the price breaks through 141.89, consider selling, the first target price
USD/JPY(20250425)Today's AnalysisMarket news:
Federal Reserve-①Hamack: If economic data is clear, the Fed may cut interest rates in June
②Waller: It will take until July to get a clearer understanding of how tariffs affect the economy. If tariffs lead to higher unemployment, interest rate cuts may be initiated. ③The Atlanta Fed GDPNow model predicts that the US GDP growth rate in the first quarter will be -2.5%. ④Kashkari: The frequent announcements from Washington have brought challenges to policymakers and everyone.
Technica
USD/JPY(20250416)Today's AnalysisMarket news:
U.S. import prices fell 0.1% in March from the previous month, the first month-on-month decline since September last year.
Technical analysis:
Today's buying and selling boundaries:
143.10
Support and resistance levels
144.08
143.72
143.48
142.72
142.48
142.11
Trading strategy:
If the price breaks through 143.10, consider buying, the first target price is 143.48
If the price breaks through 142.72, consider selling, the first target price is 142.48
A poem of the marketIn the financial markets, the Pin Bar candle is like a poem silently composed within the charts, a poem that tells the tale of the battle between buyers and sellers. This candle, with its long shadow, narrates the story of effort and defeat, as if one side sought to conquer the sky or split the earth, but in the end, was pushed back, leaving only a shadow of its aspirations.
**The Bullish Pin Bar** is like a poet who, in the darkness of night, sees a star and, with hope for light, draws its lon
Long Idea on CC1! (Cocoa)1)Climate change is having a significant impact on cocoa production in West and Central Africa, according to a study by Wageningen University & Research (WUR). The region accounts for more than 70% of global cocoa production. Changes in temperature and rainfall are making some areas less suitable for cocoa cultivation.
2) Seasonality gives us a bullish pattern which is 98% correlated with the actual price
3)quantitative data shows 80% win rate with a good profit factor
4) The price rejected
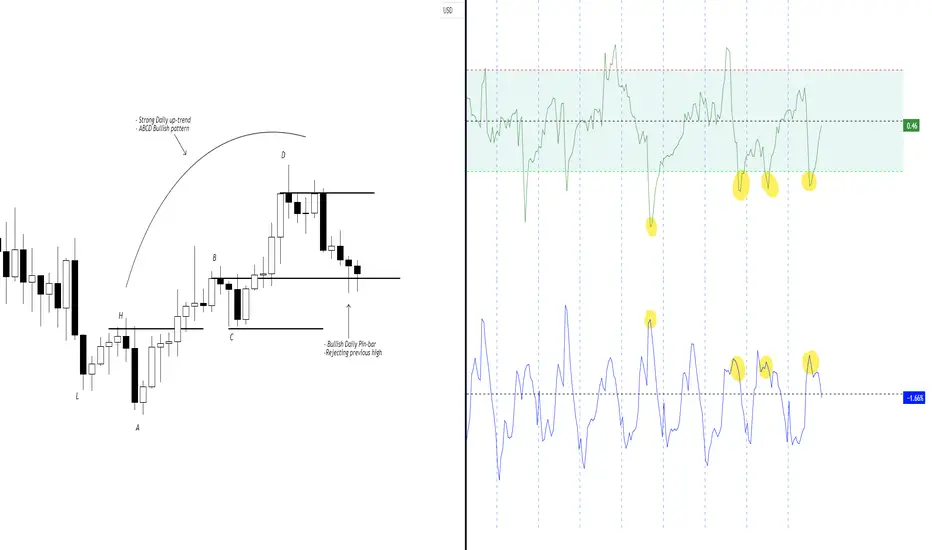
Strong EUR? - A EUR/USD AnalysisEUR/USD has displayed bullish characteristics over the last couple of weeks.
- We have reach a high in the market @ 1.095.
- This high was made after a bullish A,B,C,D pattern aka (Trend).
- In bullish markets, prices tend to find support at the previous high, the previous high in this market (To me) is @ 1.085.
- We currently have made a bullish pin bar rejection candle on 3/19/2024.
- Currently we have untapped orders at 1.098, this is where I believe prices want to go in the next month.
- Br
EUR/USD Builds Bullish Momentum with Strong Support and Pin BarAfter bottoming at 1.0760 exactly one week ago, FX:EURUSD has started to consolidate, forming what appears to be a base.
Since then, dips below 1.08 have been consistently bought up, culminating in a strong bullish Pin Bar candle yesterday.
To further support this bullish outlook, this base is forming at a key confluence of support levels, reinforcing the potential for an upward move.
With this in mind, I am looking to buy this pair, ideally on a dip, to ensure a positive risk-to-reward ra
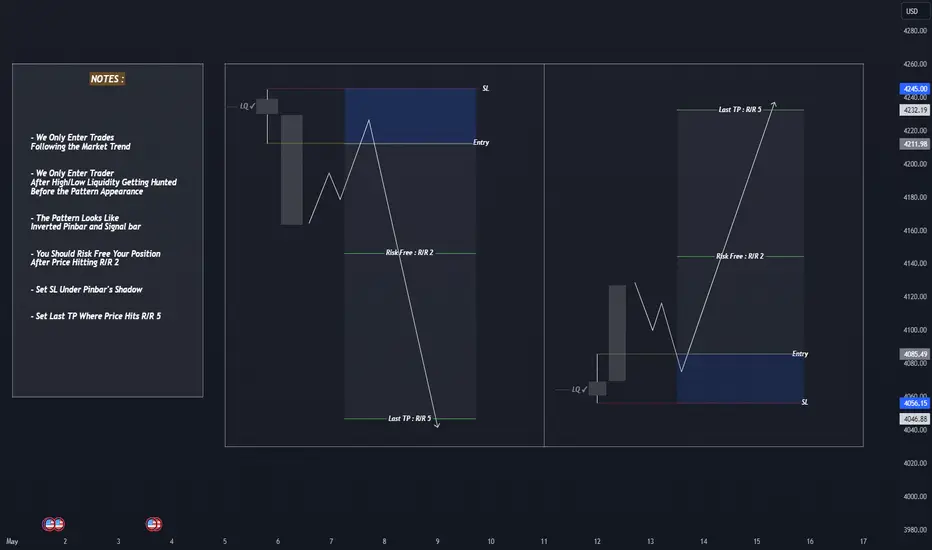
Strong buy on BitcoinThe price has seen the main break even and made a beautiful pin bar. It works as a strong buy signal. The stop loss is behind the shadow. The last target is the all-time high. As Bitcoin moves, every other coin moves in the same direction, too, so you can have long positions on other assets according to your personal strategy and entry point.
Bullish Divergence + Pinbar in TLTI'll start with the weekly RSI bullish divergence off the 2022 and 2023 yearly lows. In addition to that, there is also a nice bullish pinbar on the 4M chart. This also hints to a possible bottom/bullish reversal. Price is now pushing against the trendline resistance (from Mar 23' to Jul 24'). Once price is able to break and hold this area it could really start moving. There is some overhead resistance that the market will need to overcome and I expect plenty of volatility, so safest play m
GOLD - Pin bar bullishA bullish pin bar has formed on the gold chart, suggesting a potential rise in gold prices. If the price breaks above the 2325 resistance level, this would confirm the bullish trend. It is advisable to set a stop-loss in the 2310-2305 range to manage risk in case of a breakout.
Liquidity Hunt PatternLiquidity Hunt Pattern
Uncover Hidden Opportunities in the Market
Introduction:
The Liquidity Hunt Pattern is a powerful technical analysis tool that helps traders identify potential turning points in the market. By understanding how this pattern forms and its implications, traders can gain an edge in uncovering hidden opportunities and making informed trading decisions.
What is the Liquidity Hunt Pattern?
The Liquidity Hunt Pattern is characterized by a series of price movements that c
GBPUSD, Short, AB=CD Gartley222, Extended pin bar at key levelWe might play out this as a Gartley222. Not entering at the 78% retracement level,
but we have a great pin bar on the 2Hour chart at a very Key level. Close below the previous major low and a 1 to 1 AB-CD move.
Volume profile- the pin bar occurred on raising volume which for me indicates stops taken, but also it's what Wyckoff will call nonvalidation, huge volume, but the bar closed at its lowest. Nonvalidation is a good edge at turning points.
The red box is the 61% retracement of the AD leg
NFLX Short: Gap Fill and High RSIHey All,
I wanted to get your feedback on this analysis.
I am solely basing my opinion based on the RSI indicator, MACD and candlesticks on the daily chart.
Although earnings help NASDAQ:NFLX to go up slightly. It had to restest a strong resistance at 562.46. Once it reached the resistance the bears took control which resulted in a pretty strong bearish pinbar, usually signaling a reverse in trend. Along with the pin bar the RSI is way oversold and the MACD is looking like it is being s
Sell XAUUSD at current price (2040)XAUUSD (H4) Weak RSI divergence appears combined with a bearish Pinbar candlestick reversal.
We can execute a Sell order at the current price (2040) With trading plan:
Stop loss at 2048
TP 1 at 2030
TP 2 at 2020 : Fibonacci Retracement (0.382)
TP3 at 2001 : Fibonacci Retracement (0.618)
TP4 at 1990 : Fibonacci Retracement (0.786)
Weak divergence of RSI
Note: Capital management 2%