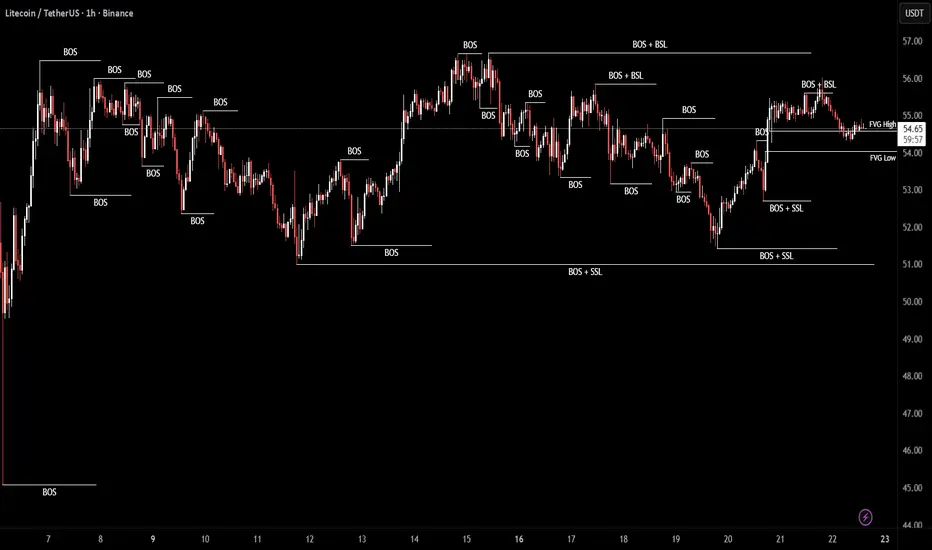
LTC/USDT | FVG zone! (READ THE CAPTION)By analyzing the hourly chart of LTCUSDT we can see that after initially going into the FVG zone between 54.03 and 54.58, it has gone up again and above the FVG zone, being traded at 54.70. I believe that the FVG zone will be touched again. If Litecoin goes back inside the FVG and keeps itself above the FVG Midpoint (Consequent Encroachment) for the next 4 hours, I believe it can go back up and the targets are: 54.75, 54.95, 55.15 and 55.30.
If it goes below the FVG C.E.: 54.00, 53.80, 53.60 an
Pitchforks
Litecoin Is Primed For A Full Recovery!Litecoin is setting up like Nvidia in the bigger picture. I see mass adoption coming for crypto while most people are planning for a big, multi-year bear market. Last time we had bear markets in crypto, everything was very overvalued, but this time we are seeing that everything is super undervalued. Because of this, I see this as a really good chance to buy Litecoin and most altcoins.
As always, stay profitable.
- Dalin Anderson
Litecoin - Long-Term Bearish Structure, New Cycle Low ExpectedDuring previous bull runs (2017 and 2021) , Litecoin consistently made new all-time highs , breaking above prior peaks. However, an important historical pattern stands out: each bear market formed higher lows , suggesting long-term range compression.
At the current stage, this structure appears to be changing. Price remains in a prolonged consolidation phase, and a bear flag has formed on the monthly timeframe, which is a classic bearish continuation pattern following a strong downside imp
Litecoin is being ignored — That’s Usually When It Explodes! I’m posting Litecoin on the monthly timeframe because I genuinely believe LTC will have a run that very few people are expecting just not anytime soon.
In the near term, we may see some minor movement into March–April, but the larger moves I’m watching are toward the end of the year if price continues to hold the $53 support. If that level fails, the timeline likely shifts out toward early 2027.
That said, even those moves aren’t what I would consider the true volatility expansion. The real mo
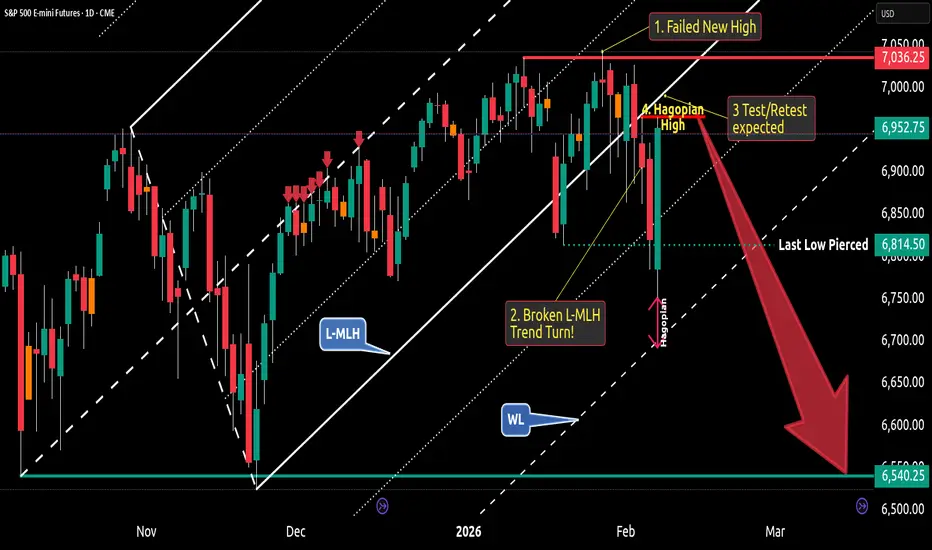
S&P500 Bearish Trend Turn - Here's My Short Trade🔱 As long as price follow the projection of a pitchfork, the trend is OK. But what we see here is a turn - and here's why:
1. The market failed to close above the last high. So, this is a failed new high - or a Double-Top
It is confirmed because the last low is pierced by the last Fridays bar.
2. Price opened & closed below the Lower-Medianline-Parallel = The projection of the fork, which shows the temporary trend, is clearly broken. And this means: Temporary Trend Turn.
3. What we see now wi
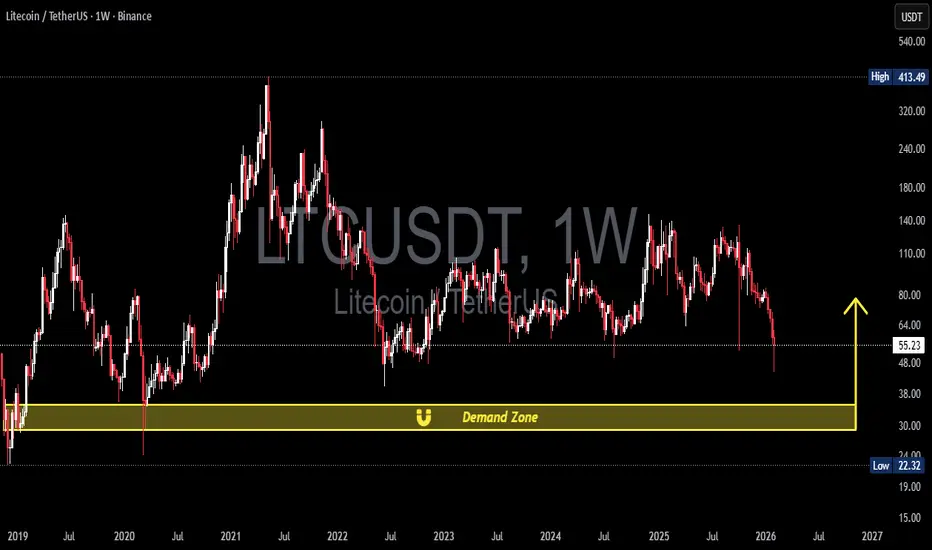
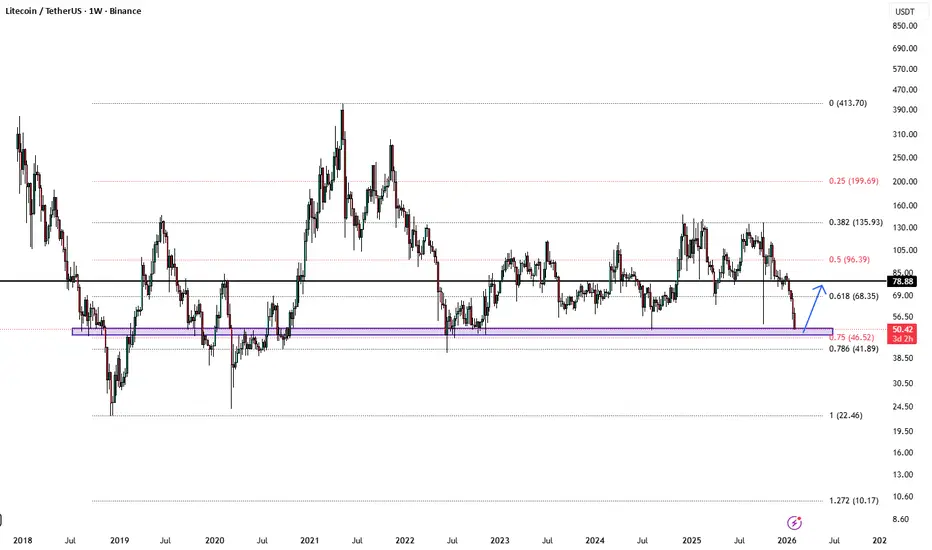
LTCUSDT — Cycle-Defining: Major Reversal or Deeper Drop?Structure & Pattern Formation
1. Macro Sideways Range
Since 2022, LTC has been moving within a broad range:
Resistance range: $110 – $140
Mid support: $60 – $70
Extreme demand: $35 – $29
This structure reflects a long accumulation / re-accumulation phase after the bear market.
---
2. Lower High Formation
From 2023 → 2025 we can observe:
Repeated lower highs
Buyers failing to break the $140 resistance
Indicating selling pressure remains dominant
This is characteristic of distribut
Bitcoin Bull Market RestartingMy updated primary count:
- RSI peaks ideally in wave 3's (orange circles)
- 200 weekly MA provides major cycle support + pitchfork level holding, which it appears to be respecting nicely
- Comparing altcoin charts, the vast majority topped in January 2025, supporting the idea that we've been in a corrective structure for a year now.
- Leads to question of what is more probable?
Bitcoin was the only crypto to be in a bull?
or
Bitcoin was also in a bear market?
Litecoin Halving Cheat Sheet 2026-2027This Litecoin chart shows a recurring halving-cycle structure where accumulation precedes halving events and distribution follows them.
Logical breakdown:
Green zones – pre-halving bottoms:
Across prior cycles (2015, 2019, 2023), Litecoin formed major price bases 6–18 months before each halving, marked here in green. These zones align with low volatility, depressed sentiment, and long-term buyers stepping in.
Orange zones – late-cycle risk:
Orange bands appear as price accelerates toward the
Crypto SILVER - LTCIn the world of traditional finance, Gold (XAU) and Silver (XAG) provide the ultimate blueprint for what we are seeing in the crypto markets today.
While Bitcoin (Digital Gold) has been busy smashing all-time highs and capturing the world's attention, Litecoin (Digital Silver) has been quietly ignored, stuck in a massive range for years.
If this feels familiar, it’s because we’ve seen this movie before in the metals market.
On the charts, we are witnessing a rare technical phenomenon: a
LTCUSD | Reality Check — Liquidity Hasn’t Been TakenHello traders,
I’m not bullish on LTC yet. You shouldn't be either.
1W TF for LTC is still as bearish as it gets. Massive stop loss orders for buyers are setting below $63.
The structure is clear: before any real bullish expansion, sell-side liquidity must be swept.
This historical uptrend is where long-term positioning gets reset. Every strong run LTC ever had came after price touched that line, shook out weak hands, and re-accumulated.
Remember this period (Q4, 2026)
📍 Levels I’m watc
Anglo American Monthly ViewAnglo American is in pursuit of a yearly low, first we look for a swing low, then a close above the 10 period moving average. At a minimum the yearly low will see price breach the upper resistance of the Pitchfork. In terms of time, we are within a time after a long cycle from the COVID lows.
And Yes the whales are buyingThis market volatility over the last few weeks might be an attempt to shake out the weak holders.
If price moves out of the smaller micro range (as illustrated) and pushes back in and breaks structure bullish, this would be a buy signal for me.
**The trade only happens if these conditions are met.
Keep your eye on the market and respond when it shows.
Happy Trading.
Canary Litecoin ETF | LTCC | Long at $16.90Litecoin's price has returned nearly to my original $65 entry in 2024 . With Litecoin's halving scheduled in 2027, I am bullish long-term. Short-term could be volatile. Instead of the coin, I'm going into the ETF at $16.90 for less fees and easier management.
Targets into 2029
$21.00 (+24.3%)
$25.50 (+50.9%)
Litecoin’s Late-Stage Coil: The Phase Designed to Shake You OutIt often looks like a breakdown is coming near the end of a long coil because liquidity is thin and stops are obvious. Markets frequently probe below support to harvest liquidity and shake out late bulls. The difference between a fake breakdown and a real one is acceptance. Sweeps reclaim quickly. True breakdowns hold below and fail retests.
And that is exactly why the current moment feels so uncomfortable. When an asset has been compressing for thousands of days and is now pressing into the ap
Can LITECOIN replicate MONERO's rally??Just some fun chart trivia but we can't deny the obvious. And that's that Litecoin (LTCUSD) has been printing an (almost) identical price action since 2017 with Monero (XMRUSD).
That's up until a little less than a year ago when the two started to diverge aggressively as XMR (orange trend-line) entered a massive rally that broke above its ATH Resistance of the past 2 Cycles and made a new All Time High (ATH), while LTC has been under Lower Highs. However it hasn't broken below its Bull Cycle co
The start of something great is brewingLitecoin is showing clear signs of an automatic rally. This is the things you look for if the price moves lower.
1. One or Two breaks below the current low with the price bouncing back into the range after every low, this is a clear sign of accumulation.
2. Price moving to the top of the range after the spring has formed.
So I will only be bullish after I see the accumulation pattern play out.
Trade safe
Litecoin LTC price analysis📉 For weeks, OKX:LTCUSDT has been holding strong
And guess what — this consolidation has lasted over 3.5 years! 😮
💭 The last real pump was back in early 2021... feels like it’s time for a sequel, right? 😉
Now, here’s the interesting part:
🔹 Litecoin has the same tokenomics and mining method as Bitcoin ( CRYPTOCAP:BTC ) and
🔹 Recently, another “old school” coin — CRYPTOCAP:ZEC — just pumped hard 💥
🔹 And there are rumors about a potential LTC ETF 😏
With a current market cap of only $7.7B
#LTC/USDT analysis.Give me some energy !!!#LTC
The price is moving within a descending channel on the hourly timeframe. It has reached the lower boundary and is heading towards a breakout, with a retest of the upper boundary expected.
The Relative Strength Index (RSI) is showing a downward trend, approaching the lower boundary, and an upward bounce is anticipated.
There is a key support zone in green at 75.00, and the price has bounced from this level several times and is expected to bounce again.
The indicator is showing a trend to