$SOL Sitting on a Low-Volume Pocket. Watching for the SweepWatching CRYPTOCAP:SOL and I'd like to see this scenario play out. There's a local liquidity zone with no volume in it. Price clearly won't linger there, so we've got two options here.
Price flies through that low volume zone off this liquidity and holds above (no trade).
Liquidity grab and a return to the zone near 0.5.
The second scenario is the one that gives me a chance to enter a position. Watching closely, I'll be looking for a break on the lower timeframe in case of a sweep and absorption, and opening the trade if the conditions are there.
NFA!
Pivot Points
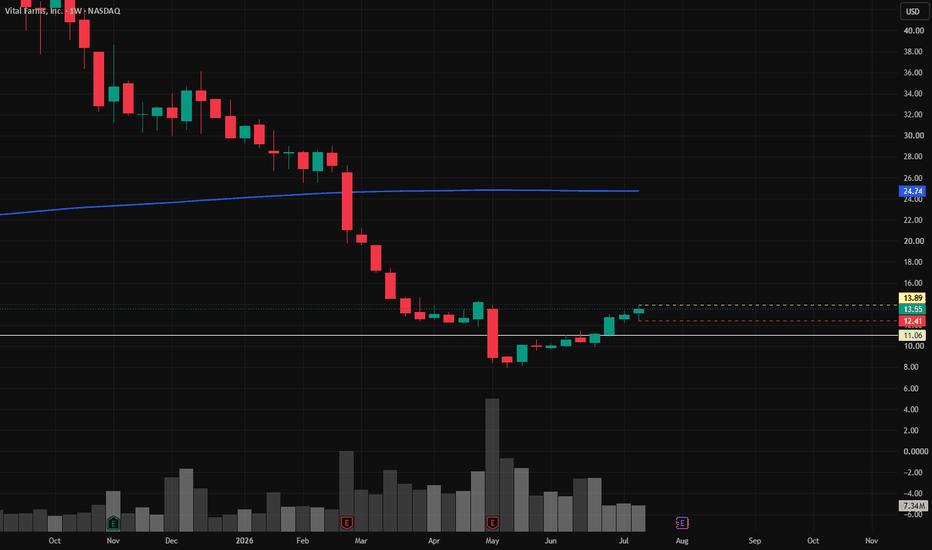
VITL | The time to go long has come- Timeframe: Weekly
- Trade type: Buy stop order
- Price: 13.89
- Take Profit: Open
- Stop Loss: 12.41 (-10.60 %)
Idea: Long on a breakout above last week's high - bullish momentum continuation.
Entry: Buy stop above last week’s high.
Stop-loss: Below the low of the same candle.
If the weekly candle closes below this level, the trade is invalidated.
Take Profit: Trailing stop following the lows of new weekly candles.
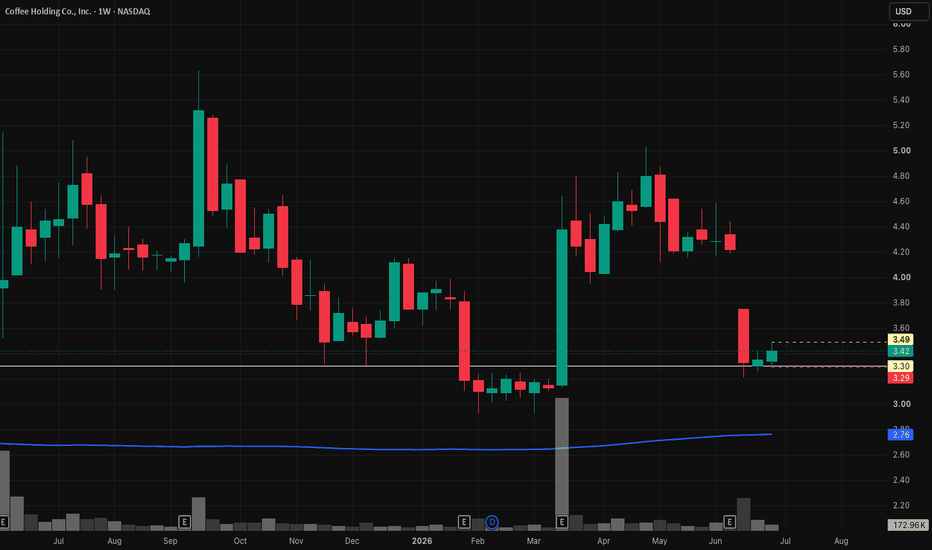
JVA | The time to go long has come- Timeframe: Weekly
- Trade type: Buy stop order
- Price: 3.49
- Take Profit: Open
- Stop Loss: 3.29 (-5.70 %)
Idea: Long on a breakout above last week's high - bullish momentum continuation.
Entry: Buy stop above last week’s high.
Stop-loss: Below the low of the same candle.
If the weekly candle closes below this level, the trade is invalidated.
Take Profit: Trailing stop following the lows of new weekly candles.
GTES | Continued stock growth- Timeframe: Weekly
- Trade type: Buy stop order
- Price: 27.44
- Take Profit: Open
- Stop Loss: 25.94 (-5.50 %)
Idea: Long on a breakout above last week's high - bullish momentum continuation.
Entry: Buy stop above last week’s high.
Stop-loss: Below the low of the same candle.
If the weekly candle closes below this level, the trade is invalidated.
Take Profit: Trailing stop following the lows of new weekly candles.
GLong
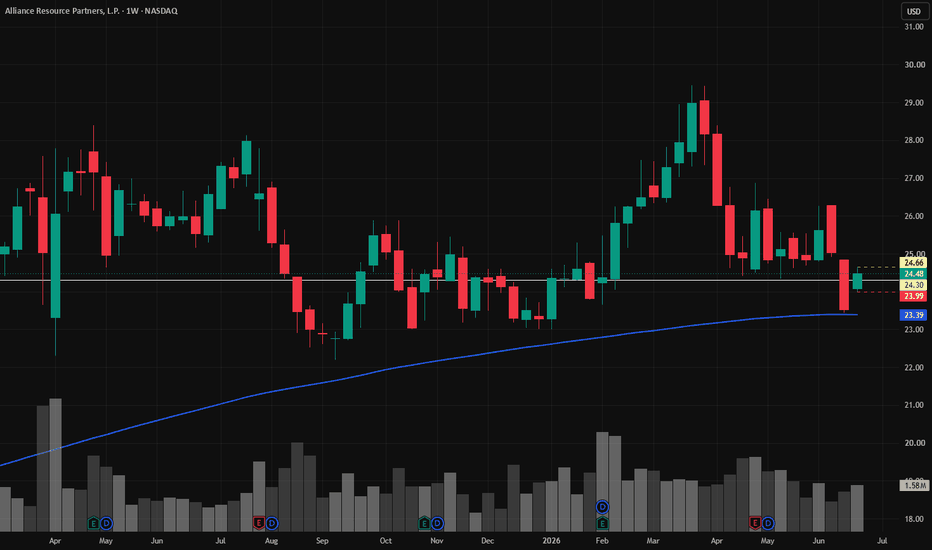
ARLP | Continued stock growth- Timeframe: Weekly
- Trade type: Buy stop order
- Price: 24.66
- Take Profit: Open
- Stop Loss: 23.99 (-2.70 %)
Idea: Long on a breakout above last week's high - bullish momentum continuation.
Entry: Buy stop above last week’s high.
Stop-loss: Below the low of the same candle.
If the weekly candle closes below this level, the trade is invalidated.
Take Profit: Trailing stop following the lows of new weekly candles.
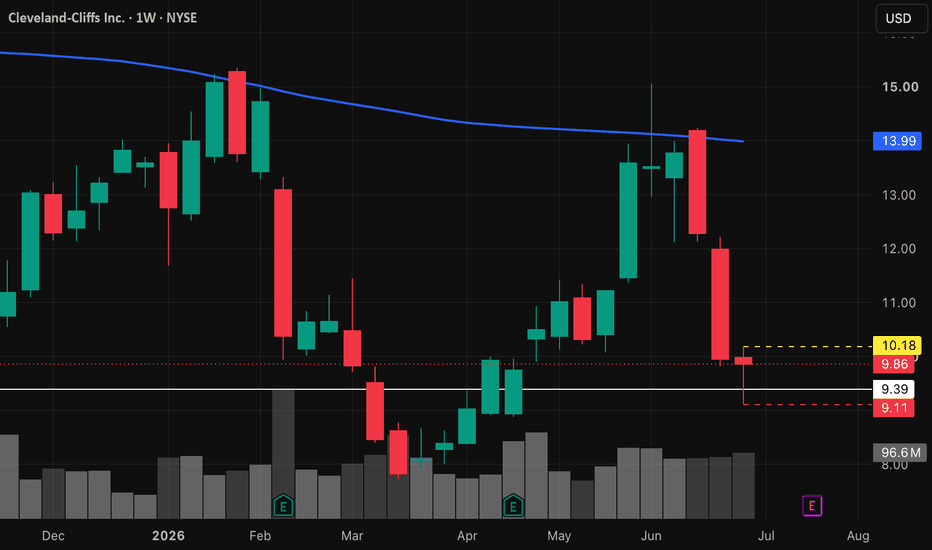
CLF | The time to go long has come- Timeframe: Weekly
- Trade type: Buy stop order
- Price: 10.18
- Take Profit: Open
- Stop Loss: 9.11 (-10.50 %)
Idea: Long on a breakout above last week's high - bullish momentum continuation.
Entry: Buy stop above last week’s high.
Stop-loss: Below the low of the same candle.
If the weekly candle closes below this level, the trade is invalidated.
Take Profit: Trailing stop following the lows of new weekly candles.
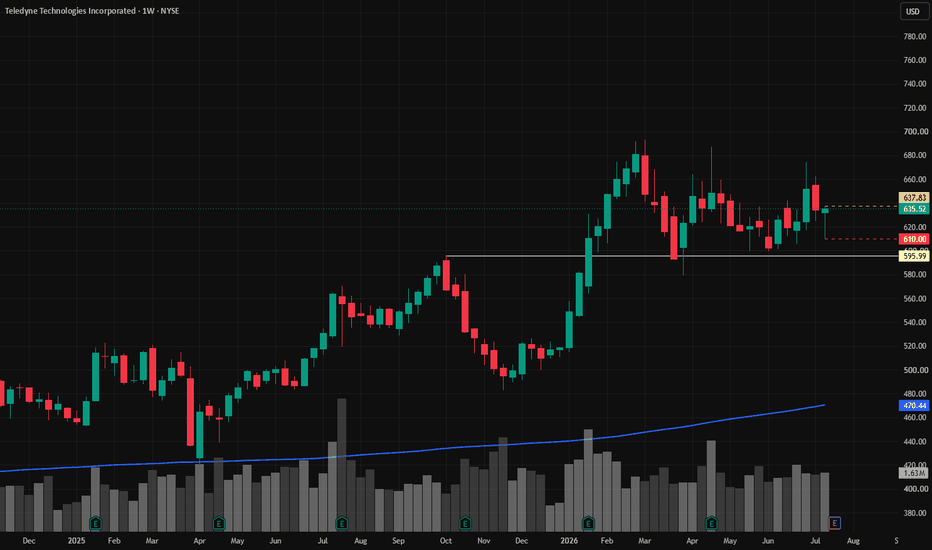
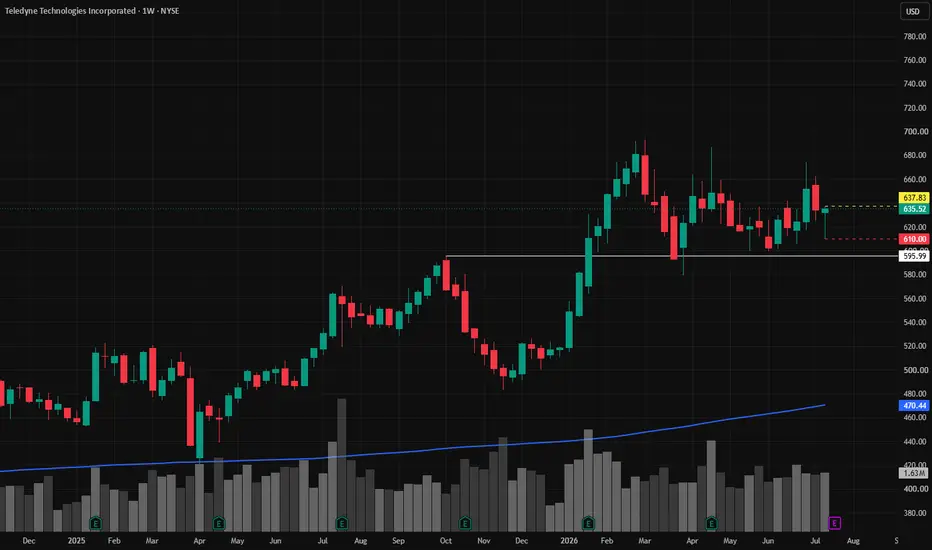
TDY | Continued stock growth- Timeframe: Weekly
- Trade type: Buy stop order
- Price: 637.83
- Take Profit: Open
- Stop Loss: 610.00 (-4.40 %)
Idea: Long on a breakout above last week's high - bullish momentum continuation.
Entry: Buy stop above last week’s high.
Stop-loss: Below the low of the same candle.
If the weekly candle closes below this level, the trade is invalidated.
Take Profit: Trailing stop following the lows of new weekly candles.
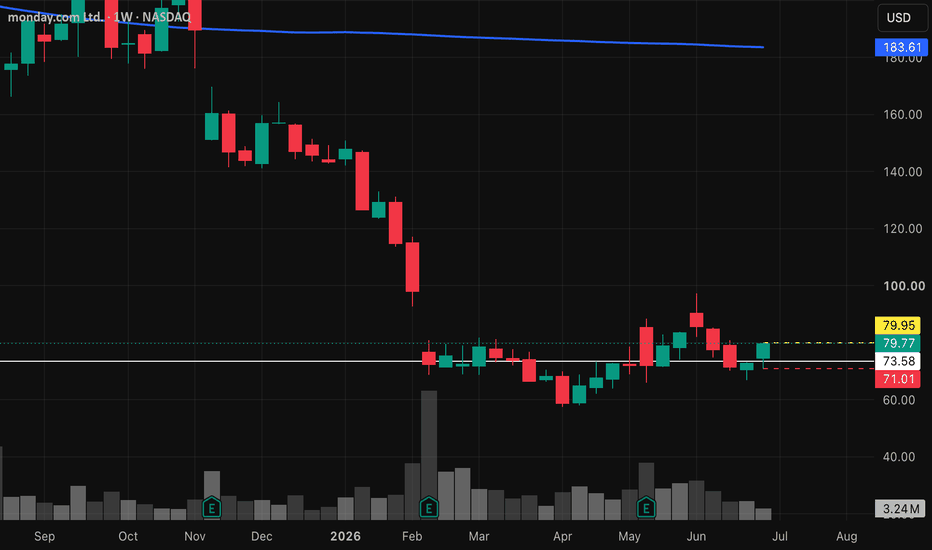
MNDY | The time to go long has come- Timeframe: Weekly
- Trade type: Buy stop order
- Price: 79.95
- Take Profit: Open
- Stop Loss: 71.01 (-11.20 %)
Idea: Long on a breakout above last week's high - bullish momentum continuation.
Entry: Buy stop above last week’s high.
Stop-loss: Below the low of the same candle.
If the weekly candle closes below this level, the trade is invalidated.
Take Profit: Trailing stop following the lows of new weekly candles.
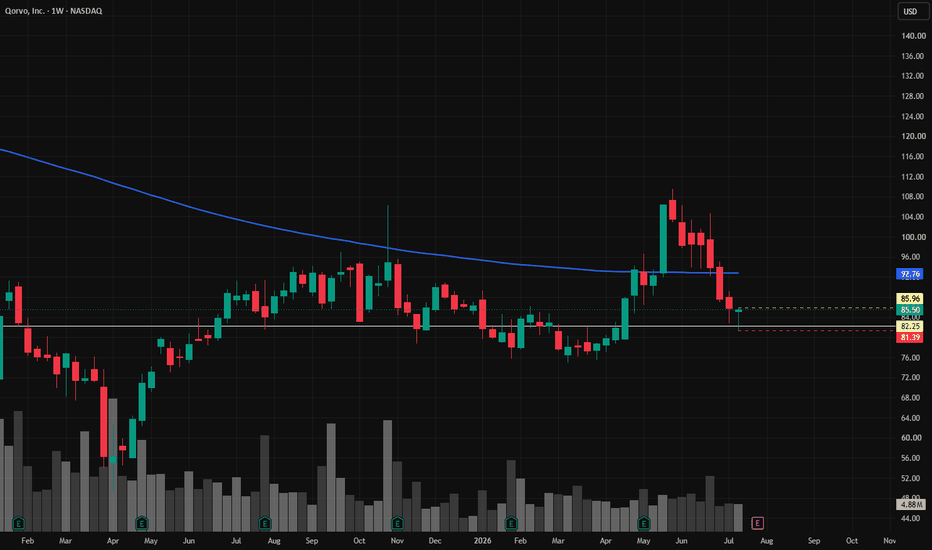
QRVO | The time to go long has come- Timeframe: Weekly
- Trade type: Buy stop order
- Price: 85.96
- Take Profit: Open
- Stop Loss: 81.39 (-5.30 %)
Idea: Long on a breakout above last week's high - bullish momentum continuation.
Entry: Buy stop above last week’s high.
Stop-loss: Below the low of the same candle.
If the weekly candle closes below this level, the trade is invalidated.
Take Profit: Trailing stop following the lows of new weekly candles.
Nifty Analysis EOD – 20 July 2026 – Monday🟢 Nifty Analysis EOD – 20 July 2026 – Monday 🔴
Calm Before Expiry: Bulls and Bears Breathe Easy Inside a 112-Point Cage
🗞 Nifty Summary
Nifty opened with a gap down of 148 points after a weekend filled with geopolitical noise. The very first one-minute candle itself carved out the full 112.45-point range for the day — and then the session just lived inside that range till the close. Compact, yes. But plenty of drama packed in.
The day closed at 24,238.50 (adjusted close 24,238.50). What makes today’s candle interesting is that it fits a near-perfect inside bar pattern by the book — range well within the previous session’s range, both sides contained. With the ATR sitting at 239.60, today’s contraction feels deliberate. The market seems to be coiling energy ahead of tomorrow’s weekly expiry.
My back test data says most Mondays tend to stay within the IB range, or give a fakeout on either side. So I’m usually not looking for an IB breakout trade on Mondays — and that read played out today. The IBL breakdown ended up offering a nice contra trade opportunity instead.
Tomorrow’s opening is the one thing I’ll be watching closely before forming any directional bias for the session. The expiry session usually brings the volatility that today’s session held back.
🛡 5 Min Intraday Chart with Levels
📉 Daily Time Frame Chart with Intraday Levels
🕯 Daily Candle Breakdown
Open: 24,190.05
High: 24,266.10
Low: 24,135.85
Close: 24,238.50
Change: −95.80 (−0.39%)
🏗️ Structure Breakdown
Type: Bullish Inside Bar — demand absorbed the gap-down open and recovered toward the upper half
Range: ≈ 130 points — moderate volatility
Body: ≈ 48 points — mild buyer pressure, close well off the lows but below open
Upper Wick: ≈ 28 points — some supply resistance near the highs
Lower Wick: ≈ 54 points — decent demand response from the session lows
🛡 5 Min Intraday Chart
⚔️ Gladiator Strategy Update
ATR: 239.60
IB Range: 112.45 → Medium
Market Structure: Balanced
Trade Highlights:
10:34 Short Trade: Target Hit (R:R 1:4.16)
12:11 Long Trade: SL Hit
12:52 Long Trade: Target Hit (R:R 1:3.41)
Trade Summary: The short at 10:34 worked well — a 1:4.16 on a Monday inside-range session is not something to take lightly. The 12:11 long got stopped out, which is part of the game in a range-bound session where neither side commits fully. Good that the 12:52 long came back and delivered a 1:3.41. Two targets and one SL — the system held its shape today. Overall a decent Monday, especially given the kind of compressed price action we were working with.
🧱 Support & Resistance Levels
Resistance Zones: 24,260 | 24,300 | 24,360 ~ 24,380 | 24,430 | 24,460
Support Zones: 24,200 ~ 24,160 | 24,100 | 24,030
🧠 Final Thoughts
“Stillness is not absence of direction — it is direction holding its breath.”
Today was one of those sessions where the market said a lot by doing very little. A 148-point gap down at open, and then nearly the entire day spent inside that first candle’s range. The drama was real, just compressed.
For tomorrow, the levels I’m watching are 24,260 and 24,300 on the upside — if those give way early, the 24,360 ~ 24,380 zone becomes the next conversation. On the downside, 24,200 ~ 24,160 is the floor that needs to hold. A clean break below that, and 24,100 comes into the picture quickly on an expiry session.
Tomorrow I’ll let the opening play out before deciding anything. Weekly expiry sessions can flip fast — the plan is to watch, wait for a setup that makes sense, and not force a trade just because it’s expiry day.
✏️ Disclaimer
This is my personal digital diary and represents my own analysis and point of view. It is not financial advice; please consult a professional advisor before making any trading decisions.
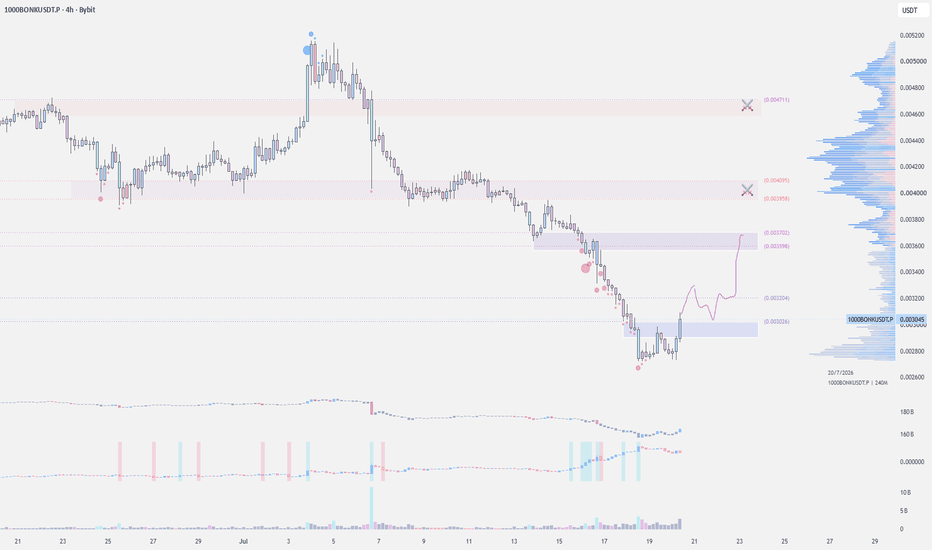
$BONK - Long Trade IdeaAfter weeks of bleeding lower, BINANCE:BONKUSDT is finally showing signs of life. Buyers are stepping in with increasing volume while price reclaims local support, making this an interesting spot for a relief rally if momentum continues.
I'm looking for continuation into the next supply zones as long as the recent low holds.
It's looking good here with volume kicking in.
Longing here at .0030–.0028s
Stop: Just below the recent low.
Targets:
TP1: .0035–.0037
TP2: .0039–.0042
TP3: .0045–.0047
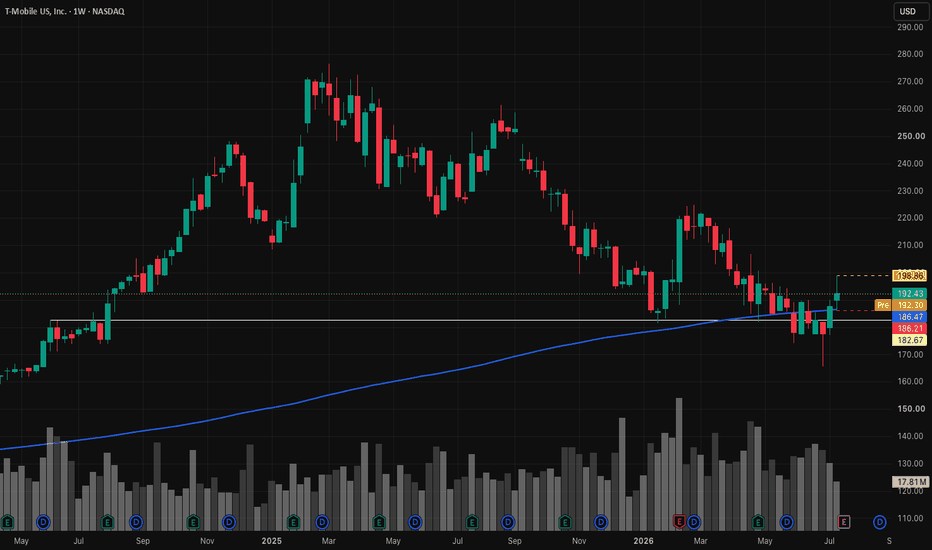
TMUS | Continued stock growth- Timeframe: Weekly
- Trade type: Buy stop order
- Price: 198.86
- Take Profit: Open
- Stop Loss: 186.21 (-6.40 %)
Idea: Long on a breakout above last week's high - bullish momentum continuation.
Entry: Buy stop above last week’s high.
Stop-loss: Below the low of the same candle.
If the weekly candle closes below this level, the trade is invalidated.
Take Profit: Trailing stop following the lows of new weekly candles.
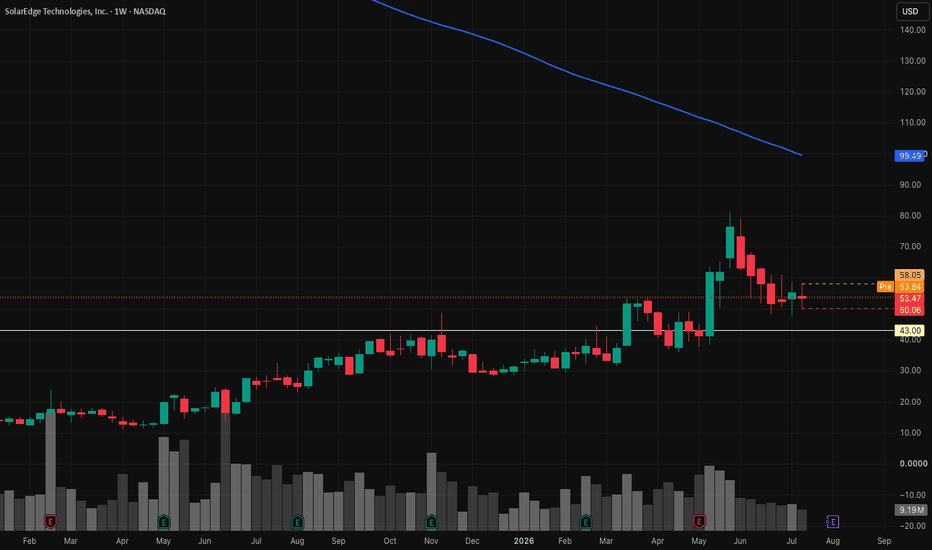
SEDG | The time to go long has come- Timeframe: Weekly
- Trade type: Buy stop order
- Price: 58.05
- Take Profit: Open
- Stop Loss: 50.06 (-13.80 %)
Idea: Long on a breakout above last week's high - bullish momentum continuation.
Entry: Buy stop above last week’s high.
Stop-loss: Below the low of the same candle.
If the weekly candle closes below this level, the trade is invalidated.
Take Profit: Trailing stop following the lows of new weekly candles.
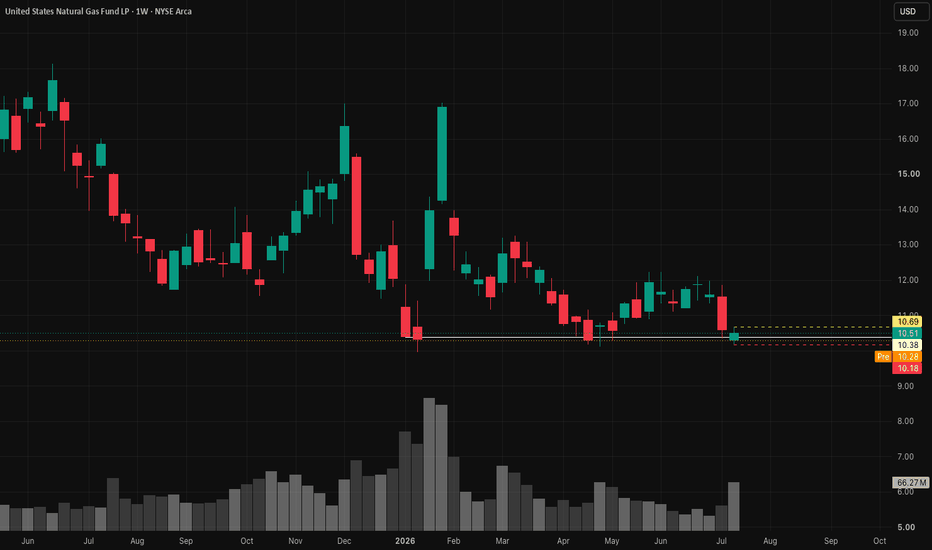
UNG | The time to go long has come- Timeframe: Weekly
- Trade type: Buy stop order
- Price: 10.69
- Take Profit: Open
- Stop Loss: 10.18 (-4.70 %)
Idea: Long on a breakout above last week's high - bullish momentum continuation.
Entry: Buy stop above last week’s high.
Stop-loss: Below the low of the same candle.
If the weekly candle closes below this level, the trade is invalidated.
Take Profit: Trailing stop following the lows of new weekly candles.
LLY | Continued stock growth- Timeframe: Weekly
- Trade type: Buy stop order
- Price: 1,196.29
- Take Profit: Open
- Stop Loss: 1,134.40 (-5.20 %)
Idea: Long on a breakout above last week's high - bullish momentum continuation.
Entry: Buy stop above last week’s high.
Stop-loss: Below the low of the same candle.
If the weekly candle closes below this level, the trade is invalidated.
Take Profit: Trailing stop following the lows of new weekly candles.
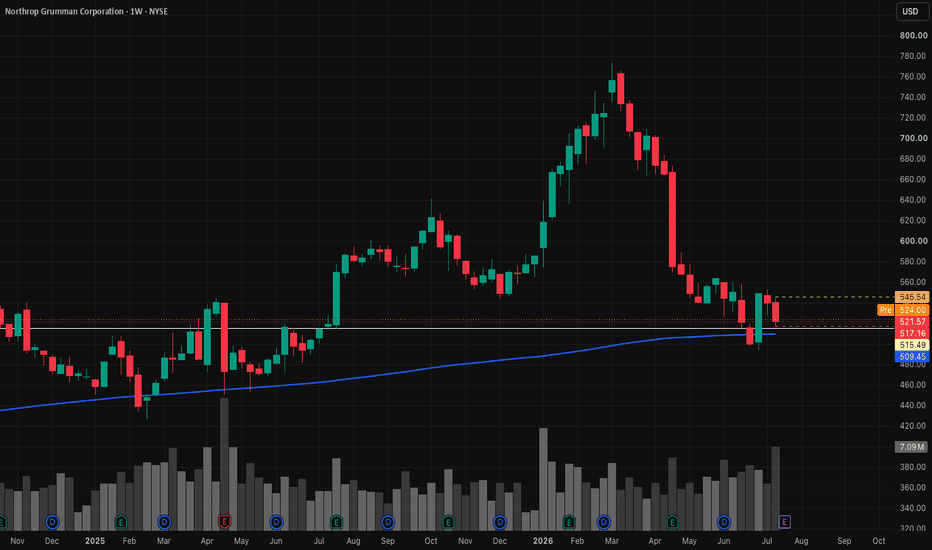
NOC | Continued stock growth- Timeframe: Weekly
- Trade type: Buy stop order
- Price: 545.54
- Take Profit: Open
- Stop Loss: 517.16 (-5.20 %)
Idea: Long on a breakout above last week's high - bullish momentum continuation.
Entry: Buy stop above last week’s high.
Stop-loss: Below the low of the same candle.
If the weekly candle closes below this level, the trade is invalidated.
Take Profit: Trailing stop following the lows of new weekly candles.
SLB | Continued stock growth- Timeframe: Weekly
- Trade type: Buy stop order
- Price: 48.73
- Take Profit: Open
- Stop Loss: 46.43 (-4.70 %)
Idea: Long on a breakout above last week's high - bullish momentum continuation.
Entry: Buy stop above last week’s high.
Stop-loss: Below the low of the same candle.
If the weekly candle closes below this level, the trade is invalidated.
Take Profit: Trailing stop following the lows of new weekly candles.
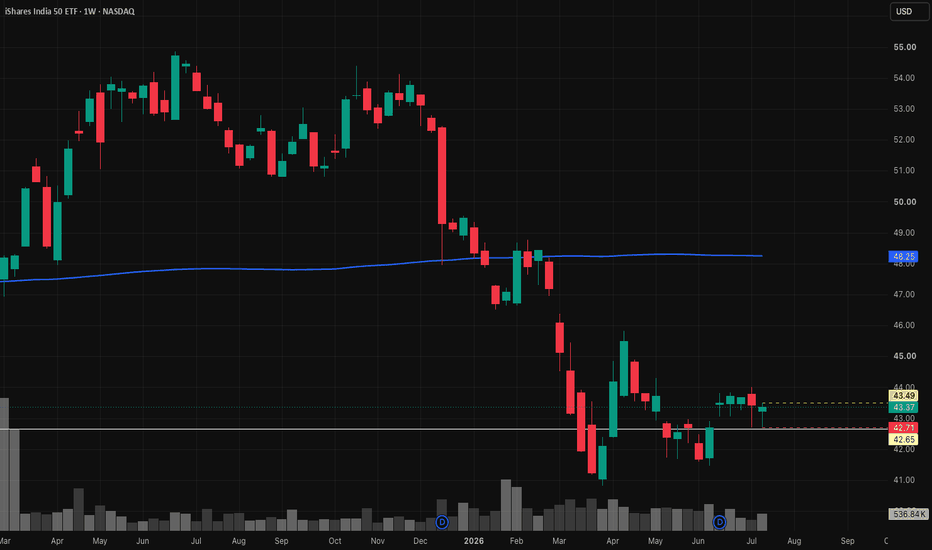
INDY | The time to go long has come- Timeframe: Weekly
- Trade type: Buy stop order
- Price: 43.49
- Take Profit: Open
- Stop Loss: 42.71 (-1.80 %)
Idea: Long on a breakout above last week's high - bullish momentum continuation.
Entry: Buy stop above last week’s high.
Stop-loss: Below the low of the same candle.
If the weekly candle closes below this level, the trade is invalidated.
Take Profit: Trailing stop following the lows of new weekly candles.
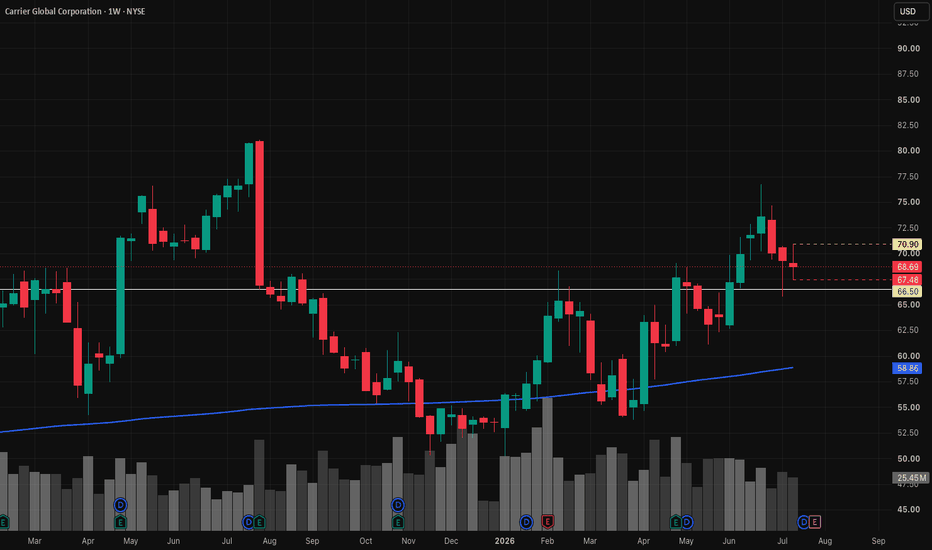
CARR | Continued stock growth- Timeframe: Weekly
- Trade type: Buy stop order
- Price: 70.90
- Take Profit: Open
- Stop Loss: 67.48 (-4.80 %)
Idea: Long on a breakout above last week's high - bullish momentum continuation.
Entry: Buy stop above last week’s high.
Stop-loss: Below the low of the same candle.
If the weekly candle closes below this level, the trade is invalidated.
Take Profit: Trailing stop following the lows of new weekly candles.
EURUSD- Bullish Bias, Awaiting DiscountThe higher-time-frame outlook remains bullish. Price continues to respect the overall structural map after breaking key higher-high pivots. Along the way, higher-time-frame internal liquidity and the inducement leg were taken before price engineered liquidity and mitigated into major higher-time-frame points of interest, reinforcing the broader bullish narrative.
On the intermediate time frame, price has respected those higher-time-frame areas by breaking lower highs, printing new highs, sweeping internal liquidity, and engineering additional liquidity legs. This expansion has driven price into a key intermediate point of interest, adding further confluence to the existing higher-time-frame bullish structure.
For the upcoming week, I’m looking for sell-side liquidity to be taken before any continuation higher. Ideally, price retraces into the midterm order block beneath the inducement leg, allowing for a deeper mitigation before bullish expansion resumes.
One detail supporting this expectation is the rejection from the recent highs. The wick at the previous high, along with the rejection around the higher-time-frame structural reference (purple level), suggests a bearish retracement may develop before the next bullish move. Even so, this remains a retracement within an overall bullish market structure unless price proves otherwise.
The purple structural levels are plotted to highlight higher-time-frame internal structure and provide additional confluence when tracking potential turning points.
For now, patience remains the priority. I’ll let the market reveal its next move, track the footprints as they develop, and wait for confirmation before considering execution.
EURGBP: Bearish Bias, Awaiting RetracementsThe higher-time-frame outlook has shifted bearish after last week’s move validated the downside objective and confirmed the break of key lows. With that structural shift in place, my focus is now on continuation toward lower liquidity.
Before looking for short opportunities, I’m expecting price to retrace by taking buy-side liquidity and sweeping the current internal inducement. Ideally, this retracement will deliver price into lower-time-frame points of interest, where I’ll be looking for higher-time-frame candle acceptance to confirm bearish continuation.
If those areas fail to produce the expected reaction, I’ll remain patient and allow price to retrace deeper into the extreme premium area before reassessing for additional bearish confirmation.
For now, patience remains the priority. I’ll let the market open, follow the footprints as they develop, and wait for price to come into my areas of interest before considering execution.
GBP/JPY- Bullish Bias, Awaiting PullbackThe higher-time-frame outlook remains bullish after price broke a significant high, keeping the overall market structure intact and favoring continuation toward higher liquidity.
For now, I’m expecting a bearish pullback to develop. My primary objective is to see sell-side liquidity taken, followed by a retracement into the 50% equilibrium and my higher-time-frame point of interest.
If price respects that area and lower-time-frame confirmations begin to develop, I’ll be looking for bullish continuation. If the zone fails to hold, I’ll shift my focus to the deeper extreme point of interest, where I’d have greater interest in searching for long opportunities.
Until then, patience is key. I’m letting price come to my areas of interest and waiting for confirmation before considering execution. The chart remains the edge—now it’s time to see what the market delivers this week.