Bitcoin's Final Shakeout Before the Bottom?Bitcoin isn't doing anything unusual.
In fact, it's doing what it has done before.
The setup 📊
When you overlay the current cycle with the previous one, the similarities become hard to ignore.
The sequence looks very familiar:
• Expansion phase
• Cycle peak
• Sharp decline
• Extended correction
Up to this point, Bitcoin has been tracking that roadmap surprisingly well.
Where are we now?
If we use the previous cycle as a reference, the final bottom didn't arrive immediately after the correction.
Before the recovery began, price printed one last low.
The clue came from momentum 🧠
Price continued lower.
But RSI didn't.
Instead, RSI started showing strength beneath the surface by forming a bullish divergence.
That divergence was an early indication that bearish momentum was fading.
Not long after, the market found its bottom and a new cycle began.
What could happen next?
If the current cycle continues to mirror the previous one, we may still see:
• One final dip in price
• A completed bullish RSI divergence
• A shift in momentum back toward the bulls
That trio could become the recipe for a major bottom.
So the question is:
Is Bitcoin preparing for one last shakeout before the next leg higher... or will this cycle write a different story?
⚠️ Disclaimer: This is not financial advice. Always do your own research and manage risk properly.
📚 Stick to your trading plan regarding entries, risk, and management.
Good luck! 🍀
All Strategies Are Good; If Managed Properly!
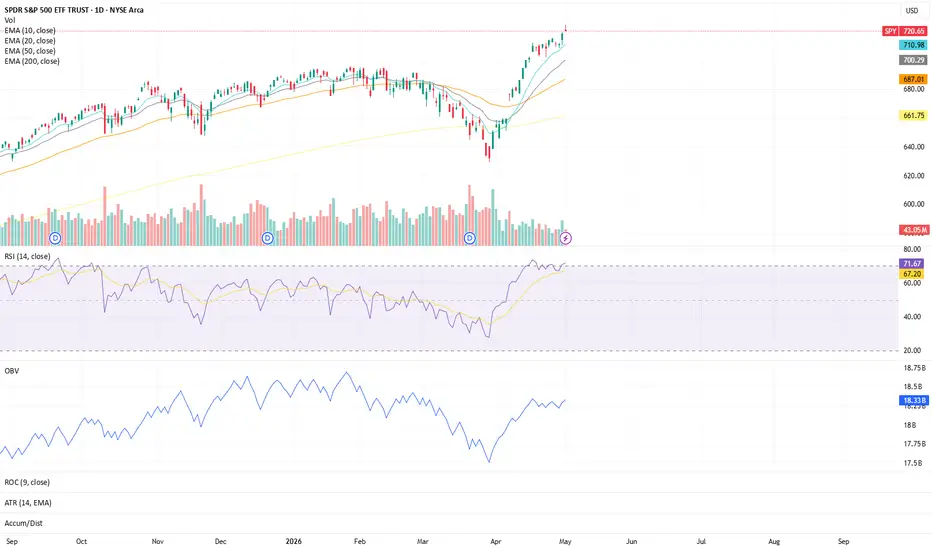
~Richard Nasr SPY Structure Update (Daily Chart)SPY continues to maintain one of the most constructive trend structures on the chart, with price holding above all major moving averages.
The 10, 20, 50, and 200 EMAs are all trending higher
The EMA stack remains fully aligned, reflecting strong trend participation across multiple time horizons
Price continues to trade above key moving averages, keeping the broader structure intact
Momentum conditions remain supportive:
RSI is currently near 74, holding in the upper range while maintaining slight upward momentum
Elevated RSI readings continue to reflect strong participation, though monitoring for signs of exhaustion remains important
OBV continues to show constructive progress, suggesting accumulation and participation remain supportive of the current trend
This combination of trend alignment, momentum, and participation continues to support a healthy structural backdrop.
What I'm Watching 👀
Whether SPY can continue holding above the rising 10/20 EMA cluster on any short-term pullbacks
If the 50 EMA continues to accelerate higher, reinforcing broader trend alignment
Whether RSI can maintain strength without developing meaningful bearish divergence
Continued confirmation from OBV as price pushes near recent highs
At the moment, structure remains constructive, with trend, momentum, and participation largely moving in the same direction. Monitoring how price responds to any periods of consolidation or pullback remains important as extension conditions continue to develop.
⭐ Final Clarity Note ⭐
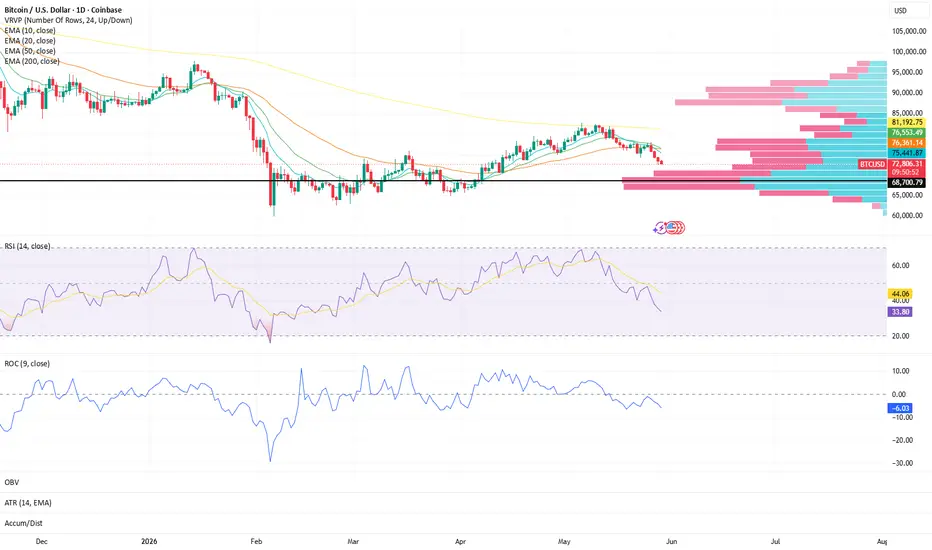
This is a structure-based observation, not a prediction — focused on trend alignment, momentum behavior, participation, and liquidity positioning across key structural levels. BTC Structure Update (Daily Chart)Bitcoin continues to face short-term pressure as momentum and trend alignment weaken.
The 10 EMA and 20 EMA have now crossed below the 50 EMA, signaling a deterioration in short-term trend structure
The 50 EMA remains overhead, acting as an important area to monitor for any recovery attempts
The 200 EMA continues to represent the broader trend reference point, remaining well above current price
Momentum conditions have also weakened:
RSI is currently near 34, reflecting continued selling pressure on the daily timeframe
ROC remains negative at -5.72, indicating momentum is still biased to the downside despite occasional stabilization attempts
Participation and momentum remain under pressure as price trades below key moving average resistance
What I'm Watching 👀
Whether price can stabilize near current levels or continue lower toward the Point of Control, where a significant amount of historical volume has been transacted
If the 10 and 20 EMAs begin flattening or continue accelerating lower
Whether RSI can begin recovering from current levels or remains under pressure
How momentum behaves as price approaches major volume-supported areas
At the moment, structure remains under pressure, with momentum and trend alignment favoring caution until signs of stabilization begin to emerge.
⭐️ Final Clarity Note ⭐️
This is a structure-based observation, not a prediction — focused on trend alignment, momentum behavior, participation, and liquidity positioning across key structural levels.  Short
Short
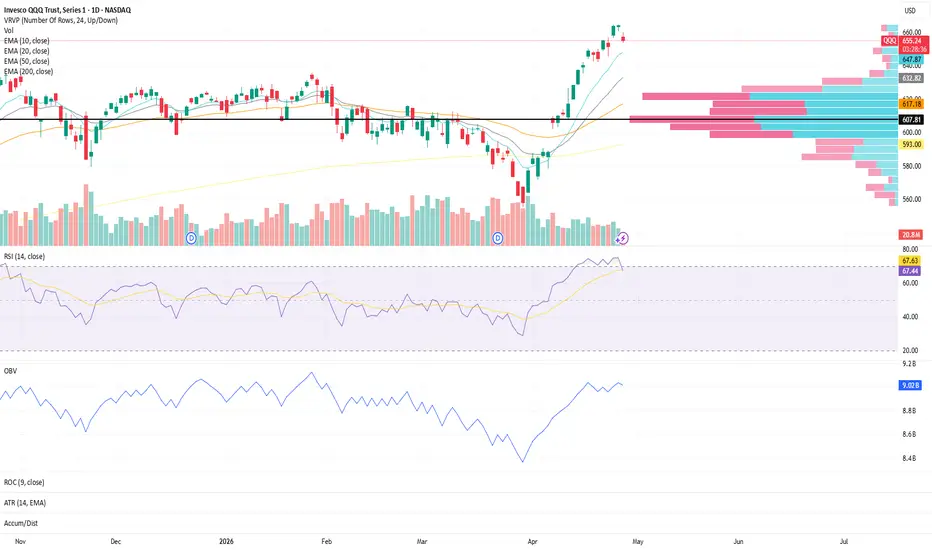
SPY Structure Update (Daily Chart)SPY continues to maintain constructive structure as price holds above all major moving averages following the April recovery phase.
The 10 & 20 EMAs remain positively sloped, continuing to reflect sustained short-term momentum
The 50 EMA has continued turning higher, reinforcing intermediate trend support
The 200 EMA remains steadily upward sloping, keeping broader structure intact
Price is currently trading above the major volume concentration zone, showing continued acceptance away from prior high-volume positioning.
Momentum conditions remain constructive overall:
RSI continues holding in the upper range, showing sustained participation without a major momentum breakdown
OBV remains elevated and structurally healthy, suggesting participation has not meaningfully deteriorated
This remains a structurally healthy trend environment, though price is beginning to move further away from key support clusters.
What I’m Watching 👀
Whether SPY can continue holding above the rising 10/20 EMA cluster during short-term pullbacks
If the 50 EMA continues accelerating higher, strengthening broader trend alignment
Whether RSI can maintain constructive positioning without significant bearish divergence
How price behaves relative to the current high-volume area below, which may act as an important structural support zone on retracements
At the moment, trend structure remains constructive, but monitoring participation and momentum behavior near recent highs remains important as extension conditions continue developing.
⭐️ Final Clarity Note ⭐️:
This is a structure-based observation, not a prediction — focused on trend alignment, momentum behavior, participation, and liquidity positioning across key structural levels. BTC Weekly Structure Update:(Daily chart)Bitcoin continues to trade in a structurally mixed environment as price compresses between key moving averages.
The 50 EMA is currently acting as support
The 10 & 20 EMAs are acting as near-term resistance, showing short-term pressure against price expansion
The 200 EMA remains above current price and continues to hold steady, keeping longer-term overhead structure intact
Momentum conditions continue to soften:
RSI (14) currently at 47.04
Both short-term RSI and long-term RSI continue trending downward, reflecting weakening momentum participation
ROC is beginning to show slight upward curvature, but remains in negative territory and is still under pressure overall
This creates a structure where price is attempting stabilization, but confirmation remains incomplete.
What I’m Watching 👀
Whether BTC can continue holding the 50 EMA as support
Sustained holding above the 50 could open the door for another test of the 200 EMA near 81,639
A breakdown below the 50 EMA could shift focus toward the Point of Control near 68,700, where higher-volume positioning previously developed
At the moment, this looks more like a compression and reaction phase rather than confirmed expansion. Monitoring how price behaves between these key structural levels remains important.
⭐️ Final Clarity Note ⭐️:
This is a structure-based observation, not a prediction — focused on trend alignment, momentum behavior, and liquidity positioning across key moving averages.  Long
Long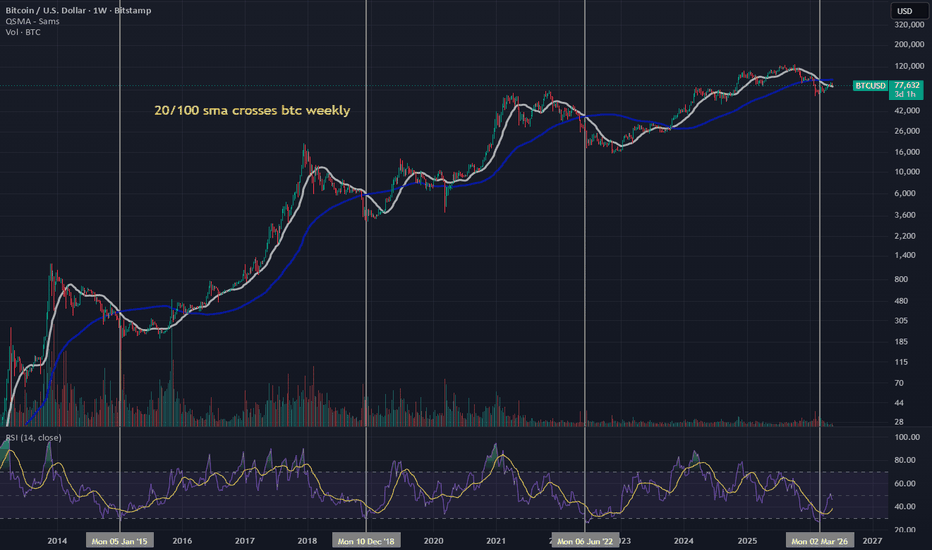
 Short
Short
 Short
Short
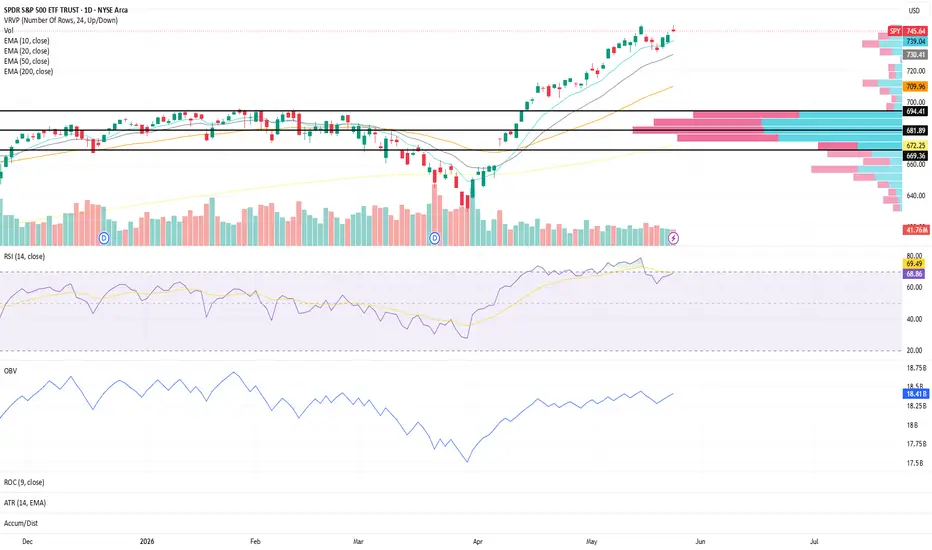
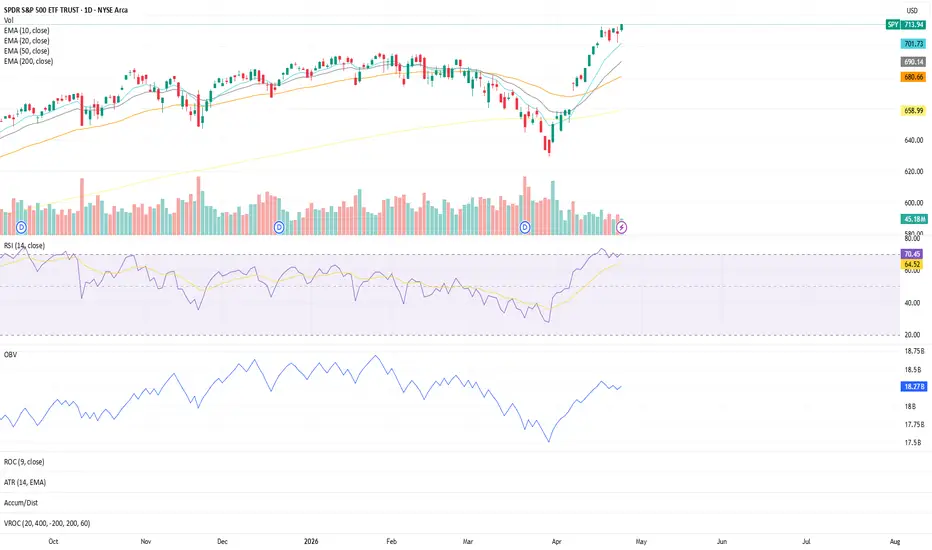
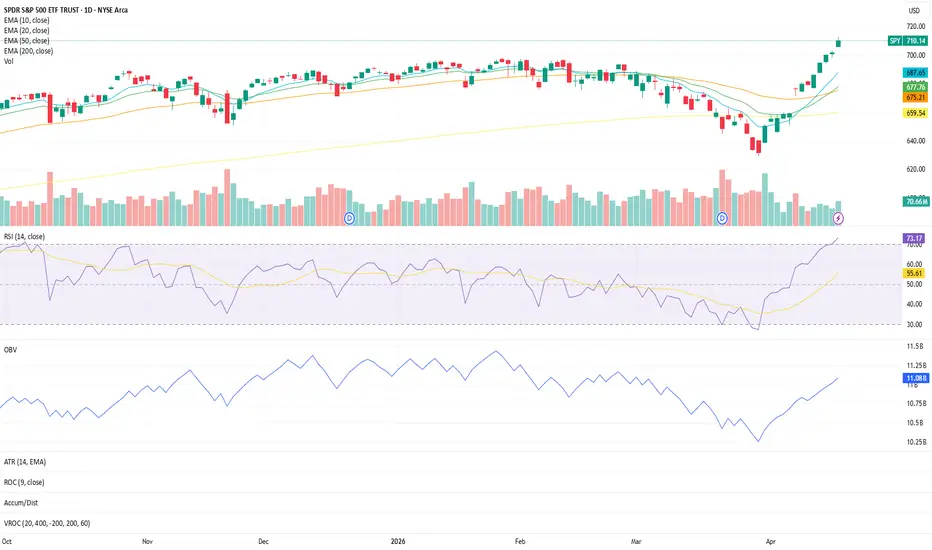
SPY Structure Update (Daily Chart)The 10, 20, and 50 EMAs remain in healthy alignment and continue showing constructive upward curvature. The 200 EMA remains below price and is also steadily trending upward, keeping the broader structure constructive across multiple layers.
RSI is currently holding around 68, showing continued participation while remaining in a strong momentum range.
OBV has maintained an upward trend since March 31st and is currently consolidating near recent highs — something I continue watching closely for confirmation of sustained participation rather than deterioration.
One area that stands out structurally is the move through the 694 value high zone. Once price reclaimed and pushed through that area, momentum expanded noticeably and structure accelerated higher from there.
👀 What I’m Watching
RSI behavior for any loss of momentum or downward divergence
OBV participation to see if accumulation continues supporting price structure
Whether short-term EMA alignment remains intact during consolidation phases
⭐ Final Clarity Note ⭐
Current structure remains constructive with trend alignment, participation, and momentum still generally supporting higher price acceptance. As always, I’m not focused on prediction — I’m focused on observing whether structure, momentum, and participation continue confirming one another across layers. Short 
 Education
SPY Structure Update (Daily Chart)Price continues to respect short-term momentum structure as the trend rebuilds off the recent pullback.
The 10 & 20 EMAs are maintaining upward curvature, showing sustained short-term momentum
The 50 EMA has turned higher as well, though with a more gradual slope — indicating developing support rather than aggressive expansion
The 200 EMA continues its steady upward trajectory, keeping the broader structure intact
Since the March 30th pivot, both RSI and OBV have shown constructive behavior:
RSI holding in the upper range → consistent participation
OBV trending higher → confirming accumulation rather than divergence
This combination suggests the move is being supported, not just price-driven.
What I’m Watching:
Whether price can hold above the rising 10/20 EMA cluster on any pullbacks
If the 50 EMA begins to accelerate, aligning more closely with short-term momentum
Continued confirmation from OBV (no divergence) and RSI holding above midline
Any signs of compression vs expansion (ATR behavior) as price approaches local highs
At this stage, structure remains constructive, but monitoring how price behaves near these levels will help determine whether this is continuation or early signs of exhaustion.
⭐️ Final Clarity Note ⭐️:
This is a structure-based observation, not a prediction — focusing on alignment between trend, momentum, and participation.  Long
Long
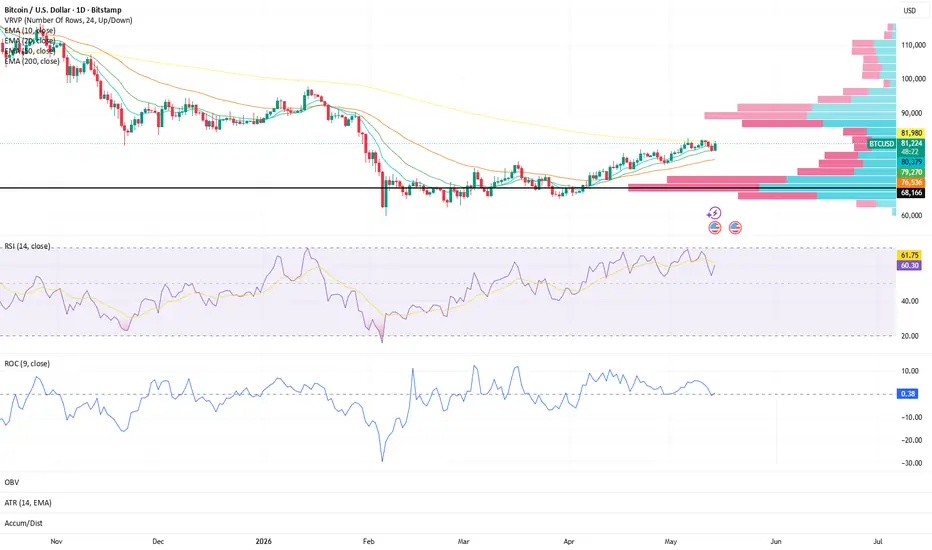
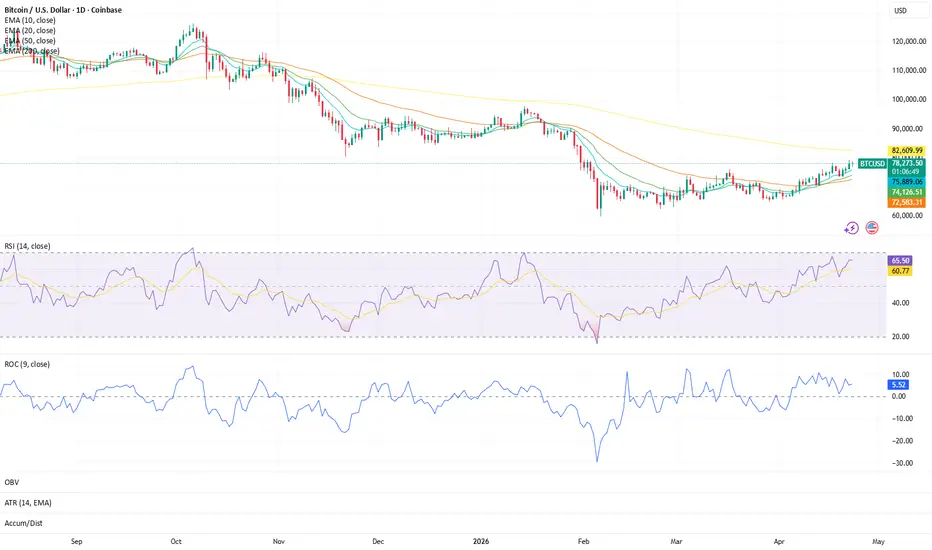
Bitcoin Structure Update | Daily TimeframeBitcoin continues to show signs of developing structure beneath the surface, even as price remains below the longer-term trend.
On the daily chart, the 10 and 20 EMAs remain positioned above the 50 EMA, indicating that short-term momentum is still intact and gradually building. This progression suggests early-stage structure attempting to push higher toward the 200 EMA, which remains the key macro barrier.
Momentum & Participation:
RSI (~65) is holding firm in bullish territory, reflecting steady participation rather than exhaustion
ROC remains positive but has flattened, signaling a pause in momentum rather than a reversal
This combination points to a market that is not overextended, but consolidating strength.
Structural Takeaway:
Short-term trend → constructive
Intermediate trend → still developing
Macro trend → not yet reclaimed (below 200 EMA)
If structure continues to hold and momentum re-expands, this sets up a potential test of the 200 EMA, which will be the defining level for whether this shifts from recovery → trend continuation.
⭐️ Final Clarity Note ⭐️:
This is a steady structure build, not a breakout yet.
Momentum is holding, not accelerating — and that distinction matters. What a clean breakout setup looks likeOn the 1-hour timeframe, BULL is showing a textbook transition from compression into expansion, supported by alignment across structure, momentum, and participation.
Structure (EMA Alignment):
Price is now trading above the 10 / 20 / 50 EMAs, all stacked above the 200 EMA
This reflects short-term trend control with higher timeframe support building underneath
Prior consolidation phase created a tight base → now resolving higher
Momentum (RSI):
RSI holding in the upper range (~80+)
Indicates sustained momentum rather than a single spike
No major bearish divergence present → momentum remains intact
Participation (OBV):
OBV continues trending higher
Confirms buyers are actively supporting the move, not just price drifting upward
Expansion (ATR):
ATR is beginning to rise after a period of contraction
Signals volatility expansion → trend continuation environment
🔍 What This Setup Represents
This is a classic structure sequence:
Compression → Breakout → Momentum Hold → Expansion
When all four phases align:
Structure leads
Momentum confirms
Participation validates
Volatility expands
That’s when moves tend to sustain rather than fade quickly
⚠️ Context Note
At current levels, price is extended short-term, so this becomes more about:
Monitoring pullback structure
Watching if EMAs continue to act as support
Observing whether momentum stays elevated or begins to fade
⭐️ Final Clarity Note ⭐️:
This isn’t about predicting the next move —
it’s about recognizing when market structure, momentum, and participation are all aligned.
That alignment is what turns simple breakouts into sustained trends.  Education